The U.S. health care system has undergone substantial changes over the past decade, including implementation of various initiatives designed to improve the quality and safety of patient care. Although efforts to improve inpatient psychiatric care have been fewer and slower to develop, steps have been taken toward improving care through collection and public reporting of hospital data on measures reflecting quality of care. Freestanding psychiatric facilities accredited by the Joint Commission were required to begin reporting on the Hospital-Based Inpatient Psychiatric Services (HBIPS) Core Measure Set by January 1, 2011, and mandated reporting for psychiatric, acute care, and critical access hospitals with psychiatric units began on October 1, 2013, under the Centers for Medicare and Medicaid Services (CMS) Inpatient Psychiatric Facility Quality Reporting Program. Data for selected HBIPS measures are available on the CMS Hospital Compare website.
Two HBIPS measures reflect long-standing concern regarding the use, and overuse, of containment methods in psychiatric settings (
1–
3): hours of patient seclusion per 1,000 inpatient-hours (HBIPS-3) and hours of physical restraint per 1,000 inpatient-hours (HBIPS-2). Wide variability in the use of seclusion and restraint across units and hospitals has been noted by researchers, and much of this variability seems to be a function of institutional factors rather than patient characteristics (
4,
5). According to the Joint Commission, “Restraint and seclusion should be a last resort, used after other interventions have been unsuccessful, and done to protect the patient, staff and other patients in the area from physical injury” (
6). CMS similarly allows for use of seclusion and restraint only “when less restrictive interventions have been determined to be ineffective to protect the patient, a staff member, or others from harm” (
7). To my knowledge, however, no benchmarks from regulatory or professional organizations define acceptable rates of seclusion and restraint. Thus a hospital’s staff may be interpreting the criteria under which seclusion or restraint are appropriate in a way that consistently leads to rates of use that are unacceptably high, without realizing that their practices are extreme, and when numerous hospitals have similarly high rates, none may be identifiable as an outlier.
Public reporting of data on Hospital Compare is intended to allow health care consumers and other stakeholders to compare hospitals (
8). In theory, public reporting also provides an incentive for hospitals to improve quality of care. An additional benefit of routine collection of such data is that it allows hospitals to track their performance over time—an integral part of any quality improvement program. These benefits, however, can be realized only to the extent that the data collected and reported are accurate and complete.
Lack and limitations of available data pose a serious barrier to systems-level studies of U.S. inpatient psychiatric care (
9), and few large-scale studies have examined use of seclusion and restraint in psychiatric facilities. Rasinski et al. (
10) analyzed HBIPS data reported to the Joint Commission, but historical data from the Joint Commission are available only for a fee. Analyses of data from the National Database of Nursing Quality Indicators (NDNQI) have also been published (
5,
11), but NDNQI data are proprietary and collected only from participating hospitals.
This study was undertaken to examine variability among U.S. hospitals in rates of seclusion and physical restraint, including effects of hospital type and ownership, as reported on the CMS Hospital Compare website. The broader aim was to highlight the wide variability in use of these measures and to draw attention to the data source as a resource deserving more accurate data from hospitals and more attention from patient safety organizations, regulatory agencies, policy makers, and researchers. The need for more informative measures of seclusion and restraint use is also discussed.
Methods
Data Source and Variables
Facility-level HBIPS data were downloaded from Hospital Compare in December 2019. Each row in the data files comprises data reported by one hospital for 1 year. Annual data were available from 2013 (limited to April–December) through 2017. Because analyses of publicly available, deidentified data do not meet the definition of human subjects research under 45 CFR 46.102, institutional review board approval for the study was not needed. My SAS code and R code are available on request to allow results to be fully reproduced.
The HBIPS seclusion rate and restraint rate are each computed from two pieces of information: total hours spent in seclusion/restraint for the year (labeled “numerator” in the data files) and total patient-days for the year (labeled “denominator”). The rate is computed as hours in seclusion/restraint per 1,000 patient-hours, which requires converting the denominator value given in the data from days to hours. Because the variable labeled “denominator” is not the denominator used to compute the rate of seclusion or restraint, there are many cases in the data where hospitals have mistakenly reported patient-hours as the denominator for at least 1 study year, resulting in a rate that is too small by a factor of 24.
The study was limited to two hospital types: psychiatric and acute care. Proprietary and physician-owned hospitals were classified as for profit, government hospitals (federal, state, etc.) were grouped together, and nonprofit facilities were grouped together. These ownership groupings provided a sufficient number in each of the six type-ownership combinations to allow meaningful examination of the distributions of seclusion and restraint rates.
Data Errors and Cleaning
Errors in the denominator data can be discussed in terms of three types. The first is described above, where a hospital mistakenly reports patient-hours for 1 or 2 years but patient-days for most other years. This error is apparent when a denominator is roughly 24 times a hospital’s typical denominator. For example, one hospital reported restraint denominators of 1,359; 2,007; and 1,346 and seclusion denominators of 1,359; 48,168; and 1,346. Note that 48,168 is the number of hours in 2,007 days. Errors of this type were corrected.
The second type of denominator error is apparent when the denominator values for 1 or 2 years are atypically low for a hospital but by a factor substantially smaller than 24. For example, one hospital reported 1,637; 2,175; and 3,149 patient-days for 2013, 2014, and 2016, respectively, but 365 patient-days for both 2015 and 2017. Here, apparently, the hospital twice reported the number of days in a year (365) rather than the number of psychiatric inpatient-days in the year. Rows where both the seclusion and restraint denominators were judged erroneous were deleted. In some cases, it was impossible to determine with any confidence which of a hospital’s denominator values were correct. For example, one hospital reported consecutive denominator values of 1,574; 12,053; 4,993; 24,188; and 31,674. These hospitals were dropped from the data set.
The third error is a marked discrepancy between the seclusion denominator and restraint denominator for a given year. By the HBIPS definitions, the two denominators should be the same. In cases where they differed by more than 10%, the value closest to the mean of the denominator values for the hospital’s other years was taken to be correct.
Numerator errors are more difficult to detect. A sharp increase or decrease in seclusion or restraint use from one year to the next may occur because of changes in hospital policy or unit practices. In addition, there is no reason for the seclusion and restraint numerators for a given year to be equal, or even similar, so they cannot be compared in order to identify or correct an erroneous value.
To identify hospitals with questionable data, the maximum and minimum denominator values reported by each hospital during the study period were compared; cases where their ratio exceeded 10 were flagged for inspection. Additional errors were identified by comparing hospitals’ maximum and median numerators and by examining the highest seclusion and restraint rates in the data set for outliers.
Data Analysis
For comparison of seclusion and restraint rates by hospital type and ownership, each hospital’s overall seclusion and restraint rates across the 5 study years were computed. These overall rates were computed by summing the hospital’s seclusion/restraint hours across the study years, dividing the result by the sum of the hospital’s patient-hours reported for the measure, and multiplying this quotient by 1,000. This is equivalent to averaging each hospital’s yearly rates, weighting each year’s rate by the year’s number of patient-hours.
Distributions of these overall hospital rates were examined by using violin plots, box plots, and percentiles. Due to extremely long upper tails, percentiles were compared rather than means, and plots of distributions were truncated. The 90th percentile of each distribution was marked with a dashed line segment on each plot. Distributions of seclusion and restraint rates by year were similarly examined.
Within each hospital type, pairwise comparisons of seclusion and restraint rates between for-profit, government, and nonprofit hospitals were carried out by using the nonparametric generalized Wilcoxon test (
12). In the comparisons in this study, the null hypothesis tested was that a randomly chosen hospital from one category was no more or less likely to have a higher seclusion/restraint rate than a randomly chosen hospital from the other category. Evidence against the null is quantified by the test’s p value.
Results
After I excluded 69 critical access hospitals and 58 hospitals with missing hospital type, there were 7,589 rows of data for 1,659 hospitals in the data set, including 7,555 nonmissing seclusion rates and 7,582 nonmissing restraint rates. In the data cleaning process, 62 cases were identified and corrected where patient-hours were apparently reported instead of patient-days, and 331 discrepant denominators were corrected by setting the apparently erroneous value equal to the other measure’s value. In addition, 162 rows of data were removed altogether, in most cases because of erroneous denominators, and several individual restraint rates and seclusion rates were set to missing.
The final data set comprised 7,427 rows of data for 1,642 hospitals. These data included 7,416 nonmissing restraint rates and 7,398 nonmissing seclusion rates. Thus 99% of the original hospitals were retained, as were 97.9% of the original set of nonmissing restraint and seclusion rates. The data included restraint rates for all 5 study years for 1,276 hospitals (78%) and seclusion rates for all 5 study years for 1,254 hospitals (77%). Hospitals averaged 4.5±1.0 years of restraint data and 4.5±1.0 years of seclusion data. Counts of hospitals by type and ownership are provided in
Table 1. Two-thirds (1,088) were acute care hospitals. All but 12 of the government hospitals in the sample were nonfederal (159 state, 89 local, and 83 hospital district or authority).
Rates of Seclusion and Restraint by Hospital Type and Ownership
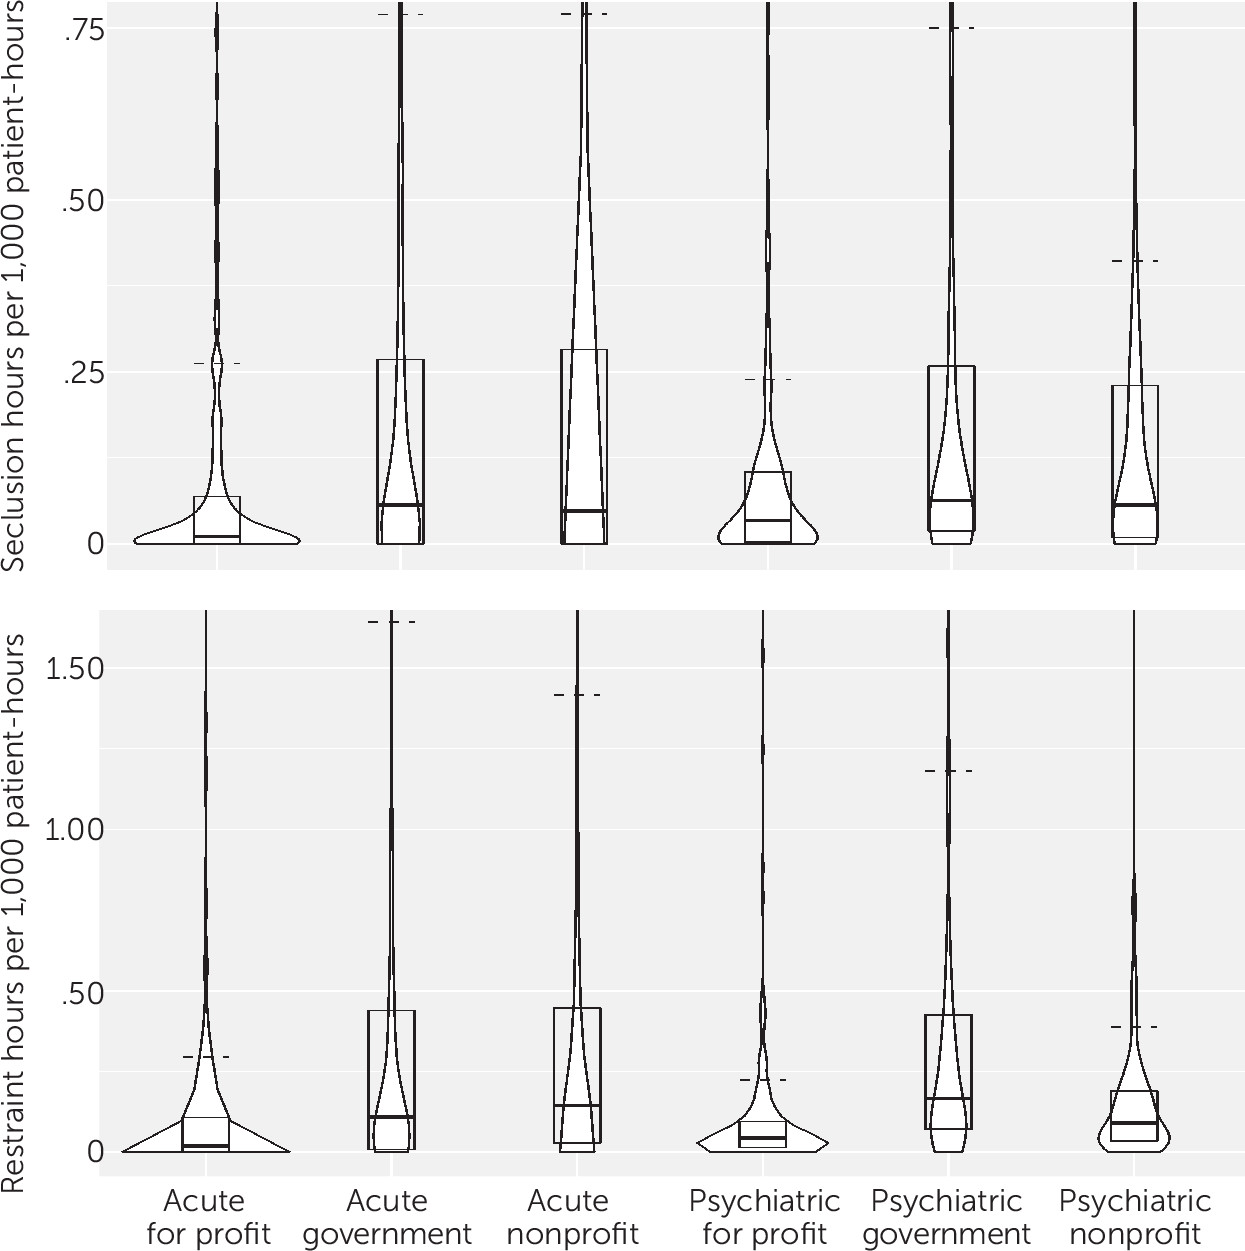
Overall seclusion rates at or near zero were not uncommon, and at least 50% of hospitals for all six combinations of hospital type and ownership reported seclusion rates ≤0.06 for the study period (
Table 1 and
Figure 1). Marked differences were noted, however, in the upper halves of the distributions. Among both acute care and psychiatric hospitals, for-profit hospitals reported substantially lower seclusion rates than did government and nonprofit hospitals.
Differences in restraint rates were apparent at the median and became more pronounced at higher percentiles (
Table 2 and
Figure 1). At and above the median, the pattern for restraint rates resembled the pattern for seclusion rates, with for-profit hospitals reporting lower restraint rates compared with government and nonprofit hospitals. Among psychiatric hospitals, nonprofit hospitals reported much lower rates compared with government hospitals, and for-profit hospitals reported even lower rates.
Trends in Rates of Seclusion and Restraint
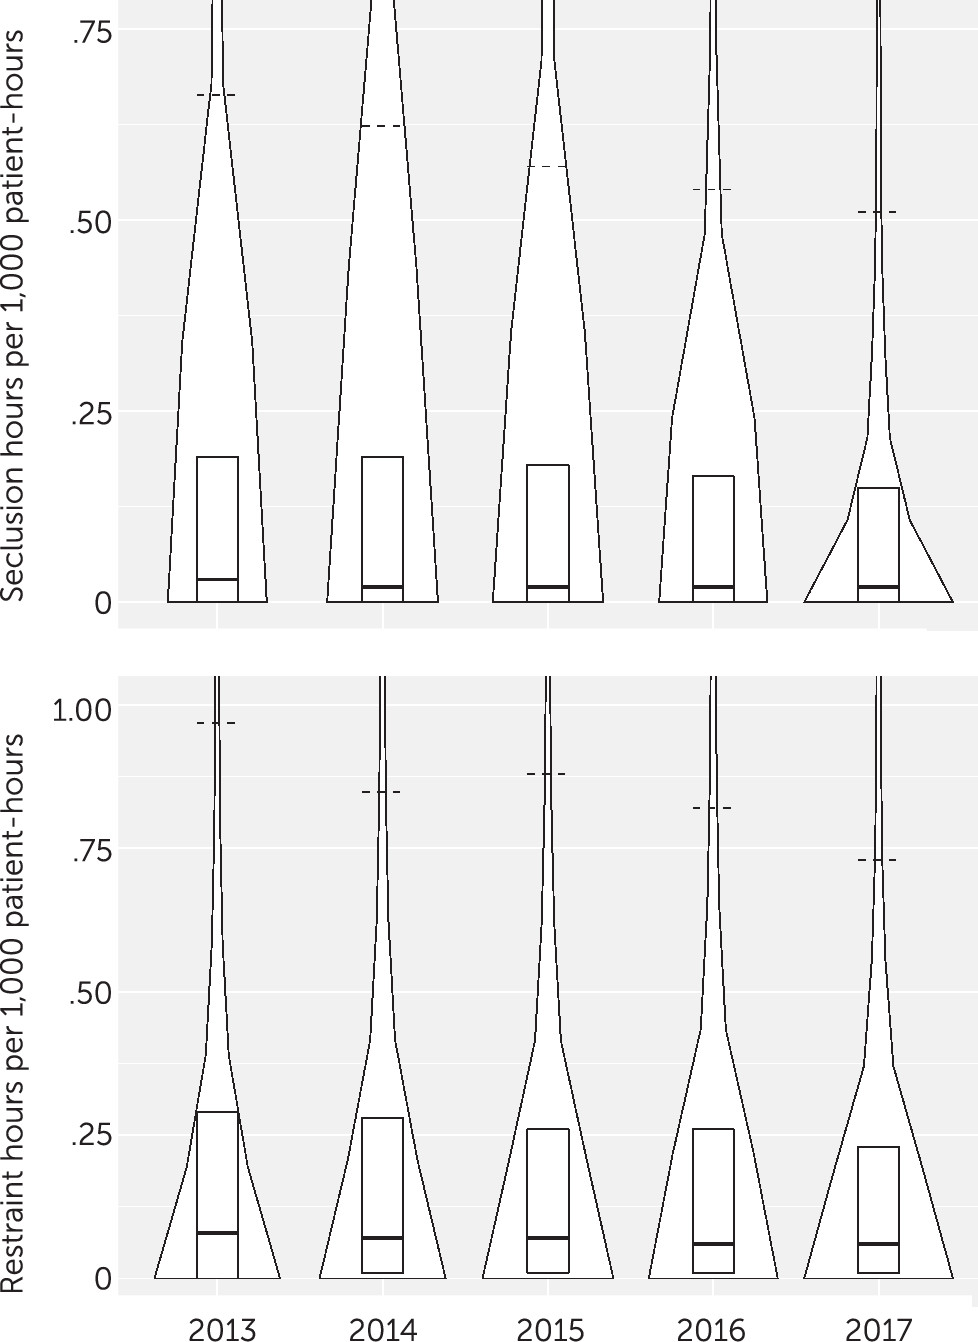
There was some curbing of seclusion rates at the upper end of the distribution during the study period. The 67th, 75th, 90th, and 95th percentiles decreased by 18%, 21%, 22%, and 32%, respectively, from 2013 to 2017 (
Table 3 and
Figure 2). Rates at the upper end of the restraint rate distribution also declined (
Table 3 and
Figure 2), with respective decreases of 25%, 21%, 25%, and 26% for the 67th, 75th, 90th, and 95th percentiles. The 99th percentiles for both seclusion and restraint were also lower by the end of the study period but remained much higher than the 95th percentiles (4.3 and 5.6 times higher, respectively, in 2017). It should be noted that only 14 or 15 hospitals accounted for the top 1% of rates in a year.
Discussion
The potential drawbacks of for-profit health care notwithstanding (
9,
13,
14), for-profit hospitals reported markedly lower rates of both seclusion and restraint than did government and nonprofit hospitals for 2013–2017. Without more detailed data, it is impossible to quantify the extent to which findings such as this are attributable to differences in patient mix between for-profit, government, and nonprofit hospitals. By way of comparison, in a study of responses to injurious assaults on psychiatric units in hospitals participating in the NDNQI, the estimated odds of use of seclusion were lower in for-profit hospitals than in nonprofit hospitals after the analysis controlled for hospital, unit, patient, and assault characteristics, but they were not lower than the odds of seclusion in government hospitals (
5). The analyses of NDNQI data also found that when seclusion was used in federal government hospitals, patients tended to spend longer in seclusion compared with nonfederal government, nonprofit, and for-profit hospitals. Other findings from that study were that the odds of restraint with a device were no lower in for-profit hospitals and that episodes of restraint with a device in for-profit hospitals tended to be shorter than in federal government hospitals but longer than in nonfederal government hospitals. Interestingly, odds of pharmacological restraint were higher in for-profit hospitals compared with government and nonprofit hospitals. Because the NDNQI collects data only on use of seclusion and restraint in response to patient assaults resulting in injury, inconsistencies with this study’s findings are not surprising.
The steady decline in above-the-median rates of seclusion and restraint reported to CMS for 2013–2017 is consistent with a decline in rates observed in a previous study of HBIPS data reported to the Joint Commission by 891 hospitals from October 2008 through July 2016 (
10). These earlier findings are extended here by examination of annual rates through 2017 for a larger sample (1,642 hospitals) and by using HBIPS data from a different database. In another large-scale study of 2007–2013 NDNQI data on responses to injurious assaults on 438 adult psychiatric units, duration of physical restraint episodes and the percentage of restraints involving a device (out of all physical and pharmacological restraints) declined substantially over the study period, and there was some evidence of a decrease in duration of seclusion episodes (
11).
Although it appears that hospitals are making some progress in curbing the use of seclusion and restraint, there is room for further improvement. In 2017, two-thirds of hospitals reported seclusion rates of ≤0.09 hours per 1,000 patient-hours, and two-thirds reported restraint rates of ≤0.15 hours per 1,000 patient-hours. Ten percent of hospitals (90th percentile), however, reported rates roughly five times as high as these 67th percentile rates, and 5% (95th percentile) reported rates over 10 times as high. One nonprofit acute care hospital accounted for the five highest seclusion rates observed, reporting (in chronological order) rates of 224, 181, 174, 123, and 55 seclusion hours per 1,000 patient-hours. It is encouraging that the rates decreased over time, but it seems excessive for patients to be spending, on average, over 1 hour out of every 20 in seclusion. Another nonprofit acute care hospital reported restraint rates that declined from 96 hours to 55 hours per 1,000 patient-hours during the study period. Again, the trend is encouraging, but patients should not be spending an average of 5.5% of their time—over 1.3 hours per day—in physical restraint.
Patient populations vary across hospitals, to be sure, but it seems unlikely that differences of the magnitudes noted above can be fully explained by individual patient characteristics and behavior alone. Even in responses to injurious assaults, taking into account the number of people injured, the level of most severe injury, the type of person suffering the most severe injury (patient, clinical health care staff, etc.), and the assaultive patient’s admission status (voluntary or involuntary) and gender, substantial variability has been found across hospitals in use of seclusion and restraint (
5). In the absence of stronger regulatory guidelines, including benchmarks, this wide variation in clinical practice is not surprising.
There is also much room for improvement in the reporting of data on seclusion and restraint. The HBIPS measures are a helpful start, but more detailed data are needed. Every episode of seclusion involves at least two decisions: a decision to place the patient in seclusion and a decision about when to end the seclusion episode. Similarly, every episode of physical restraint involves a decision to restrain and a decision to stop restraining. Thus, a hospital’s use of seclusion and physical restraint can be quantified in terms of frequency of use and episode duration. Both elements are important, but they are not measured separately by the HBIPS measures. As a result, a hospital that uses seclusion or restraint with atypically high frequency but short duration and a hospital that uses seclusion or restraint with atypically low frequency but long duration may both report hours of seclusion or restraint per 1,000 patient-hours that are within the typical range. Ideally, both hospitals would be identifiable as outliers and would recognize that the frequency or duration of their seclusion or restraint episodes may need to be reduced.
The NDNQI collects quarterly data on frequency of seclusion and restraint use and on duration of seclusion episodes and restraint episodes involving a device. Those data are limited to responses to injurious assaults, but the approach is instructive. CMS should similarly collect and report quarterly data on prevalence of seclusion and restraint (e.g., episodes per 1,000 patient-days) and duration of seclusion and restraint episodes. For duration, selected percentiles (e.g., 50th, 75th, and 90th) should be reported, as well as the maximum episode duration. Simply summing hours spent in seclusion or restraint across patients, as for the HBIPS measures, can obscure unacceptably long episodes.
Furthermore, the quality of the data reported by hospitals to CMS and posted by CMS on Hospital Compare deserves more attention. Many errors could be avoided either by redefining the HBIPS “denominator” element to match the denominator used in computing the rate (i.e., patient-hours) or by redefining the rates in terms of hours per 1,000 patient-days to match the existing denominator. In addition, incentives for hospitals to report HBIPS data may need to be contingent on the reporting of accurate data.
The collection and public reporting of HBIPS data by CMS represent a meaningful step toward improving the quality and safety of psychiatric care. These data allow for analyses of interhospital variability and nationwide trends, comparisons among hospitals of different types and ownership, and identification of hospitals with unusually high rates of seclusion or restraint. As a potential resource for health care consumers, patient safety organizations, regulatory agencies, and researchers, these data deserve more attention and further development.
Conclusions
Despite making some progress, many hospitals continue to report very high rates of seclusion and restraint. Seclusion and restraint rates above the median declined substantially during the 2013–2017 study period, but marked variability in these above-the-median rates remains. It is unlikely that this variability can be fully accounted for by patient-level factors. Data reporting to CMS should be made more rigorous and be expanded to include frequency of seclusion and restraint use and duration of seclusion and restraint episodes.


