Evidence suggests that children in the child welfare system are more likely to be prescribed psychotropic medications than are children in the general population (
1–
5). The U.S. Government Accountability Office, using 2008 Medicaid claims data from five states to compare psychotropic prescribing to Medicaid-insured children, reported that children in the welfare system were 2–8 times more likely than children in the general population to be prescribed psychotropic medications (
5). The psychotropic prescription rates were 21%–39% for children in the welfare system and 5%–10% for children not in the welfare system. Although children in the welfare system may be more likely to have emotional and behavioral problems and therefore more likely to be prescribed psychotropic medications (
6–
8), concern has arisen about promoting safe, appropriate, and effective prescription of these medications in this vulnerable population (
1–
5,
9).
In 2012, these concerns led the federal agency responsible for overseeing foster care, the U.S. Department of Health and Human Services, Administration on Children, Youth and Families (ACYF), to provide information to Title IV-B agencies about the appropriate use of psychotropic medications for children in the welfare system (
9). Title IV-B of the Social Security Act includes two subparts, both of which provide funding for services to protect and promote the well-being of children who have been or are at risk for being abused or neglected. Specifically, the ACYF suggested that certain prescriptions or prescription combinations should raise a red flag and defined red-flag prescribing as too many medications prescribed at one time, medication doses that are above recommended levels, or prescribing to young children (
9).
There has since been a series of other federal efforts to promote safe, appropriate, and effective use of psychotropic medications for children in the welfare system. Examples include ACYF technical assistance efforts; making resources available on the Child Welfare Information Gateway; and an August 2012 meeting, called “Because Minds Matter: Collaborating to Strengthen Management of Psychotropic Medication Use for Children and Youth in Foster Care,” which represented a collaboration between ACYF, the Substance Abuse and Mental Health Services Administration, and the Centers for Medicare and Medicaid Services (CMS) (ACYF-CB-IM-12-03). However, recent reports and lawsuits suggest that an urgent and potentially growing need exists to develop new approaches to help Title IV-B agencies oversee and monitor the use of psychotropic medications (
10,
11).
In this study, we linked prescription-level data gathered over 16 months with administrative-level data for children in the child welfare system of a southern state in the United States to identify potentially outlying prescribing practices. We used methods adopted by the CMS to assess differences in hospital quality (
12–
16). This approach could serve as a first step to identify potentially inappropriate prescribing of psychotropic medications to children in the welfare system. The insights from this study could be used to develop programs that address this issue and achieve a suitable balance between risk and benefit associated with psychotropic medications, which is relevant for children in the welfare system, clinicians, policy makers, and researchers.
Methods
Setting
This work was initiated in 2016 as a quality improvement project by the public child welfare agency of a southern state in the United States. The project’s goal was to identify prescribers who are more likely than their peers to write prescriptions to children in the child welfare system that are red-flagged according to the aforementioned federal guidance. This information could be used to engage prescribers in conversations about prescribing practices and gaps in the broader mental health services in the child welfare system. This project was reviewed and approved by the state child welfare agency’s research review committee, the Vanderbilt University Institutional Review Board, and the University of Chicago Institutional Review Board.
Data
Our analysis combined data from three sources: prescription-level data on psychotropic medications categorized as antidepressants, antipsychotics, stimulants, or mood stabilizers; child placement–level administrative data; and the 2011–2015 5-Year American Community Survey for census tract–level poverty. Each child’s removal address was geocoded with Google Maps and linked to the census tract to obtain the percentage of persons in that tract living below the federal poverty level. Prescriptions issued to children in the child welfare system of a southern state in the United States between May 22, 2016, and September 17, 2017, were included in our analysis. Prescribers with <10 prescriptions were excluded to obtain stable model estimates (see online supplement to this article).
Outcomes
Following ACYF guidelines (
9), each prescription was classified as a potentially inappropriate prescription, hereafter referred to as a red-flagged prescription, if it was issued to a child age ≤5 years, was one of four or more concurrent psychotropic prescriptions issued to a child, was one of two or more concurrent prescriptions in a given class (e.g., two or more antidepressants, antipsychotics, stimulants, or stabilizers), or exceeded maximum recommended dosage. Age 5 years was selected as the cutoff on the basis of the state child welfare system’s recommendation. The maximum dosage was obtained from U.S. Food and Drug Administration (FDA) guidelines and if it was not specified for children, it was obtained from the FDA-recommended maximum dosage for adults. Overlapping medications of the same class that lasted for <60 days were not flagged to prevent penalizing instances in which medications were being switched. Refill prescriptions were treated as unique prescriptions because of heterogeneous refilling practices among prescribers and to capture the total medication burden. Data were analyzed at a prescription level with a binary outcome indicating whether a prescription was red-flagged because it met any of the above criteria.
Covariates
Covariates were selected a priori on the basis of factors shown in the literature to influence increased psychotropic medication use among children in the welfare system and when cited by the ACYF in their guidance (
4,
9). Covariates included child’s age at prescription, gender, race, administrative region in which the case originated (12 regions across the state), days in custody until each prescription, child census tract–level poverty, number of previous prescribers seen by the child at the time of each prescription, prescriber specialty, placement type, and behavioral health need. Placement type was categorized into four levels, with higher levels indicating more intensive services. Within level, each placement type was also defined as a foster home, group home, residential treatment center, youth development center, or an inpatient facility. An additional “other” category was included for placements not falling into these categories.
Child welfare professionals assessed behavioral health need using the Child and Adolescent Needs and Strengths (CANS) complexity score (
17,
18), which ranges from 0 to 30, with higher values indicating a greater level of need. Prescriptions were matched to the placement type and CANS assessment at the time the prescription was filled. At the prescriber level, we included prescriber specialty identified through the National Provider Identifier Registry of the CMS National Plan and Provider Enumeration System. Specialties were grouped into the following categories: medical doctor (M.D., child psychiatry), M.D. (adult psychiatry), M.D. (pediatric other), M.D. (other), nonprescribing provider, nurse practitioner (psychiatry), and other advanced practice. Although multiple neighborhood-level socioeconomic risk factors are available from the American Community Survey, poverty was included because it is considered to be most sensitive to expected socioeconomic gradients in health, yielding the most consistent results and maximal geocoding linkage evident for tract-level analyses (
19).
Statistical Analysis
Data were analyzed at a prescription level with a binary outcome indicating whether a prescription was red-flagged. To account for the wide heterogeneity in children’s case complexities, we adopted methods the CMS has used to assess hospital quality (
12). We first fit a hierarchical logistic regression model adjusted for covariates influencing the case complexity of the child to estimate the probability of a prescription being red-flagged. The estimated red-flag probabilities of all prescriptions associated with a prescriber were then summed to obtain the adjusted rate of red-flagged prescriptions, or standardized prescribing rate (SPR), for each prescriber. The SPR describes the ratio of the predicted number of red flags for a prescriber, divided by the expected number of red flags across the population, considering the prescriber’s case mix. For example, an SPR of 2 suggests that the prescriber issued twice as many red-flag prescriptions as would have been expected from the average prescriber from the population had they treated children with the same measured characteristics. (For further information on the development of the SPR metric, see the Yale New Haven Health System–Center for Outcomes Research and Evaluation [
12] and the
online supplement.)
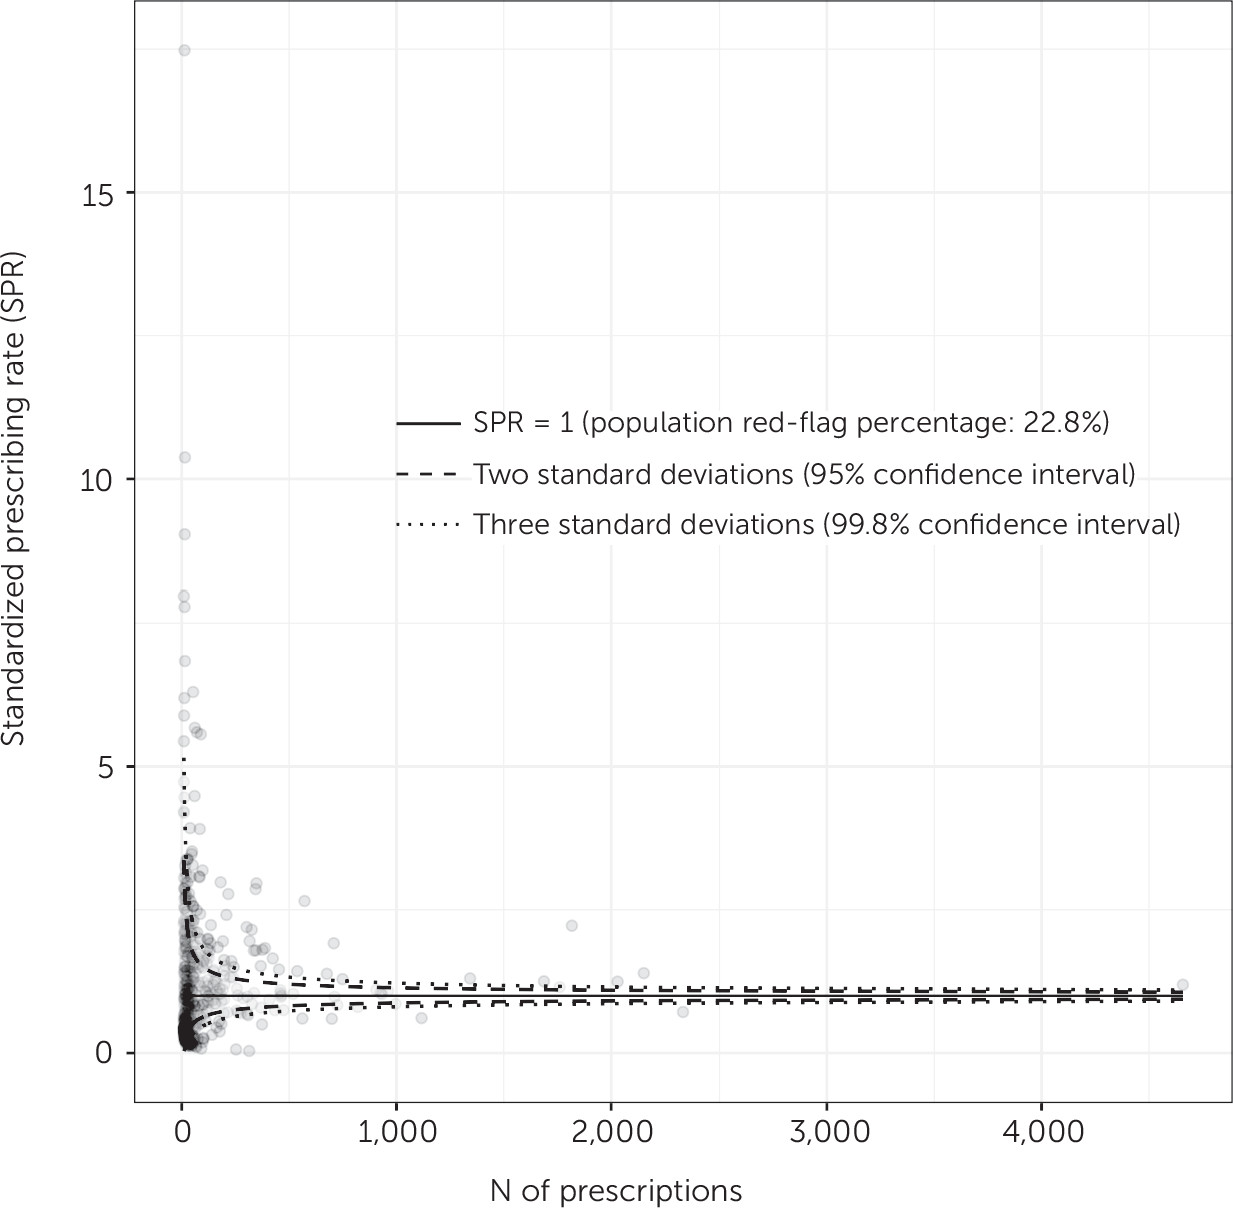
To visualize variability in prescribing practices by using the SPR among prescribers, we used a funnel plot (
20). The x-axis of this plot is a measure of the precision of the estimate, typically a measure of the burden on prescribers such as the number of prescriptions per prescriber, and the y-axis represents the SPR value. Funnel-shaped lines denoting control limits around a horizontal line representing an SPR of 1 (the average prescription rate of the entire sample of prescribers) divide the population into prescribers falling within and outside the control limits to identify outlying prescribers. Typically, the control limits are defined as 95.0% and 99.8%, corresponding to approximately two and three standard deviations around the mean for all prescribers, respectively. If the vast majority of data points representing individual prescribers reside within the lines corresponding to the control limits, the model describes the reasons for variability within the data well, and the contribution of additional unmeasured sources of variability will be minimal (
20). Conversely, a large proportion of data points falling outside the control limits suggests that significant sources of variability have not been accounted for and should be explored further. In-depth guidelines for creating funnel plots for similar analyses can be obtained from Verburg et al. (
21).
Results
From May 2016 to September 2017, 506 prescribers issued 64,923 prescriptions to 4,093 unique children with a median (interquartile range) age of 14 (10–16) years in the child welfare system of a southern U.S. state.
Table 1 provides summary demographic, clinical, and placement information for the children included in our data set, stratified by whether they had received a red-flagged prescription.
Of the 64,923 prescriptions, 14,806 (22.8%) were classified as red-flagged prescriptions for any of the conditions specified in the ACYF guidelines. By red-flagged category, 1,059 (1.6%) of the 64,923 prescriptions were flagged for prescription to children ≤5 years old, 5,130 (7.9%) for four or more overlapping medications, 5,802 (8.9%) for overlapping antidepressants, 1,804 (2.8%) for overlapping antipsychotics, 1,092 (1.7%) for overlapping stimulants, 747 (1.2%) for overlapping stabilizers, and 1,687 (2.6%) for exceeding the maximum recommended dose.
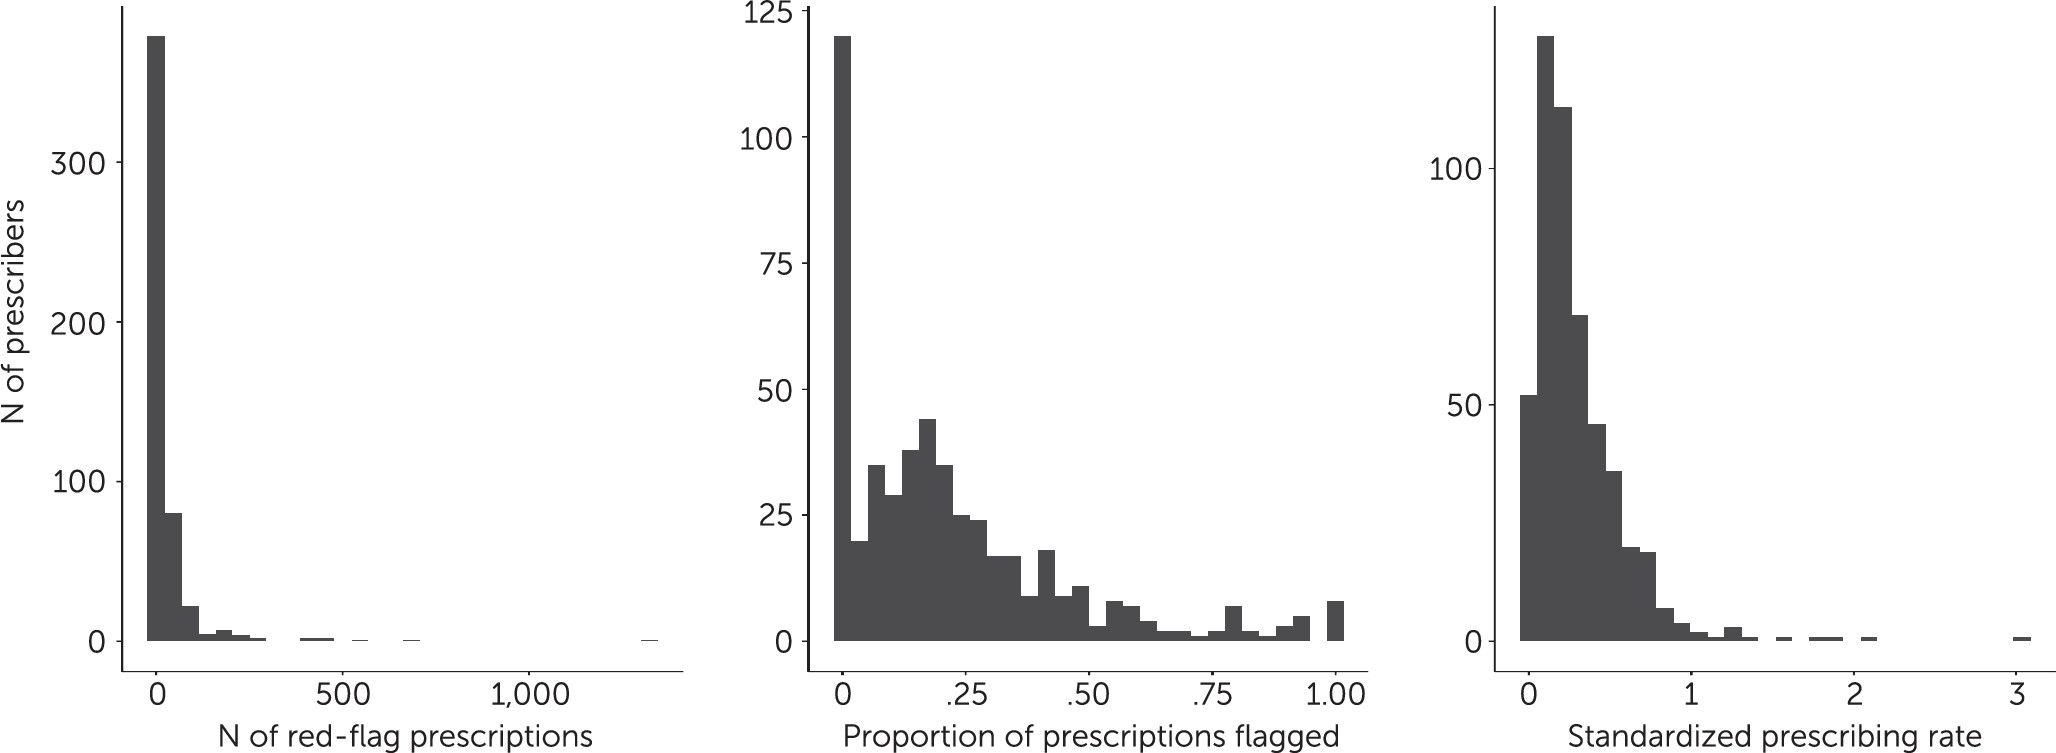
Figure 1 shows the number of red-flagged prescriptions by prescribers, unadjusted red-flag rates among prescribers (defined as the proportion of each prescriber’s prescriptions that received red flags), and adjusted red-flag rate (i.e., the SPR) among prescribers with ≥10 prescriptions. Most prescribers issued at least one red-flagged prescription (N=389; 76.9%), and 1,263 of 4,093 (31%) children received at least one red-flagged prescription. Among these children, the distribution of red-flagged prescriptions was positively skewed, with a median (interquartile range) of 6 (3–14) red-flagged prescriptions, such that relatively fewer children received higher numbers of red-flagged prescriptions than received lower numbers of these prescriptions.
To identify the proportion of prescribers who prescribed red-flag prescriptions at increased rates, we a priori defined the percentage of prescriptions that received red flags in our sample (i.e., 22.8%) as the benchmark. In this way, we could compare red-flag prescription rates within the same population of peers rather than comparing the rates with those from an external population. Of the 506 prescribers, 47 (9%) were between two and three standard deviations above the benchmark, and 72 prescribers (14%) were more than three standard deviations above it.
Figure 2 shows the SPR for all prescribers as a function of the number of prescriptions that each prescriber issued.
A moderate degree of clustering existed within prescribers, with an intracluster correlation coefficient of 40.3%, indicating that 40.3% of the total variation in red-flagged prescription rates was accounted for by prescribing patterns of individual prescribers beyond the child-level characteristics in our model. Our model had reasonable discrimination with a concordance statistic (C-statistic) of 0.73, calculated via 10-fold cross-validation. The relatively high C-statistic of the base model suggested that unobserved factors influencing case complexities had a large impact on the model fit relative to the covariates in the model and that the observed differences in prescribing of red-flagged prescriptions among the health providers in our sample strongly influenced our model’s predictions. Consequently, we would anticipate a diminished predictive capacity of the model for predicting red-flag prescriptions of providers who were not included in our data set.
Discussion
Administrative and clinical data have been used to calculate risk-standardized rates of prescribing to patients vulnerable to adverse drug events (
22), risk-standardized rates of prescribing to older adults (
23), risk-adjusting intensive care unit performance (
24), and risk-adjusting hospital mortality rates (
25). To our knowledge, this study represents the first application of these data to evaluate psychotropic medication prescriptions in the welfare system. Although a large proportion (69%) of children within our data set never received a red-flagged prescription, those who received at least one red-flagged prescription were prone to also receive multiple red-flagged prescriptions.
Many children who received high numbers of red-flagged prescriptions did not receive a high number of different medications. Instead, a recurring pattern was that after a child had been placed on a set of medications that triggered a red flag, this set of medications was refilled multiple times, resulting in additional red-flagged prescriptions. In many instances, the recurrence of the prescription set may have been due to the identification of a regimen that was beneficial for the child. However, it is also possible that this regimen did not benefit the child. Active monitoring of red-flagged prescriptions and critical reevaluation of the continued appropriateness of these prescriptions may help ensure that children are not placed on nonessential medications any longer than necessary.
A limitation of our analysis was the potential for unmeasured confounding. Like all studies involving secondary analysis of existing administrative data, our study included only those covariates that were captured in the administrative database, such as child demographic characteristics, welfare history, needs and strengths, prescriber and prescription information, and the child’s neighborhood. Our model accounted both for a significant proportion of the outcome variance in our sample and a proportion of the outcome variance comparable to that seen in similar models using similar methods. Nevertheless, the potential for unmeasured confounding still existed. Two important but unavailable variables were the child’s diagnosis and the medication indication. These variables would likely have been valuable for predicting the red-flag status of a prescription because several of the psychotropic medications in this study often are prescribed to children off label or for management of nonpsychiatric indications. For example, the antidepressant trazodone is commonly prescribed as a sleep aid, and many anticonvulsants typically used in the treatment of patients with epilepsy may be prescribed as mood stabilizers.
The availability of additional clinical information may have allowed for more sophisticated examination of related issues. Furthermore, although our analysis accounted for prescriber specialty, many more prescriber-level variables exist that may influence the distribution of red-flag prescriptions. Among these variables are the type of institution that the prescriber is associated with and the proportion of their cases belonging to the child welfare population.
Our analysis benefited from inclusion of covariates from multiple sources and neighborhood-level socioeconomic information that may determine broad trends in red-flag prescribing rates across the state containing the study population. The ACYF noted in 2012 that previous studies had identified five key variables that influence prevalence of psychotropic medication use among children in foster care: age, gender, behavioral concerns, placement type, and geographic location (
9), all of which were accounted for in our analysis. The presence of substantial variation in prescribing practices beyond these variables was not surprising given the variability in children’s circumstances and needs; however, this variation indicates that a more granular examination is needed to better understand prescribing patterns for children in the welfare system.
Use of red-flagged prescriptions as our outcome was both a strength and weakness of our study. At the clinical level, there is an incongruence between the designation of prescriptions as red flags and the determination that some prescriptions are inappropriate for a child given their needs. Red-flagged prescriptions that are inappropriate for one child may be clinically appropriate and necessary for another, and ultimately, clinical expertise is required to differentiate between the two. We could control for this potential difference to some extent by using available data, such as child age and placement. Variables that might enter into a prescriber’s consideration, such as the child’s diagnosis, dosing history, and presence of adverse events, were unavailable, however. Consequently, our analysis does not allow one to draw conclusions about children’s well-being on the basis of the observed variables in our data.
Data regarding the presence of nonpharmacological interventions, such as counseling or psychotherapy, were also unavailable. Except in urgent situations, the policy of the child welfare agency recommends nonpharmacological interventions begin before or concurrently with prescription of a psychotropic medication. An assessment of provider adherence to this policy would have provided a more complete picture of prescribing patterns and would have been predictive of red-flag prescriptions if prescribers exhibited preferences for pharmacological versus nonpharmacological treatments. Given these limitations, we do not recommend that policy action be taken on the basis of the model results without additional clinical review, which is essential for validating the outlier status of red-flagged prescriptions by any provider.
Conclusions
The use of red-flagged prescriptions as a quality-control measure confers several benefits. Although much remains unknown about the long-term and concomitant use of psychotropic medications, the red-flag criteria reflect current clinical consensus about which prescriptions are likely safe for young children and which merit further monitoring. The red-flag criteria are easily understandable, can be communicated to prescribers, and enable prescribers to set tangible benchmarks for improvement within their practices. An ideal quality-control initiative monitoring red-flagged prescriptions would aim to reduce potentially inappropriate prescribing of psychotropic medications without increasing the risk of a child for not being able to receive required medications. The aforementioned recent federal attention and lawsuits suggest that methods such as these could aid health care systems in their efforts to engage their provider networks in quality-control efforts and become one important part of larger efforts to curtail inappropriate prescribing to the vulnerable population of children in the welfare system.


