Reasons for not having insurance
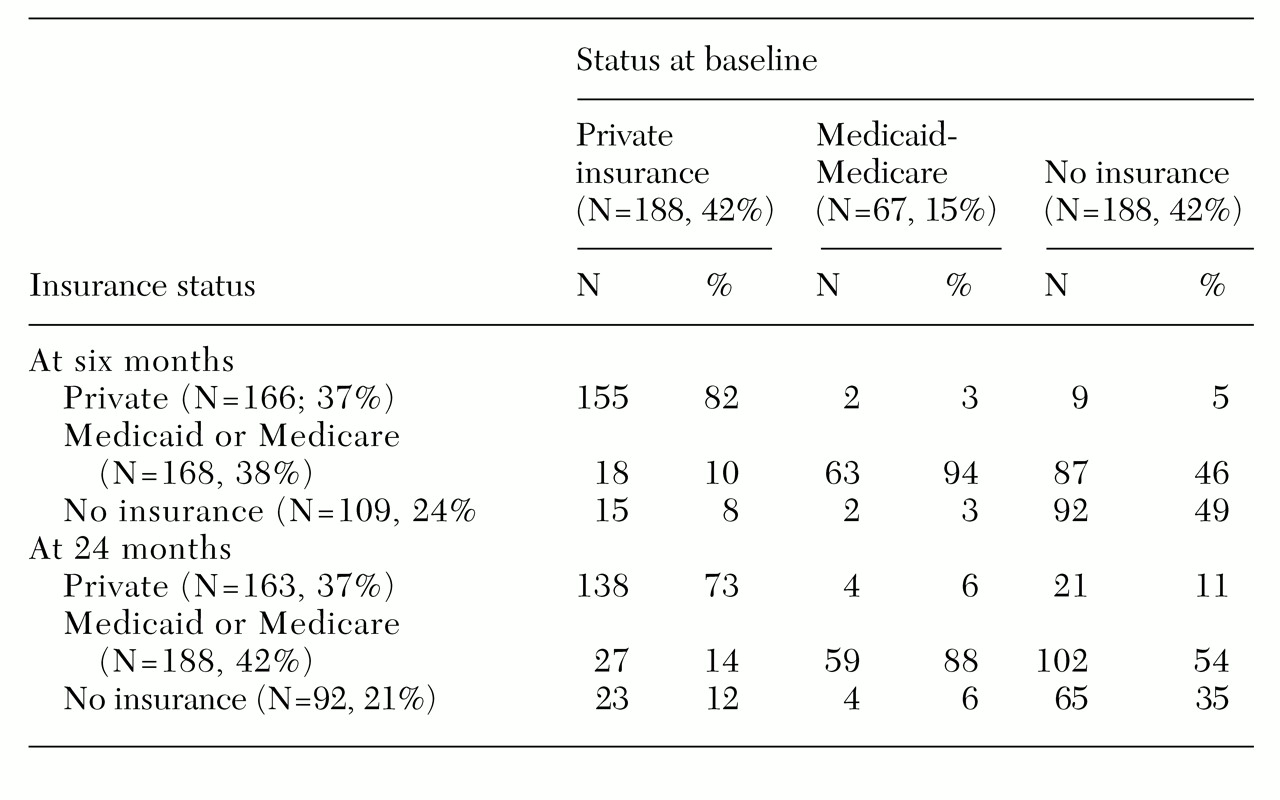
Ninety-two persons did not have insurance at the 24-month interview. The reasons they gave could be grouped into four categories. Fifty-three persons (58 percent) held jobs that did not provide insurance. Fourteen (15 percent) were ineligible for Medicaid or Medicare because of technicalities; for example, the amount of financial aid some persons received exceeded the Medicaid limits. Eleven (12 percent) apparently were too ill to apply for Medicaid or Medicare; for example, one paranoid respondent made frequent moves, and another paranoid respondent had delusions about the government that precluded her from applying for Medicaid. A third respondent with severe phobia could not cope with contacting the Department of Social Services. The other 14 respondents had miscellaneous reasons: nine were without insurance apparently by choice, and two said they were about to start work and would be getting insurance through work. For three respondents no reason could be determined.
Males were more likely than females to have no insurance (odds ratio=1.5, 95% confidence interval=1.01 to 2.5). No discernible differences were found in age, gender, marital status, or diagnosis in reasons for having no insurance.
Extent of care
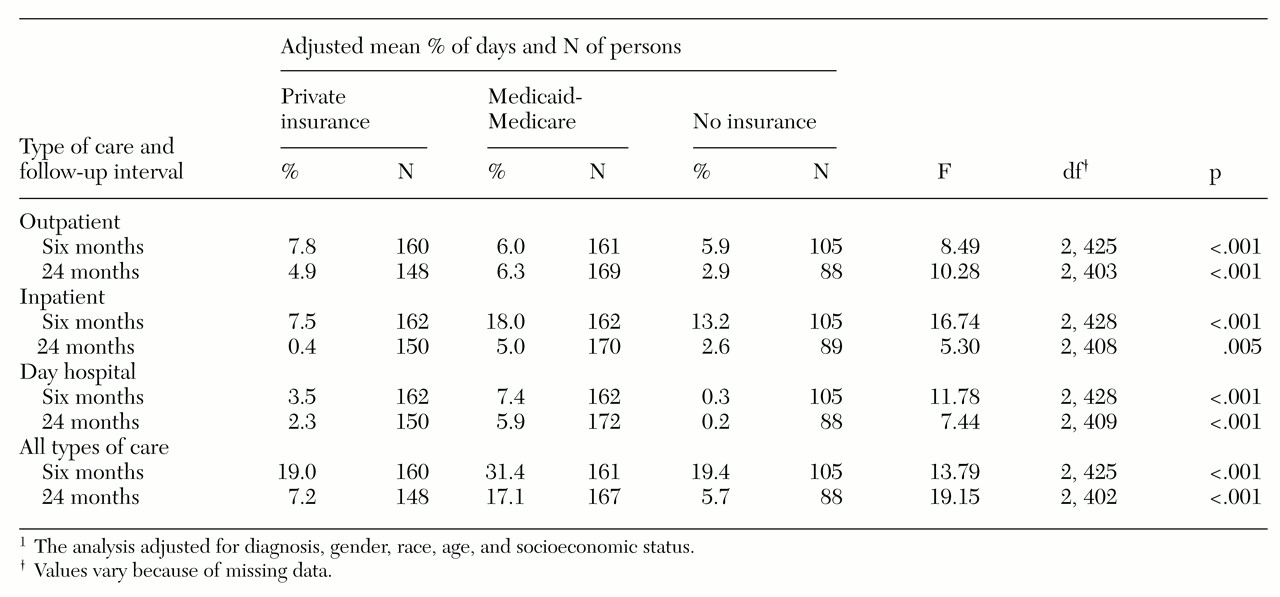
Information on the extent and type of care received under different insurance arrangements is presented in
Table 2. During the first six-month interval, the Medicaid-Medicare group had the largest proportion of persons receiving any type of care, and persons in this group received the most days of care. These differences were statistically significant. On average, persons in the Medicaid-Medicare group had some kind of care—inpatient, outpatient, or day hospital—during almost a third (31 percent) of the days during the first six months. The number of days of care for this group is about 12 percent higher than for the group with private insurance and the group with no insurance; persons with private insurance and with no insurance received care on about 19 percent of the days in the first six-month period.
For the six months preceding the 24-month follow-up, all groups experienced a substantial reduction in care. The Medicaid-Medicare group received the most care, and the group with no insurance experienced the greatest decline in care.
At six months the private insurance group had more outpatient care (7.8 percent of the days) than the Medicaid-Medicare group (6 percent) and the group with no insurance (5.9 percent). At 24 months the Medicaid-Medicare group had slightly more outpatient care than the other groups.
At six months outpatient care accounted for 41 percent of care for the private insurance group, compared with 33 percent for the Medicaid-Medicare group and 30 percent for the group with no insurance. At 24 months the proportion of outpatient care for the private insurance group increased to 67 percent. The proportion for the Medicaid-Medicare group remained about the same at 37 percent. The proportion increased for the group with no insurance from 30 percent to 51 percent.
As
Table 2 shows, the private insurance group had the smallest proportion of inpatient days of care, followed by the group with no insurance. The Medicaid-Medicare group received the most day hospital care and the no insurance group the least.
For the Medicaid-Medicare group, we found a negative correlation between outpatient and inpatient care (six months: r=-.35, p<.001, N=161; 24 months: r=-.21, p=.008, N=167) and between outpatient care and day hospital care (six months: r=-.38, p<.001, N=161; 24 months: r=-.23, p=.003, N=169). A similar trend was noted for the other two insurance groups. No significant correlations were found between day hospital and inpatient care.
When inpatient care and day hospital care were used together in a multiple regression equation predicting outpatient care, we found that after age, diagnosis, and gender were controlled for, inpatient care and day hospital care explained 26 percent of the variance in outpatient care at six months (R2=.26; day hospital: b=-.37, t=5.43, df=159, p<.001; inpatient: b= -.36; t=5.27, df=159, p<.001; N=161). These two variables also explained about 10 percent of the variance in outpatient care at 24 months (R2=.09; day hospital: b=-.23, t=3.08, df=167, p=.002; inpatient, b=-.21; t=2.70, df= 167, p=.007; N=169). These results suggest that outpatient care may reduce the need for inpatient care.
At six months more than 92 percent of each group had obtained at least some outpatient care. However, by 24 months the proportion of respondents with no insurance who received outpatient care decreased 35 percent—from 92 percent to 57 percent. The proportion of those with private insurance receiving outpatient care fell 27.7 percent—from 98 percent to 70 percent. However, the proportion of respondents in the Medicaid-Medicare group who received outpatient care at 24 months remained similar to the proportion at six months—84 percent and 93 percent, respectively.
The odds of getting outpatient care at either six months or 24 months were significantly higher for those with private insurance than for those with no insurance (OR=1.8, CI=1.1 to 3.1; N=109). The odds were also higher for those in the Medicaid-Medicare group than for those with no insurance (OR=4.1, CI=2.3 to 7.4; N=152).
Longitudinal perspective
We conducted a longitudinal analysis of changes in the percentage of days with care to complement the cross-sectional analysis in
Table 2. Persons who had the same insurance coverage at six and 24 months were compared with those whose insurance arrangement changed. Five major paths from six months to 24 months were found. In two of them the insurance arrangement changed: 35 persons with no insurance changed to Medicaid-Medicare, and 17 persons with private insurance at six months had no insurance at 24 months. In three of the paths, there was no change in status. At both six and 24 months, 140 persons had private insurance, 144 persons had Medicaid-Medicare, and 62 persons had no insurance. We examined the effect of gaining and losing coverage compared with maintaining the same coverage. For this analysis a difference score was calculated for each respondent for each type of care for six- and 24-month intervals.
An analysis of covariance controlling for levels of care at six months, age, gender, diagnosis, and socioeconomic status revealed no significant differences among the five groups described above in total days of care at 24 months. For all groups, the number of outpatient days of care decreased by about 11 percent between six and 24 months. The adjusted mean differences for outpatient care showed a trend toward significance (p=.09). For persons who remained on Medicaid-Medicare, the percentage of days per month of outpatient care changed very little, by .02 percent. For the other groups, the percentage declined. For those who changed from no insurance to Medicaid-Medicare, the decrease was 1.4 percent. For those who kept private insurance, it was 2.4 percent. For those who were not insured at both time points, the decrease was 4.2 percent, and for those who changed from private insurance to no insurance, it was 5.2 percent.
For the five groups, the adjusted mean differences for inpatient care were significant (F=2.50, df=4, 355, p=.04). The persons who shifted from no insurance to Medicaid-Medicare had the smallest decrease in inpatient care, 10.3 percent. For those covered by Medicaid-Medicare at both time points, inpatient care fell 15 percent. For those with private insurance at six months and no insurance at 24 months, the decrease was 18 percent. The decrease was 22 percent for those not insured at both follow-ups. And for those who maintained their private insurance over the 24 months, inpatient care fell 22 percent. No significant difference in day hospital care was found for the five groups.


