Validity of ICCD certification
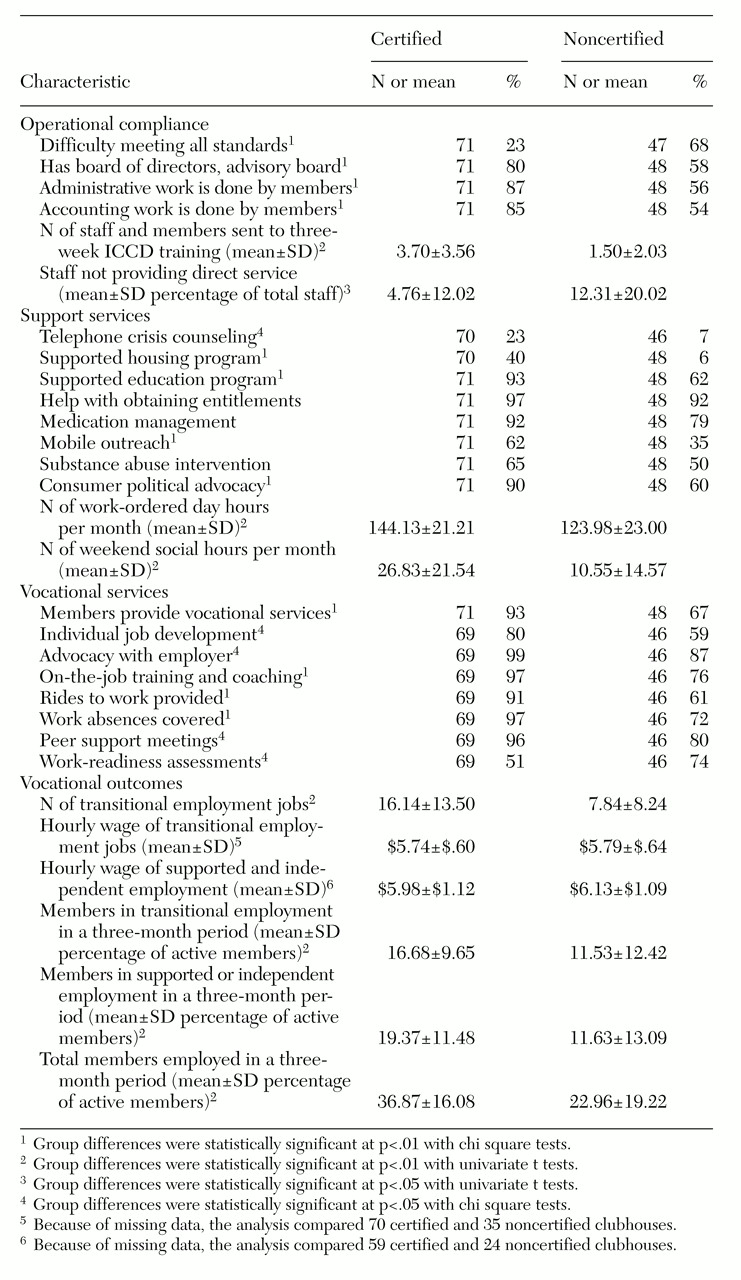
Certified versus noncertified clubhouse performance. As Tables 1 and 2 show, certified and noncertified clubhouses were comparable in organizational resource characteristics, but they differed substantially in performance. Certified clubhouses performed significantly better (p<.05) than noncertified clubhouses on 25 of the 30 performance indicators in
Table 1. All group differences indicated greater compliance with the
Standards for Clubhouse Programs by certified clubhouses. For instance, a larger proportion of certified clubhouses provided job development and on-the-job support, but a larger proportion of noncertified clubhouses provided work-readiness assessments. ICCD clubhouses are mandated to provide comprehensive supported employment services, but the
Standards oppose the use of work-readiness assessments. Certified clubhouses substantially outperformed noncertified clubhouses in terms of employment. Nearly twice as many members of certified clubhouses worked transitional and supported or independent employment jobs.
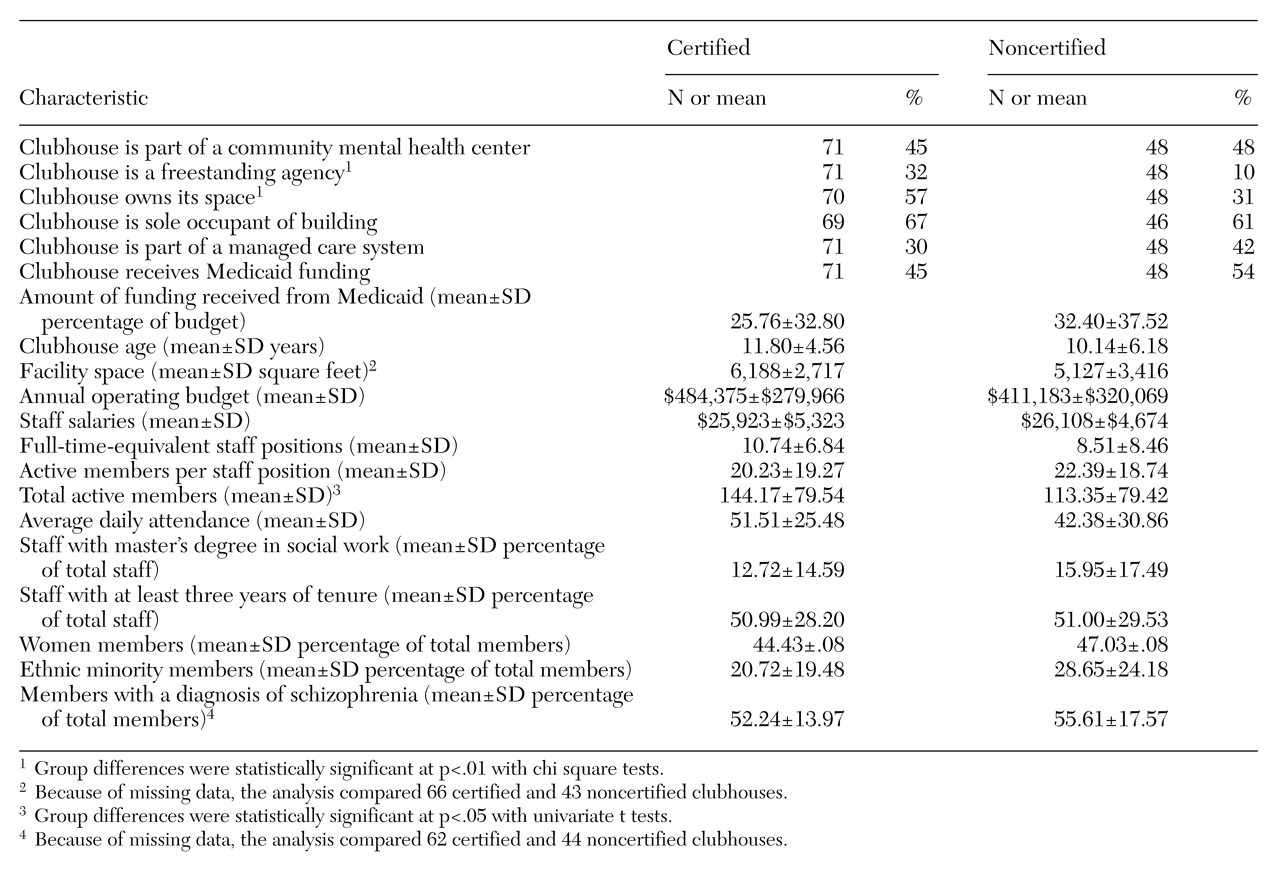
Even though the certified clubhouses showed superior performance, no group differences were found in organizational resource variables that could have influenced performance. Certified and noncertified clubhouses differed significantly on only three of the 20 resource variables presented in
Table 2. Although certified and noncertified clubhouses had comparable budgets and staff-to-member ratios, certified clubhouses served more members during a typical three-month period. Also, a greater proportion of certified clubhouses were freestanding, and thus were more likely than noncertified clubhouses to own their facility.
Predictors of certification status. A logistic regression analysis examined whether organizational performance predicted ICCD certification status when variations in program resources were taken into account. To reduce collinearity, representative measures were selected from within sets of highly correlated variables in the 1998 survey. Six organizational resource variables were entered simultaneously into the analysis as a first block of control covariates: clubhouse age, annual budget, mean staff salary, staff-to-member ratio, whether or not funding was received from Medicaid, and whether or not the program was part of a mental health center.
This block of resource variables was followed by a second block of six performance variables highly representative of the criteria used for determining clubhouse certification. Two variables measuring hours of operation—work-ordered day and number of hours of social programming—were taken directly from survey reports. The percentage of members employed in a three-month period was calculated as a ratio of total members employed to total active members. Three other variables, staff work done by members, array of community supports, and array of vocational supports, were composite variables created by summing dichotomous (checklist) items.
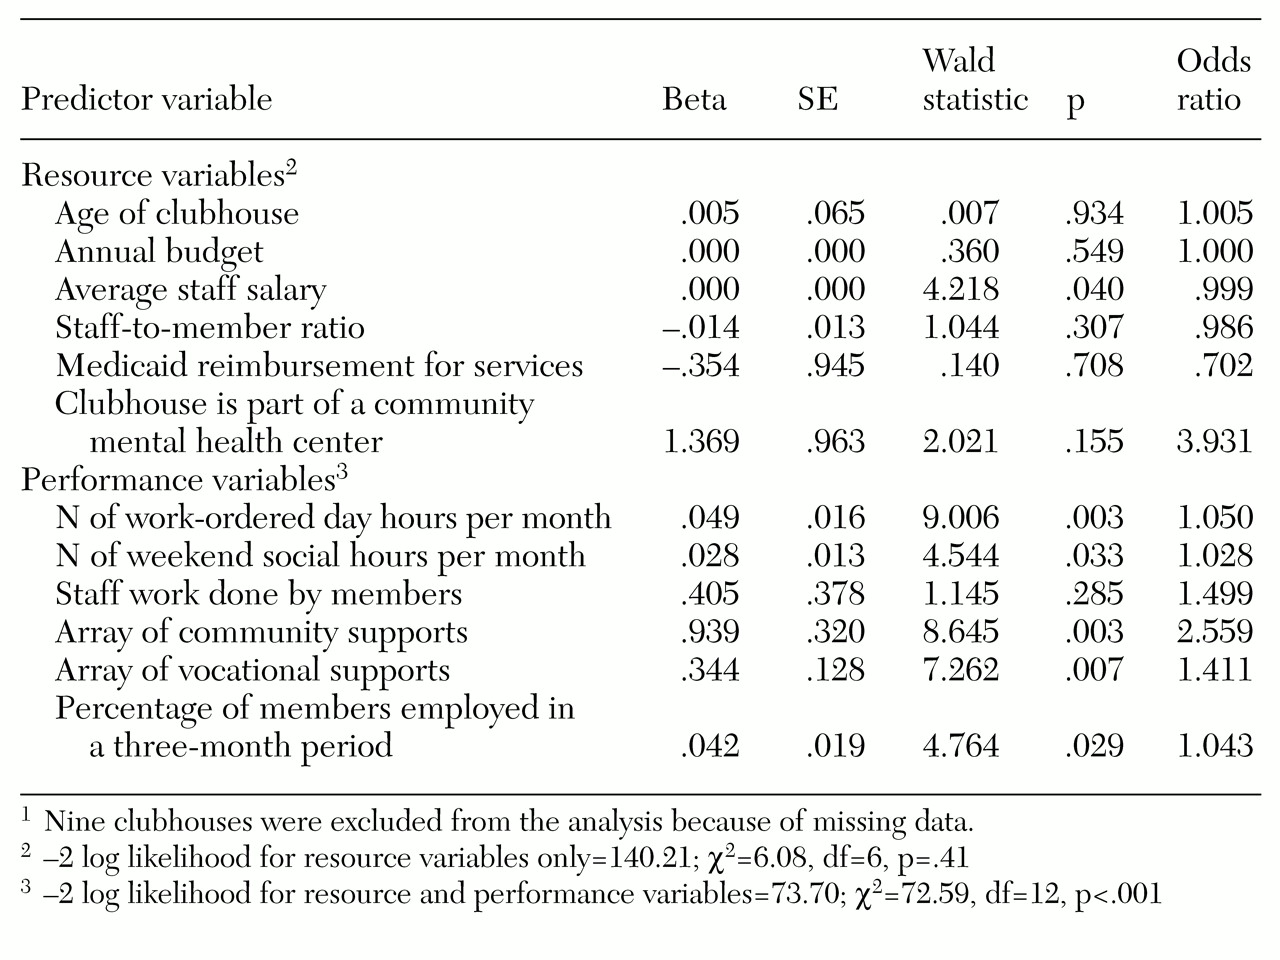
The results of the logistic regression analysis are presented in
Table 3. The six resource variables included as the first block were not as a group predictive of certification status. The group of six performance variables significantly predicted certification status when the analysis controlled for the organizational resource variables. Five of the six performance measures were significant predictors of certification status.
When the analysis controlled for basic resources, a clubhouse was more likely to be certified if it provided a wider array of services and helped more members obtain employment. The full logistic regression model containing both resource and performance variables was statistically significant and correctly predicted the certification status of 85 percent of the clubhouses in the sample.
The 12 variables correctly classified all but seven certified and ten noncertified clubhouses out of a total of 110 programs in the analysis. These results support the validity of using ICCD certification as a quality assessment tool and of basing benchmark figures on the superior performance of U.S. certified clubhouses.
Benchmark performance rates
Calculation of the benchmark performance rates. Benchmark performance rates were derived from the responses of U.S. certified clubhouses to the 1998 ICCD clubhouse survey. The mean was selected as the basic benchmark figure for most tables because ICCD clubhouses reported greater familiarity with this statistic. However, mean scores were close in value to midpoint (median) scores for nearly every survey variable. That is, the ICCD benchmark figures represent levels of performance that have been attained by approximately half of all certified clubhouses in the United States.
Benchmark performance rates were calculated as actual counts rather than percentages or ratios to ensure that the figures would hold real-world meaning for all stakeholders. However, ratios and percentages can be easily calculated. For instance, to compute the mean percentage of active members employed, the number of members employed can be divided by the total number of active members. Tables with percentages and ratios as well as tables with standard deviations and median statistics are available from the ICCD.
Construction of the ICCD benchmark performance tables. Because the demands and constraints imposed by governments as well as by local economic and environmental factors influence a clubhouse's ability to perform well, benchmark rates were calculated separately for clubhouses in different locations, of different ages, and with different levels of funding. Location was defined as rural, urban, or metropolitan according to the urban influence codes provided by the economic research service of the U.S. Department of Agriculture (
14). Clubhouse age was dichotomized as less or more than ten years of operation. Funding was defined as total operating budget for the 1998 fiscal year, minus costs for substantial auxiliary programs such as supported housing or mobile outreach teams. Annual budgets were grouped as $300,000 or less, $300,001 to $400,000, $400,001 to $600,000, and more than $600,000.
Statistical tests revealed no significant differences in benchmark figures between clubhouses with different ages, locations, and budget categories when performance was expressed as a ratio or percentage. When benchmarks were expressed as actual counts, statistically significant differences were found only across budget categories. As would be expected, clubhouses with larger budgets had higher performance. For instance, clubhouses with larger budgets had more members and more members employed.
A strong relationship between budget and location was also noted, primarily because of a high proportion of rural clubhouses with budgets under $300,000 (χ2=22.37, df=6, p= .001; N=71). In general, clubhouses with larger budgets tended to be in urban or metropolitan locations rather than rural locations. Urban programs tended to have more staff, to provide a wider array of services, and to serve more clients. For this reason, rural clubhouses had fewer employed members, even though the percentage of members employed was equivalent across locations.
A positive correlation was also found between annual operating budget and clubhouse age, with older clubhouses having larger budgets. However, this correlation was statistically significant only for clubhouses that had been in operation for less than ten years (r=.44, p<.05; N=26).
All ICCD clubhouses are provided with benchmark tables cross-indexed by location, annual budget, and organizational age to allow a comparison of their own performance with that of certified clubhouses of similar age in similar locations with similar levels of funding. Likewise, state-specific benchmark tables are available for states that have ten or more certified clubhouse programs. Researchers and policymakers are advised to use national tables based on only budget categories, age categories, or location categories so that average figures and calculated ratios are derived from larger samples.
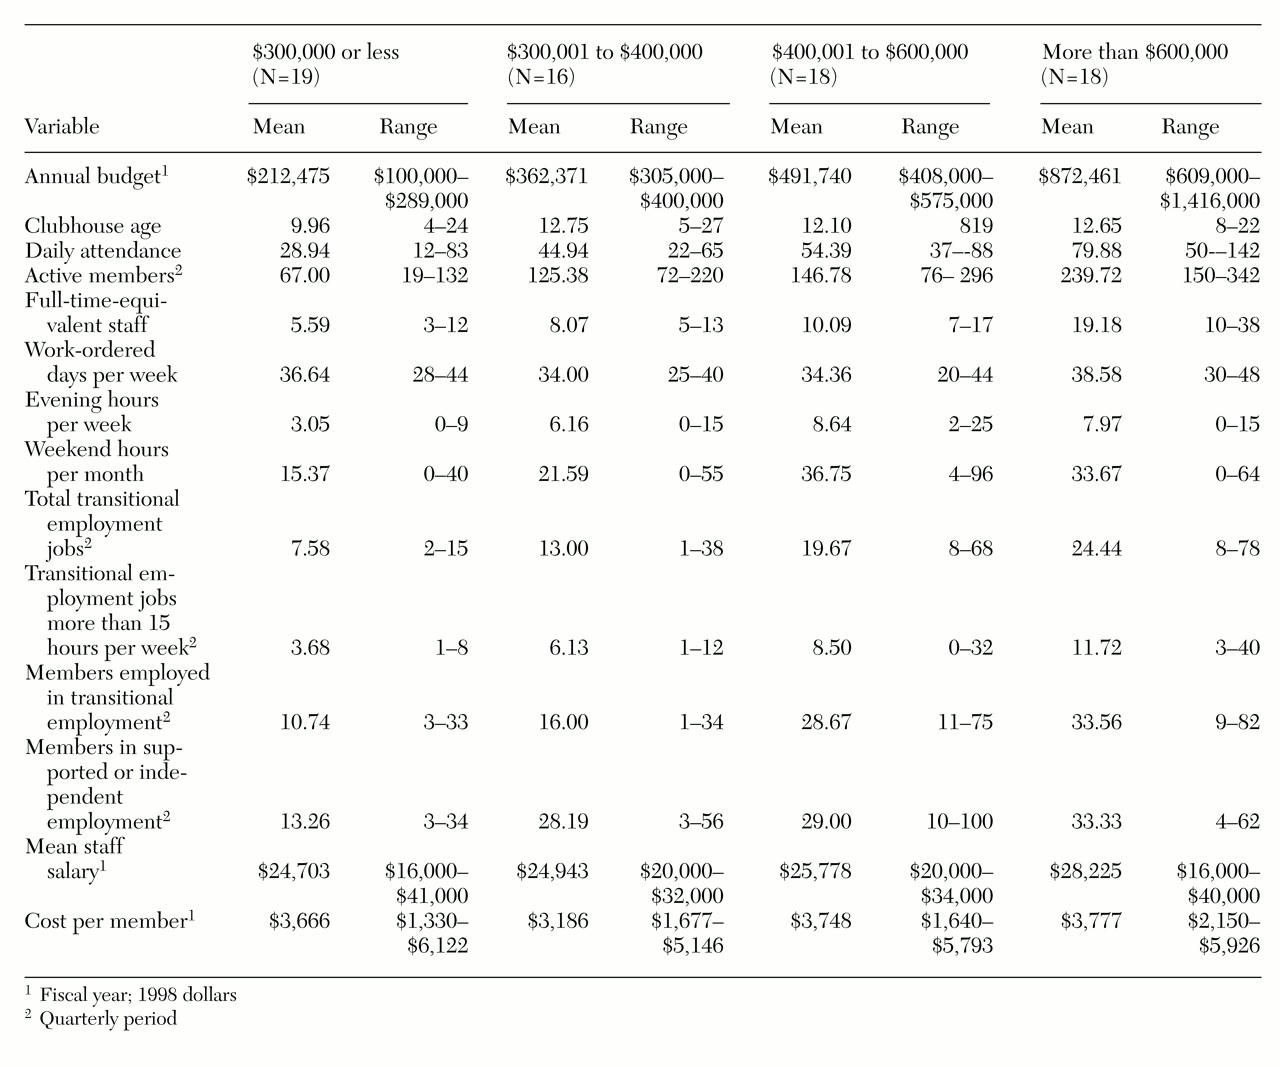
Table 4 presents the benchmark rates for ICCD-certified U.S. clubhouses in specific budget categories.
Regardless of which table is used, one can judge the appropriateness of a specific benchmark figure by examining minimum and maximum scores. If the range of scores is small, a clubhouse is strongly expected to meet or exceed the average score. If a range is large, more latitude can be taken in setting performance expectations.


