Prediction of Social-Functioning Outcomes
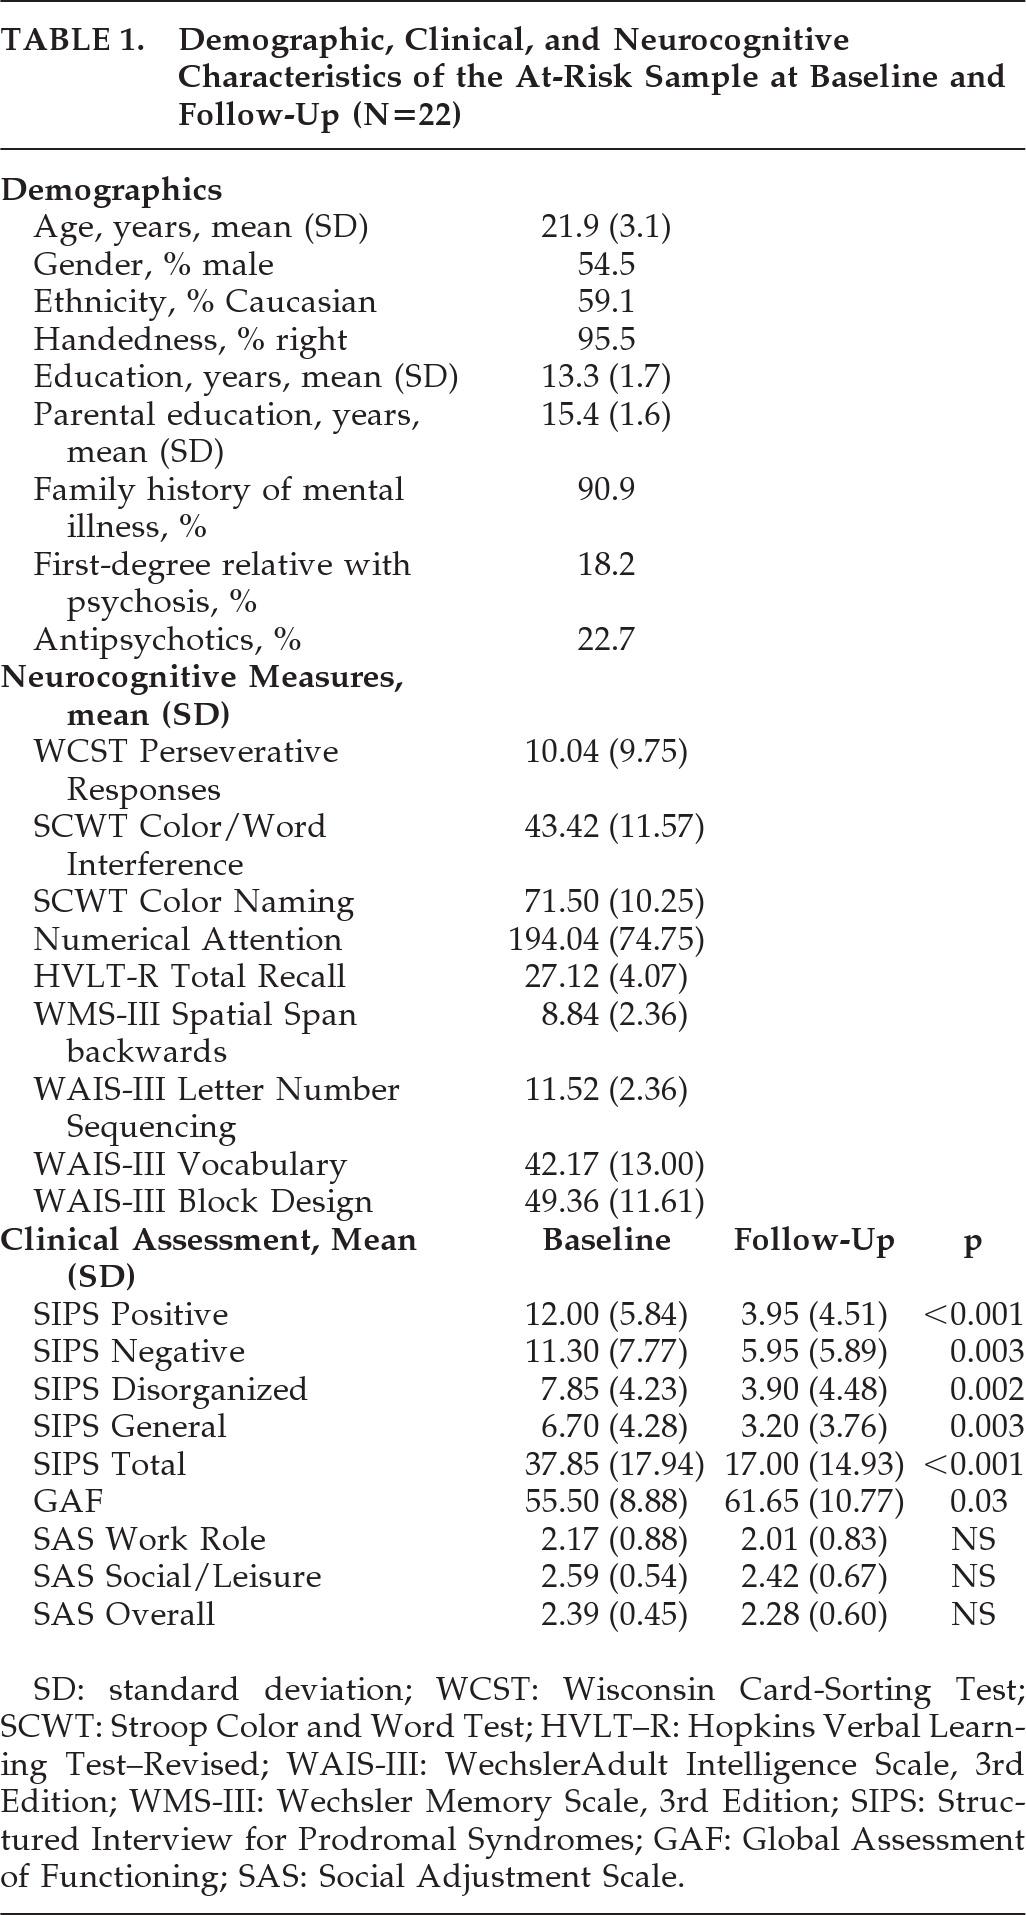
Given our relatively small sample size, we limited the number of predictor variables that were used in the regression analyses to those that had significant correlations (p<0.05) with the social functioning variables at follow-up (r=0.45 to 0.67). Yet, for each dependent variable, the corresponding baseline variable was entered into the prediction model regardless of the magnitude of the correlation between them. Interestingly, the outcome social-functioning measures were not significantly correlated with baseline GAF, SIPS positive symptoms, or performance on the WCST. In order to avoid multicollinearity problems, we examined the correlations among the predictor variables. Those correlations were all small-to-moderate (r=0.43 to 0.59; p<0.05) except for the high association between SIPS Disorganized and SIPS Negative (r=0.71; p<0.001).
We decided to include both of those variables in the regression analyses because they represent different symptom domains. We performed three backward multiple-regression analyses, one for each SAS outcome variable.
When the four variables that were significantly correlated with follow-up, Overall SAS, in addition to baseline Overall SAS scores, were included in the first backward multiple regression; we observed a significant regression coefficient that accounted for 70% of the variance in overall functioning at outcome: F[5, 15]=7.18; p=0.001; R2=0.70 (at Step 1). After Stroop Color Naming and SIPS Negative were excluded from the model, baseline Overall SAS, SIPS Disorganized, and Stroop Color/Word Interference still accounted for 70% of the variance in follow-up Overall SAS: F[3, 17]=13.29; p<0.001; R2=0.70 (at Step 3). The most significant predictor of overall functioning was SIPS Disorganized (β=0.59), followed by Stroop Color/Word Interference (β = –0.44). Baseline SAS Overall was not a significant predictor (β=0.28; p=0.06).
When the four variables that were significantly correlated with follow-up SAS Social/Leisure, in addition to baseline SAS Social/Leisure, were included in the second backward multiple regression, we observed a significant regression coefficient that accounted for 64% of the variance in social role functioning at outcome: F[5, 15]=5.42; p=0.005; R2=0.64 (at Step 1). After SAS Social/Leisure and SIPS Negative were excluded from the model, the three-predictor model, including SIPS Disorganized, HVLT Total Recall, and Stroop Color/Word Interference, accounted for 61% of the variance in follow-up SAS Social/Leisure, F[3, 17]=8.78; p=0.001; R2=0.61 (at Step 3). The most significant predictor of social role functioning was SIPS Disorganized (β=0.49), followed by the Stroop Color/Word Interference (β = –0.37). HVLT's regression coefficient was not significant (β = –0.31; p=0.08).
When the three variables that were significantly correlated with follow-up SAS Work Role, in addition to baseline SAS Work Role, were included in the third backward multiple regression, we observed a significant regression coefficient that accounted for 81% of the variance in Work Role Functioning at outcome: F[4, 11]=11.62; p=0.001; R2=0.81 (at Step 1). After baseline SAS Work Role was excluded from the model, Stroop Color-Naming, Stroop Color/Word Interference, and Numerical Attention significantly contributed to the prediction of follow-up SAS Work Role, accounting for 79% of the variance: F[3, 12]=14.92; p<0.001; R2=0.79 (at Step 2). The most significant predictor of follow-up Work Role Functioning was Stroop Color-Naming (β = –0.50), followed by the Stroop Color/Word Interference (β = –0.38), and Numerical Attention (β=0.31).


