The U.S. fares well against most European countries in terms of youth drinking.Few seem to dispute that illicit drug and alcohol use has soared over the last decade nor that the consequences of that use have also continued to multiply. However, as addiction specialists and lawmakers ponder the latest data on those consequences, an interesting finding has emerged.
Contrary to some long-held beliefs, the stricter control of alcoholic beverages in the United States has not translated into a “forbidden fruit” mentality where American youth drink more and experience more problems than countries with weaker controls on alcohol sales and consumption.
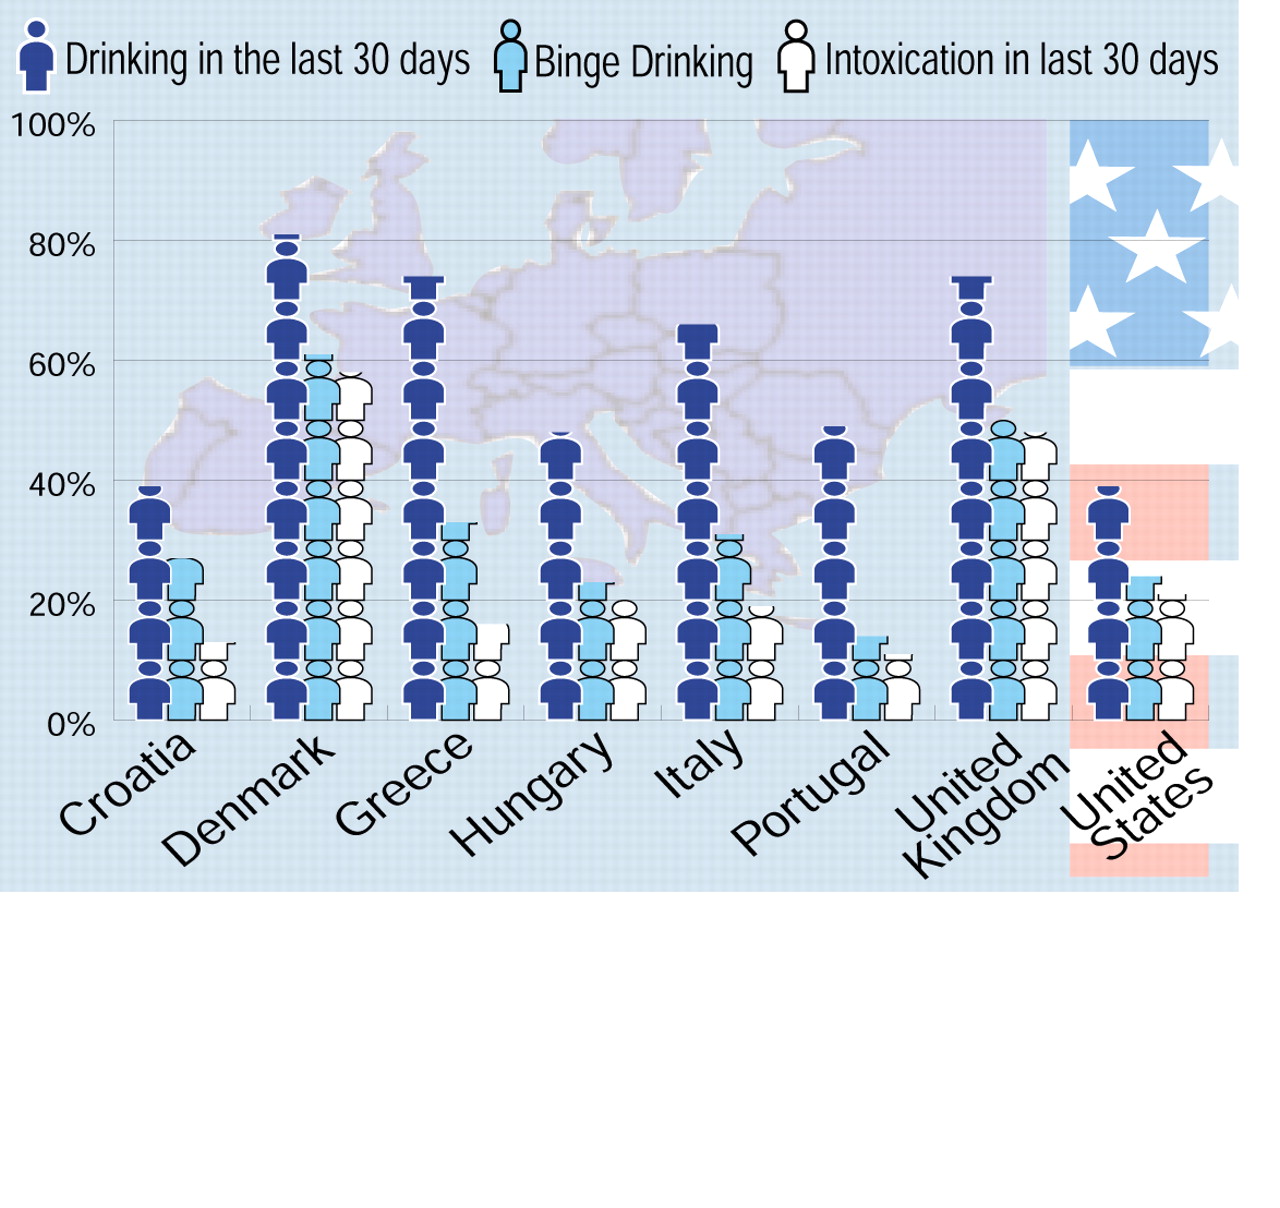
According to a new study by the U. S. Department of Justice’s Office of Justice Programs (OJP), the first direct comparison of data on drinking rates of European and U.S. youth showed that young people in the U.S. fare better on three common measures of problematic drinking (see chart).
In recent years European countries have sometimes been cited as an example in the argument to loosen restrictions the United States imposes on the sale and consumption of alcohol. Proponents of loosening restrictions claim that doing so would reduce the appeal of the “forbidden” substance and thus translate into reductions in underage drinking and its consequences. They claim that because of looser controls in most countries in Europe, European youth “grow up around alcohol” and therefore learn to drink more responsibly at earlier ages than do American youth.
Not so, according to the data released by the justice department. The OJP comparison looked at data collected in 1995 from the European School Survey Project on Alcohol and Other Drugs (ESPAD), which targeted 15- to 16-year-old students in 26 European countries.
The questionnaire used in the European study was closely modeled after the Monitoring the Future Survey (MTF), conducted for the National Institute on Drug Abuse since 1975.
The European data were compared with the MTF data collected from more than 17,000 10th-grade students in 1995. In the MTF survey, 39 percent of 10th graders reported that they had drunk alcohol in the preceding 30 days. With the exception of Croatia, which tied with the U.S. at 39 percent, each of the remaining European countries had higher rates of drinking within the previous 30 days.
Both the ESPAD and MTF surveys also looked at binge drinking, defined as consuming five or more drinks in a row. Only Portugal (14 percent) had a substantially lower rate than that seen in the U.S. (24 percent).
A third measure of potentially problematic youth drinking analyzed by the OJP was intoxication.
Both the ESPAD and MTF used identical questions on the surveys to identify self-reported incidents of intoxication within the previous 30 days. On this measure, adolescents in the U.S. showed a moderate rate of intoxication (21 percent) compared with their European peers. Some countries (Greece, Portugal, Croatia) had lower rates of self-reported youth intoxication, while others (Denmark, United Kingdom) had higher rates.
The Justice Department study concludes that the comparison of data from the MTF and the ESPAD provides no evidence that less-restrictive regulations on alcohol sales and consumption in Europe have led European youth to drink more responsibly than their counterparts in the U.S.
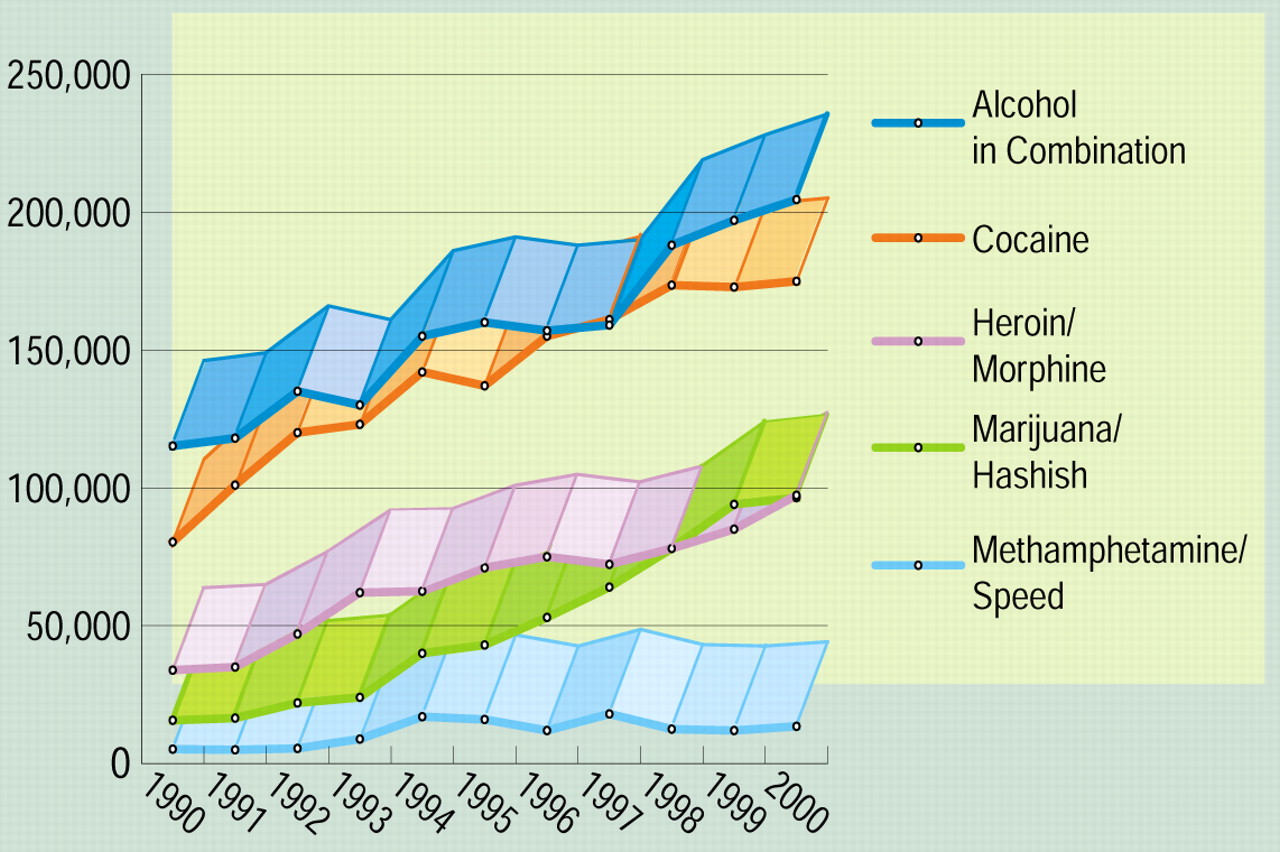
The number of drug-related ER visits rose dramatically for each illicit drug followed through the 1990s. Data are from the 2000 DAWN study. (Source: U.S. Department of Justice, Office of Justice Programs)In a separate report issued in August the Substance Abuse and Mental Health Services Administration released data from the 2000 Drug Abuse Warning Network (DAWN) Report showing that although American youth may fare better than most European teens when it comes to problematic drinking, alcohol consumption when combined with other drug use remained the leading cause of drug-related visits to emergency rooms last year.
The DAWN report is an annual survey of hospital emergency departments designed to collect data on emergency department admissions related to use of an illegal drug or the nonmedical use of a legal drug. The survey is used to estimate the effects of drugs on the health of substance abusers rather than actual prevalence of drug use by the U.S. population.
The 2000 survey showed that the number of drug-related emergency room visits remained relatively stable from 1999 to 2000, with just over 600,000 admissions nationally.
The most commonly mentioned drugs causing an emergency room visit also did not change from 1999 to 2000, with alcohol in combination with any other drug (34 percent) again topping the list, followed by cocaine (29 percent), heroin/morphine (16 percent), marijuana/hashish (16 percent), amphetamines (3 percent), and methamphetamine/speed (2 percent).
Emergency room records mentioning cocaine and marijuana or hashish did not change from 1999 to 2000, but there were significant increases in admissions due to amphetamine use (up 35 percent from 1999), PCP (up 32 percent), methamphetamine/speed (up 13 percent), and heroin or morphine (up 15 percent).
Males continued to have the highest overall rates of drug-related emergency room visits during 2000, and the rates remained steady. Such drug-related visits for females, however, rose 9 percent.
The racial/ethnic mixture of patients admitted remained relatively stable from 1999 to 2000, with one striking exception. Drug-related emergency room visits for patients of Hispanic background rose 20 percent.
There were also striking changes based on age categories. From 1999 to 2000, ER visits rose 20 percent for patients 12 to 17 years old and 13 percent for patients aged 18 to 25 while remaining stable for patients older than 25.
“This report shows again that we face serious gaps in preventing and treating substance abuse, especially with club drugs,” said Health and Human Services Secretary Tommy G. Thompson. “Our first line of defense against substance abuse must be prevention. We need to reach out to people before they become statistics in emergency departments—or worse, in the morgue.”
The OJP comparison report is available online at www.udetc.org/publications.htm, by clicking on the heading “Comparison of Drinking Rates and Problems.” The 2000 DAWN data are available at www.drugstatistics.samhsa.gov by clicking on the DAWN icon on the left. ▪
With the release of two related studies, the federal government presents a profile of the consequences of illicit drug and alcohol use among Americans and, for the first time, compares those data with European statistics.
If you have the appropriate software installed, you can download article citation data to the citation manager of your choice. Simply select your manager software from the list below and click Download.
For more information or tips please see 'Downloading to a citation manager' in the Help menu.
View Options
View options
Login options
Already a subscriber? Access your subscription through your login credentials or your institution for full access to this article.
PsychiatryOnline subscription options offer access to the DSM-5-TR® library, books, journals, CME, and patient resources. This all-in-one virtual library provides psychiatrists and mental health professionals with key resources for diagnosis, treatment, research, and professional development.
Need more help? PsychiatryOnline Customer Service may be reached by emailing [email protected] or by calling 800-368-5777 (in the U.S.) or 703-907-7322 (outside the U.S.).
If the address matches an existing account you will receive an email with instructions to retrieve your username
Create a new account
Change Password
Password Changed Successfully
Your password has been changed
Login
Reset password
Can't sign in? Forgot your password?
Enter your email address below and we will send you the reset instructions
If the address matches an existing account you will receive an email with instructions to reset your password.
Change Password
Congrats!
Your Phone has been verified
×
As described within the American Psychiatric Association (APA)'s Privacy Policy and Terms of Use, this website utilizes cookies, including for the purpose of offering an optimal online experience and services tailored to your preferences. Please read the entire Privacy Policy and Terms of Use. By closing this message, browsing this website, continuing the navigation, or otherwise continuing to use the APA's websites, you confirm that you understand and accept the terms of the Privacy Policy and Terms of Use, including the utilization of cookies.