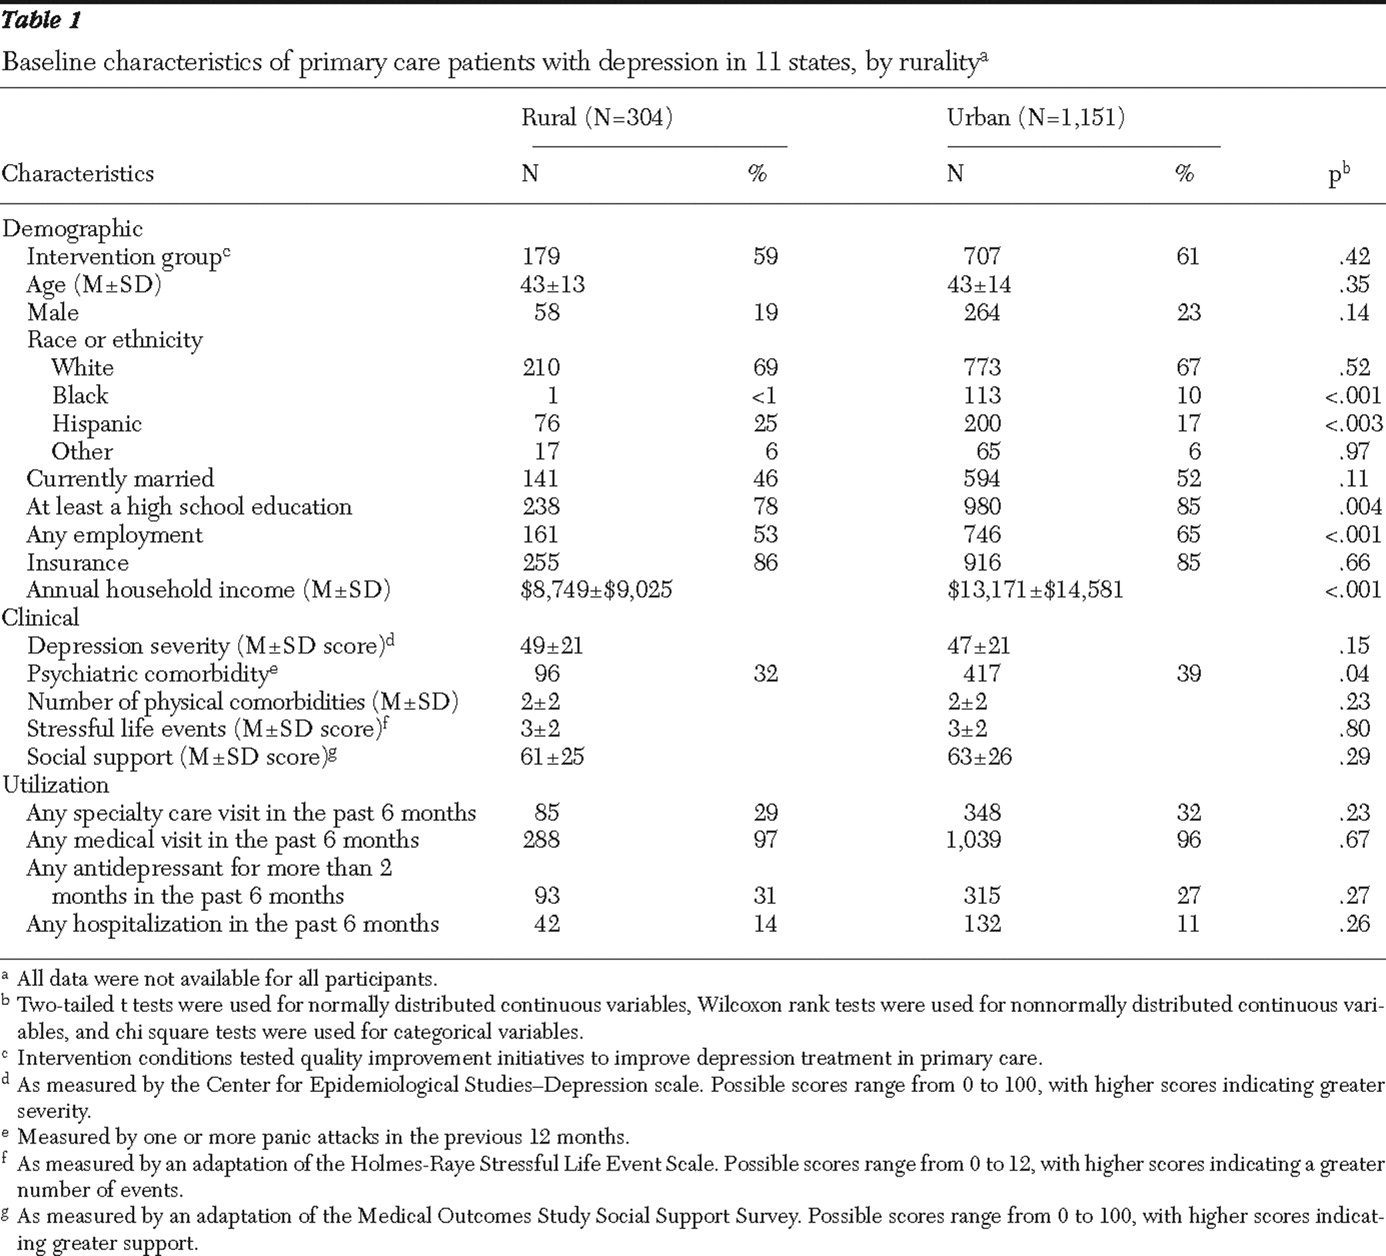
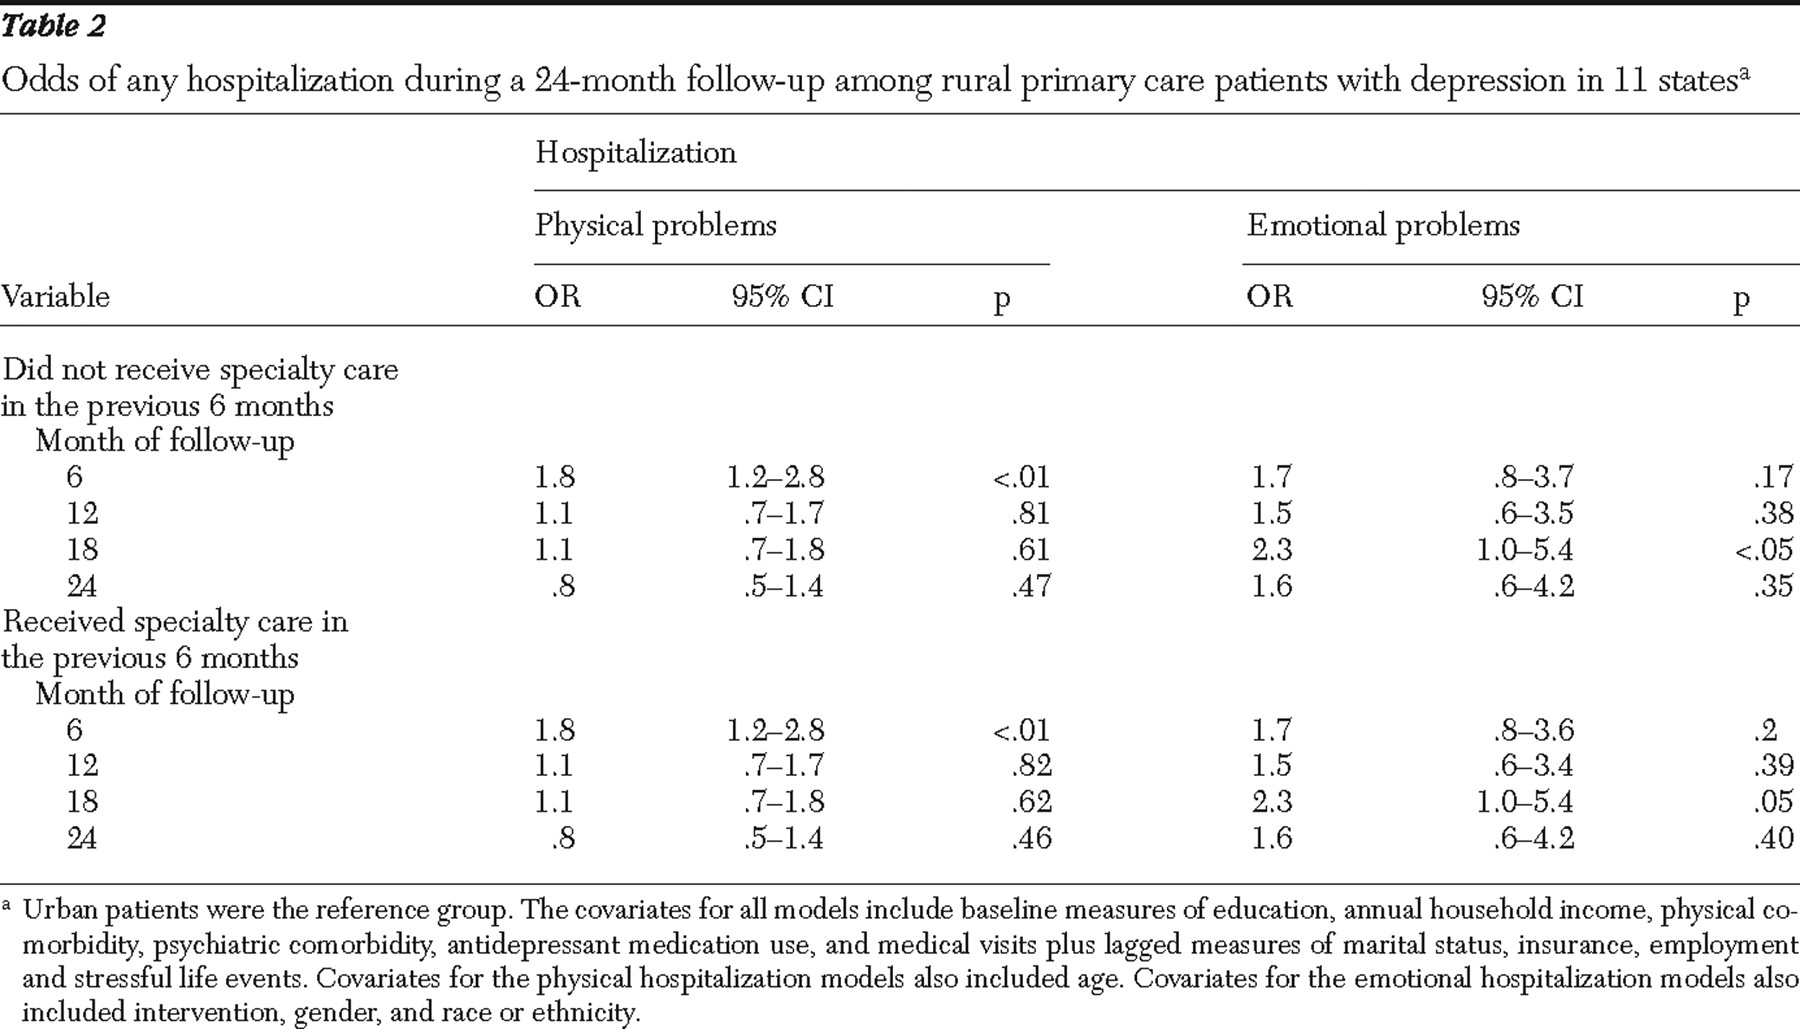
Sample
PIC participants included a consecutively sampled cohort of 967 primary care patients with depression who were recruited from 46 practices in seven managed care organizations in five states, including three practices in Alamosa County, Colorado (1995 county population of 14,291), a nonadjacent non-metropolitan statistical area (MSA) located approximately 110 miles from the nearest MSA. The other 43 practices were located in MSAs.
QuEST participants included a consecutively sampled cohort of 479 primary care patients with depression who were recruited from 12 practices in 65 health plans in ten states, including four practices in non-MSA counties in Minnesota, North Dakota, Oregon, and Wisconsin. Within the non-MSAs, we recruited two practices in counties adjacent to a MSA and two practices in counties nonadjacent to a MSA. The four non-MSA practices were located in Fergus Falls, Minnesota, in Otter Tail County (1996 county population of 53,857), approximately 50 miles from the nearest MSA; Minot, North Dakota, in Ward County (1996 county population of 59,755), approximately 115 miles from the nearest MSA; Reedsport, Oregon, in Douglas County (1996 county population of 10,728), approximately 75 miles from the nearest MSA; and Mauston, Wisconsin, in Juneau County (1996 county population of 23,762), approximately 70 miles from the nearest MSA.
Both PIC and QuEST began enrolling participants in 1996. Patients with schizophrenia and bipolar disorder were excluded from the study. QuEST excluded primary care patients who screened positive for alcohol dependence. PIC did not. For the PIC and QuEST projects, 35% (1,356 of 3,918) and 73% (479 of 653), respectively, of patients who screened positive for depression agreed to participate in the studies. Practices in both the PIC and QuEST studies were randomly assigned to intervention or control conditions. Intervention practices tested quality improvement initiatives to improve depression treatment in primary care. Because there were too few patients in the control group to test our hypotheses only in the control group, we controlled for intervention status as a potential confounder in all analyses where it predicted the dependent variable at p<.20. We chose not to weight participants for participation and attrition, because previous analyses weighting QuEST participants by the probability of participation and attrition produced virtually identical results to unweighted analyses (
11 ). More detailed information on recruitment is available to interested readers in previous publications (
7,
8 ).
Data collection
QuEST administered all postscreener patient assessments of core constructs by telephone. PIC administered all postscreener patient assessments of core constructs by self-report mail survey, using telephone and in-person follow-up as needed. Patients in both studies were followed by using parallel protocols and instrumentation for five waves over two years, ending in 1999. Follow-up rates in PIC were 89% at six months, 87% at 12 months, 86% at 18 months, and 89% at 24 months. Follow-up rates in QuEST were 90% at six months, 82% at 12 months, 73% at 18 months, and 70% at 24 months. The studies were approved by the institutional review boards at the University of Arkansas for Medical Sciences, the University of Colorado Health Sciences Center, the University of California at Los Angeles, and RAND.
Operational definition of major constructs
Rurality. Rurality was determined according to whether the practice location was in a MSA or a non-MSA. Patients recruited from MSA practices were classified as urban, whereas patients recruited from non-MSA practices were classified as rural.
Any hospitalization. Any hospitalization for physical problems was measured at baseline, six months, 12 months, 18 months, and 24 months by patient report of an overnight stay in a hospital or other treatment facility in the past six months for a physical problem. Any hospitalization for an emotional problem was measured by a parallel question at the same time points. We note that hospitalizations for physical problems in a depressed population are relevant because of recent discussion that depression may reduce a patient's ability to manage chronic medical conditions (
12 ).
Any outpatient specialty care. Any outpatient specialty care was measured at baseline and at six, 12, 18, and 24 months by patient report of one or more visits in the past six months to a mental health professional—that is, a psychiatrist, psychologist, or social worker.
Covariates. Other potential contributors to probability of hospitalization include sociodemographic characteristics, clinical characteristics, treatment attitudes, insurance, and intervention status. Sociodemographic covariates were measured by patient report of baseline age, gender, minority status (member of a racial or ethnic minority group or not), education (high school educated or not), marital status (currently married or not), and employment status (employed full- or part-time or not). Clinical covariates were measured by patient report of depression severity, psychiatric comorbidity, physical comorbidity, antidepressant use, social support, and stressful life events, as described in a previous publication (
6 ).
Depression severity was measured by the modified Center for Epidemiological Studies-Depression, by using a scale with a range of 0 to 100, with higher scores indicating greater severity. Psychiatric comorbidity was measured by one or more panic attacks in the previous 12 months.
Physical comorbidity was measured by a checklist of chronic physical problems with a range of 1 to 14, with higher scores indicating greater physical comorbidity. Baseline antidepressant use was measured by use of antidepressant medication for two months or longer in the past six months.
Treatment attitudes were measured by patient report of the acceptability of antidepressant use, individual counseling, and group counseling scored as three dichotomous variables. Insurance status was measured by health insurer type and coded by a set of dummy variables (Medicare, Medicaid, and private insurance versus no insurance). Intervention was measured by study records noting whether the patient was recruited from a practice that was randomly assigned to the intervention or control group.
Analysis
To compare baseline characteristics between rural patients and urban patients, we used two-tailed t tests for normally distributed continuous variables, Wilcoxon rank tests for nonnormally distributed continuous variables, and chi square tests for categorical variables. To test the hypothesis that rural primary care patients with depression have greater odds of hospitalization for physical problems and for emotional problems over two years, we employed longitudinal logistic regression models (
13 ), in which the probability of any hospitalization over a six-month period was modeled with a logit link function and binomial distribution. Observations of each patient were assumed to be dependent by including subject random effects in the model. The final model included rurality and covariates that had p values less than or equal to .20 in univariate analysis (
14 ). Generalized estimating equations (
15 ) were used to obtain coefficients that we used to calculate the odds ratio (OR) for hospitalization for physical problems and the OR for hospitalization for emotional problems.
To test the hypothesis that rural-urban differences in the odds of hospitalization would disappear in models controlling for outpatient specialty care in the previous six months, we conducted mediation analysis (
16 ), in which a series of models were fitted. The first mediation model tested whether rurality predicted outpatient specialty care visits, adjusting for other covariates. The second model tested whether outpatient specialty visits in the previous six months reduced rural-urban differences in hospitalization rates. The third model tested whether rural and urban patients with depression differed in the rate of outpatient specialty visits. Conservative power analyses indicated that the sample of 1,151 urban patients and 304 rural patients provided 80% power with p<.05 to find an OR of 1.8 or greater for hospitalizations for physical problems and an OR of 3.2 or greater for hospitalizations for emotional problems. All statistical analyses were performed by using SAS version 9.1.


