CTI case management
Duration and reasons for ending case management. The planned length of CTI services for phase 2 clients was six months, with exceptions at the case manager's discretion. (The planned duration of CTI services in the current project was somewhat shorter than the nine months recommended by the originators of the model. The intention was to increase the number of clients seen by the lone case manager at each project site). The average duration of CTI services was approximately seven months (212 days), with 53% involved for 180 days or less. During phase 2, typical caseload size per case manager was ten clients; caseload very rarely exceeded 15 per case manager at any of the project sites.
Successful accomplishment of significant clinical goals was the most common reason for ending case management (39%), followed by completion of limited improvement (22%). Less successful reasons for ending case management included clients' inability to tolerate CTI (19%), moving out of the area (15%), and returning to active substance abuse (13%). These categories are not mutually exclusive, and responses were based on the clinical judgment of the case manager.
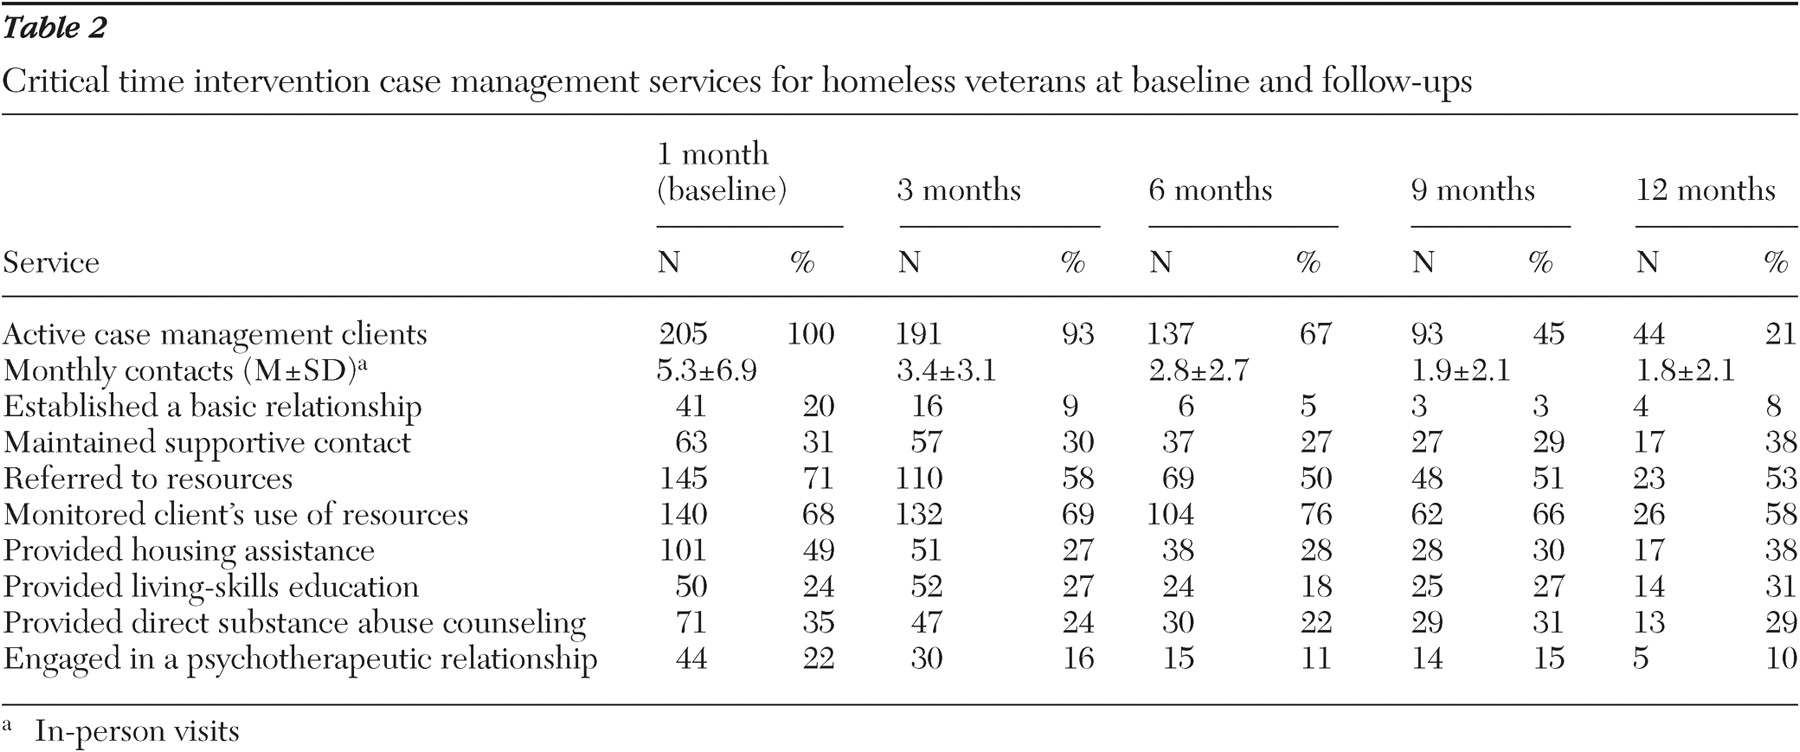
Case management contacts and services. Table 2 shows the average number of CTI case management contacts at baseline and each of the follow-ups (in-person visits). These data reflect relatively intensive case management, with an average of five contacts during the first month. The number of contacts per month was fewer at each subsequent follow-up interval and averaged two at nine and at 12 months.
Also shown in
Table 2, the three most prevalent activities at the one-month report were making referrals to other agencies for resources such as financial benefits and treatment services (71%), monitoring clients' use of those resources (68%), and providing housing assistance (49%). Direct service activities, such as living-skills education (24%), direct substance abuse counseling (35%), and psychotherapy (22%), were less frequent but occurred in a substantial number of cases at the one-month report.
In summary, these process data suggest that the CTI program provided relatively intensive but time-limited case management and that most clients ended case management successfully in the view of their case manager.
Client outcomes
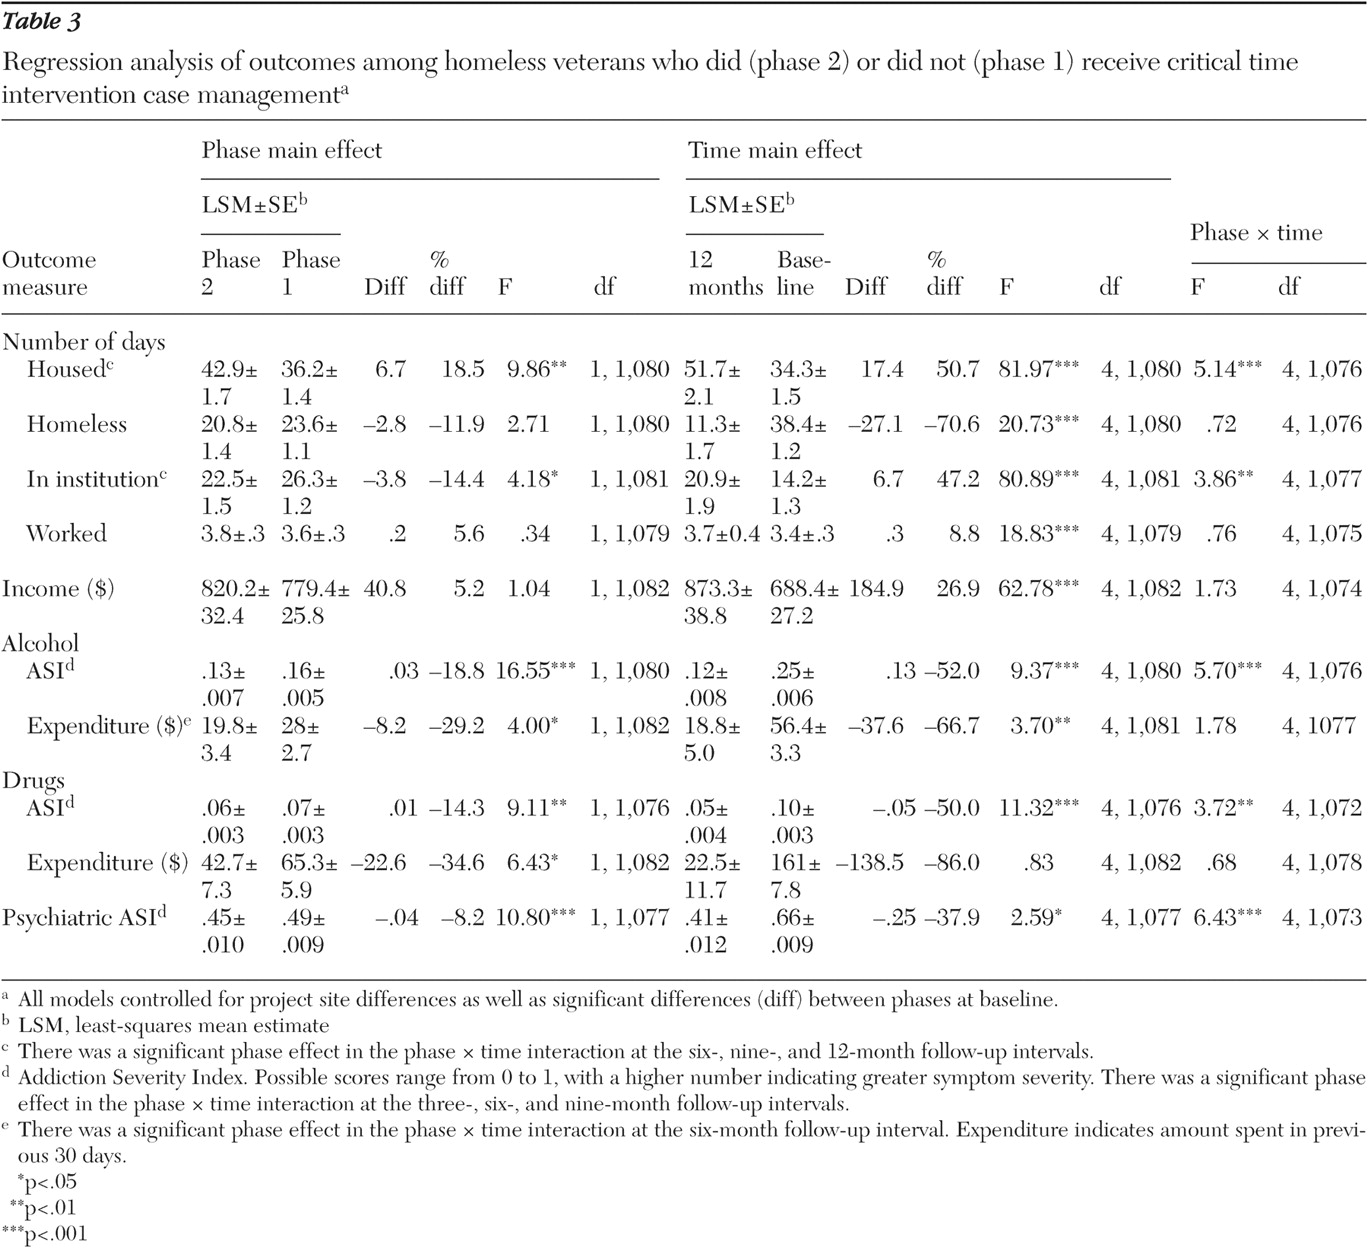
Regression statistics for all client outcomes are summarized in
Table 3 .
Housing. On average, phase 2 clients reported 6.7 (19%) more days housed in the previous 90 than those in phase 1 (p=.002). Both groups significantly increased the number of days housed over the one-year follow-up (p<.001). However, phase 2 clients had significantly more days housed at the six-, nine-, and 12-month follow-up intervals (p=.02, p=.001, and p=.001, respectively).
There was no overall effect of treatment cohort on number of days of homelessness. However, both groups significantly decreased the number of days spent homeless over the course of follow-up (p<.001).
Phase 2 clients on average reported significantly fewer days in institutions during the previous 90 than phase 1 clients (p=.041). As would be expected for clients recruited from hospitals, the number of days in institutions first increased, then decreased over the course of follow-up. Phase 2 clients spent significantly fewer days in institutional settings at the six-, nine-, and 12-month follow-up intervals (p=.01, p=.001, and p=.001, respectively).
Employment and income. There was no difference between phases in the number of days worked in the 30 days before the interview or in total monthly income. There was a small but statistically significant increase in the number of days worked over the course of the follow-up interval (p<.001). Change in the number of days worked over the course of follow-up was not different for the two groups. Similarly, there was a significant increase in total income over the course of the follow-up interval (p<.001). However, change in total monthly income over the course of follow-up was not different for the two groups.
Alcohol use. On average, phase 2 clients used less alcohol than phase 1 clients did (p<.001). Both groups significantly decreased alcohol use over the one-year follow-up (p<.001). However, phase 2 clients had significantly lower alcohol use than phase 1 clients at the three-, six-, and nine-month follow-up intervals (p<.001, p<.001, and p=.001, respectively).
Phase 2 clients on average spent less on alcohol in the previous 90 days than phase 1 clients (p=.046). Both groups significantly decreased spending on alcohol over the course of the one-year follow-up (p=.003). The only between-group difference on this measure was at the six-month follow-up interval (p=.02).
Drug use. On average, phase 2 clients had lower illicit drug use than phase 1 clients (p=.004). Both groups significantly decreased drug use over the one-year follow-up (p<.001); however, phase 2 clients had significantly lower drug use at the three-, six-, and nine-month follow-up intervals (p<.001, p<.001, and p=.04, respectively).
Phase 2 clients on average spent less on illicit drugs in the previous 90 days than phase 1 clients spent (p=.011). There was no significant change in expenditure over the course of the one-year follow-up. The only between-group difference on this measure was at the six-month follow-up interval (p=.035).
Psychiatric problems. On average phase 2 clients reported fewer psychiatric problems than phase 1 clients (p=.001). Both groups reported significantly fewer psychiatric problems over the one-year follow-up (p=.035). However, phase 2 clients had significantly fewer psychiatric problems at the three-, six-, and nine-month follow-up intervals (p<.001, p<.001, and p=.005, respectively).


