Concerns about quality of mental health treatment have prompted national efforts to develop consumer ratings of mental health care (
1,
2,
3,
4 ), with the most prominent example being the Experience of Care and Health Outcomes survey (
1 ). Advocacy organizations (
5 ) and federal agencies (
6 ) have promoted surveys of mental health consumer satisfaction as tools for quality improvement. At the marketplace level, distributing satisfaction "report cards" to health care purchasers can create business incentives for health plans to improve quality or availability of care. At the health system level, using satisfaction measures to create financial incentives for providers or facilities is a potentially powerful tool to promote consumer-centered quality improvement. Some group-model health plans now use consumer satisfaction surveys to adjust compensation for physician providers and clinic managers.
There are, however, significant concerns about use of satisfaction surveys to compare the performance of mental health providers or facilities. First, response rates for mail surveys are typically 50% or lower. Research regarding general health plan satisfaction surveys has found lower response rates among consumers who are older, have disabilities, are female, or are members of racial or ethnic minority groups (
7,
8 ). No previous research has examined predictors of response or the potential for bias resulting from differential responses in satisfaction surveys regarding mental health providers or facilities. Second, satisfaction ratings may be influenced by consumers' clinical characteristics (such as mood state) or demographic characteristics (such as age, sex, income, or race and ethnicity). Research regarding general health plan satisfaction suggests that satisfaction ratings may reflect differences in consumers served rather than differences in the quality or availability of care (
9,
10,
11 ). Accounting for those case-mix differences could have significant impact on the rankings of health plans or facilities (
12 ). Previous research regarding satisfaction with mental health care has often not considered whether differences between providers simply reflect differences in types of patients seen. Bjorngaard and colleagues (
13 ) found only minimal differences in satisfaction between community mental health teams after accounting for differences in patient populations. Druss and colleagues (
14 ) found that consumer satisfaction with inpatient mental health care was associated with more consistent follow-up care and lower readmission rates. Although more satisfied consumers received higher-quality care, it was not clear that facilities with more satisfied consumers delivered higher-quality care.
Mental health providers have expressed low acceptance for financial incentives tied to consumer satisfaction (
15 ). If satisfaction ratings will be used to promote patient-centered care, then providers and managers must have confidence that satisfaction measures are both fair (not biased by different response rates or case mixes) and valid (accurately reflect differences between providers in the process and quality of care).
In this study we used data from mailed consumer satisfaction surveys concerning a group-model prepaid health plan to address the following questions: How is responding to a mailed satisfaction survey related to demographic and clinical characteristics of mental health consumers? Among those who respond, how are consumers' satisfaction ratings related to those same demographic and clinical characteristics? How does adjusting for these potential biases affect comparisons of satisfaction ratings between providers?
Methods
Study setting
Group Health Cooperative is a not-for-profit prepaid health plan serving approximately 500,000 members in Washington State and northern Idaho. Members are enrolled through employer-sponsored plans (79% of members), individual plans (9% of members), a capitated Medicare plan (6% of members), and publicly funded capitated plans for low-income residents through Medicaid and the Washington Basic Health Plan (6% of members). The Group Health enrollment is similar to the area population in income, educational attainment, and representation of different racial and ethnic groups.
Group Health provides specialty mental health care through both a group model and a network model. The satisfaction survey data described here were limited to seven group-model clinics serving more densely populated areas in or near the Washington cities of Bellevue, Bremerton, Olympia, Seattle, Spokane, and Tacoma. As of January 2005, staff at group-model mental health clinics included 14 psychiatrists, 11 doctoral-level psychologists, and 65 master's-level psychotherapists. The number of psychotherapists in each of the seven clinics ranged from seven to 13. Staffing levels were generally similar to those of other group-model health plans (
16 ), and each provider is expected to see a minimum number of new patients each week. All providers are salaried employees. Guidelines and provider training emphasize structured psychotherapies, including cognitive-behavioral therapy, dialectical behavior therapy, and problem-solving therapy.
Satisfaction surveys
Since 2001 Group Health has conducted routine satisfaction surveys of adult consumers making individual visits to group-model mental health providers. Visitor registration records were used to select a random sample of clinic visits (up to ten per provider per month). Consumers who had completed a satisfaction survey (for either a mental health or general medical provider) within the previous six months were excluded. Each remaining sampled consumer was mailed the routine two-page survey concerning satisfaction with care given by the individual provider, the facility, and the mental health department. Initial surveys were mailed within 30 days of the sampled visit, and those not responding received up to two follow-up mailings. These analyses were limited to providers for whom at least 20 surveys were mailed between January 1, 2002, and December 31, 2005.
The mailed survey included nine items regarding satisfaction with the individual provider, each rated on a 5-point scale ranging from 1, excellent, to 5, poor. For all nine items, Cronbach's alpha coefficient was .94 and item-total correlations all exceeded .83. As is typical for satisfaction surveys, responses were skewed toward the positive end of the scale. (For every item over 40% of the ratings were excellent and less than 10% of the ratings were fair or poor.) Our analyses focused on the single item "How well this practitioner understood your concerns." This item was selected over others because each provider receives monthly feedback about her or his scores on this item and because physician providers receive additional incentive compensation based in part on consumers' responses to this item. Because of skewed data distribution, responses were dichotomized in order to compare responses of excellent with all other responses.
All procedures were reviewed and approved by Group Health's Human Subjects Review Committee. Consistent with applicable regulations, the committee granted a waiver of consent for research use of deidentified data from the satisfaction survey and computerized records.
Linkage to demographic and clinical data
A unique Group Health member number was used to link satisfaction survey data to other data systems. Data regarding consumer age, sex, type of health insurance, and duration of enrollment in the health plan were collected from membership records. Data regarding the specialty of the treating behavioral health provider, number of previous visits to that provider, and the diagnosis assigned at the index visit were collected from the visit registration records.
Data analysis
Descriptive analyses examined variability in consumer characteristics across providers and marginal associations between these characteristics and both survey response rates and satisfaction ratings. Logistic regression models were used to estimate adjusted associations while accounting for clustering of consumers within providers and providers within facilities.
Logistic regression models for survey responses were based on all mailed surveys. We modeled the probability of survey response for the
i th consumer rating and the
j th provider at the
k th facility,
r ijk , by logit(
r ijk )=
Z ij α , where
Z ij is the consumer covariate vector and
α is the parameter of covariate effects. Models were estimated from generalized estimating equations with adjustment for nonnested clustering (
17 ) and an independence working correlation matrix.
Logistic regression models for satisfaction ratings were based on all returned surveys. Because likelihood-based estimation of hierarchical logistic regression models is computationally intensive, we used marginal logistic regression models for preliminary analyses. Subsequent hierarchical models included only covariates related to either survey response or satisfaction in marginal models. We modeled the probability of an excellent rating for the
i th consumer rating and the
j th provider at the
k th facility,
p ijk , by logit(
p ijk )=
X ij α +
β 1i +
β 2 j +
β 3 k, where
X ij α is the consumer covariate vector,
α is the parameter of covariate effects, and
β 1 i,
β 2 j, and
β 3 k are consumer-, provider-, and facility-level random effects, respectively. Models were estimated with WinBUGS software (
18 ), with diffuse prior distributions for unknown parameters. This approach allowed us to account for clustering in the data using random effects, to adjust for nonresponse bias under the missing-at-random assumption by including covariates associated with survey response in the regression model (
19 ), and to estimate provider-level satisfaction rates that adjust for differences in both the number and characteristics of consumers surveyed for each provider.
The provider ratings incorporated three levels of adjustment: for variability from differences in the number of responses per provider; for consumer characteristics based on a hypothetical scenario, with all providers rated by the same consumers; and for both consumer characteristics and facility differences, based on a hypothetical scenario with all providers rated by the same patients at the same facilities.
Because the distribution of consumer characteristics varied across providers, characteristics were separated into within-provider and between-provider effects (
20,
21,
22 ). Between-provider effects estimated systematic differences between providers that were attributable to the overall characteristics of the patients in their cluster and were estimated by including provider averages in regression models. Within-provider effects estimated the relationship between patient characteristics and outcomes and were estimated by including the deviation from the provider average as a covariate.
For example, between-provider effects of age were estimated by including the mean age of consumers served by each provider, and within-provider effects were estimated by including the difference between an individual's age and the provider-specific mean. The between-provider effect of age estimated whether providers rated by older consumers were systematically different from providers rated by younger consumers. The individual deviation estimated the effect of a consumer's age on his or her probability of response or satisfaction ratings after adjustment for the average age of the consumers seen by the rated provider. Within-provider covariate effects were robust to model misspecification. Between-provider effects were sensitive to model misspecification and should be interpreted more cautiously (
20 ).
Results
The procedures described above identified 23,756 surveys mailed between January 1, 2002, and December 31, 2005. These surveys were mailed to 17,387 consumers, with 13,311 surveyed once, 2,713 surveyed twice, and 1,363 surveyed three or more times. Mailed surveys concerned 131 providers practicing at seven facilities. The number of surveys per provider ranged from 20 to 436 (mean number of mailed surveys per provider=181.3, median=173).
A total of 8,025 completed surveys were returned (33.8% of those mailed). Surveys were returned by 6,588 consumers, with 5,506 returning one survey, 828 returning two, and 254 returning three or more. Returned surveys concerned 127 providers, including 24 psychiatrists and 123 nonphysician psychotherapists. The number of completed surveys per provider ranged from five to 186 (mean number of completed surveys per provider=63.2, median=56). Across the seven facilities, the number of providers per facility ranged from seven to 24.
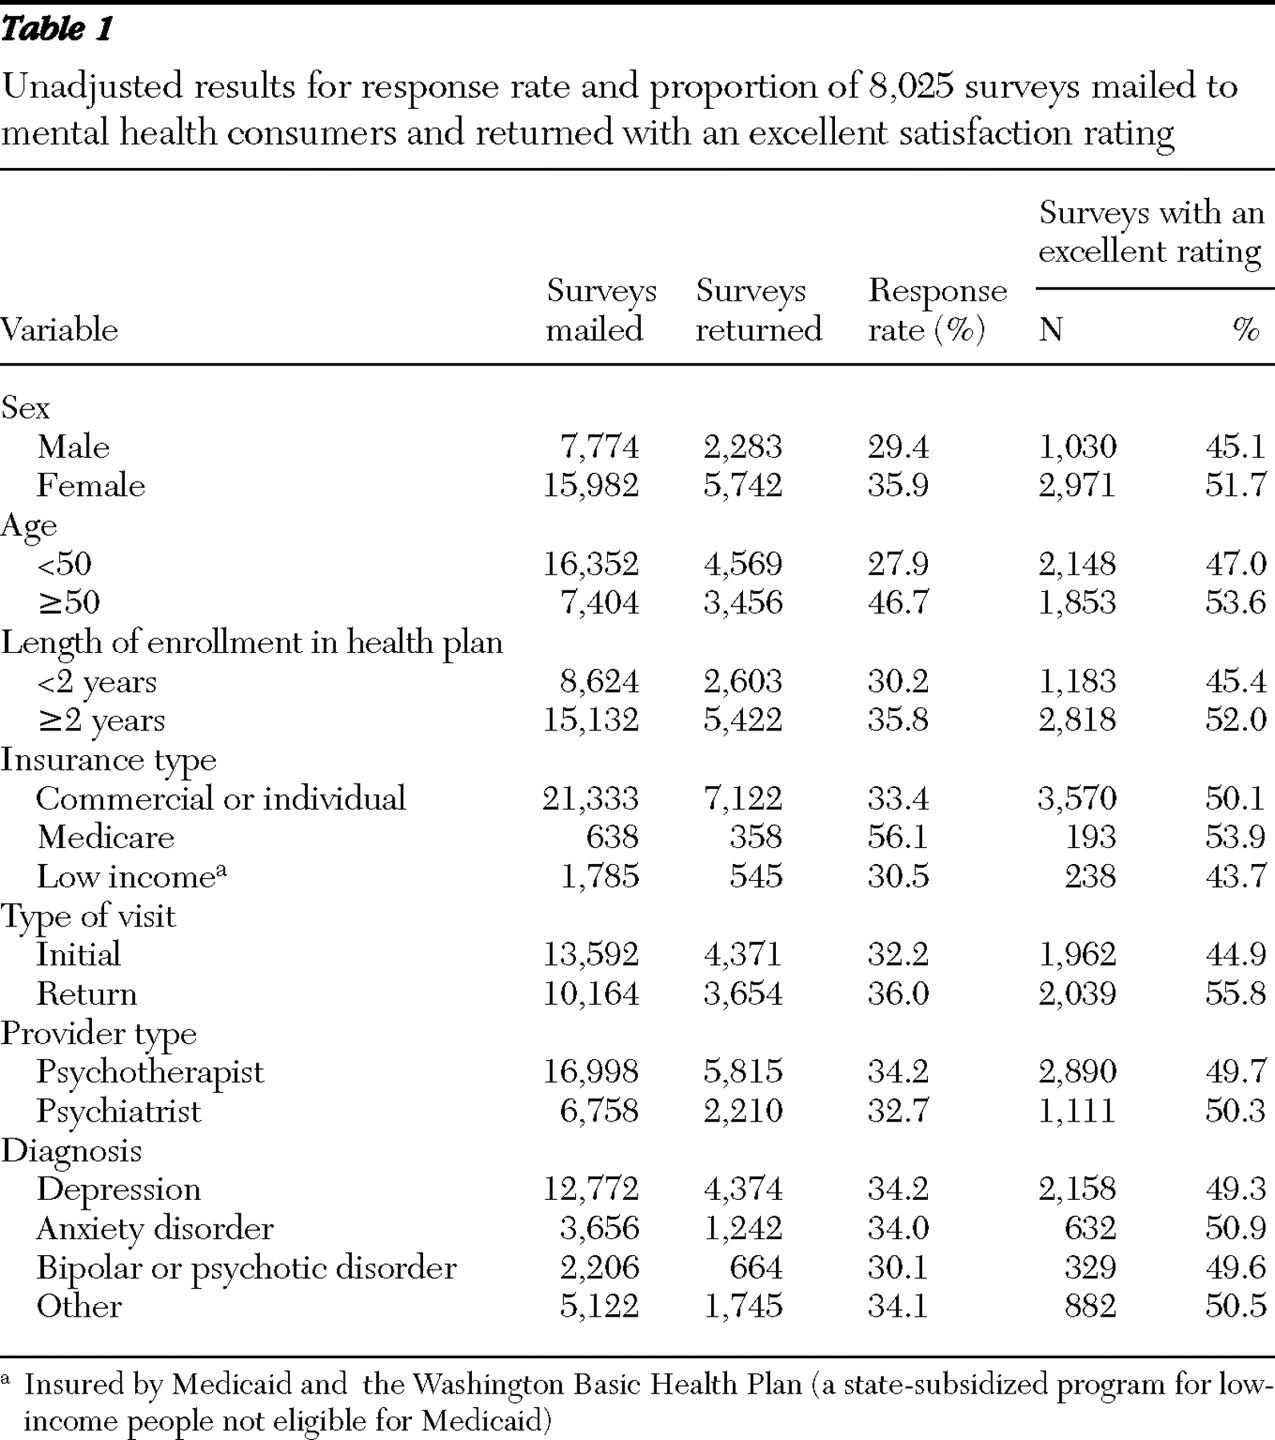
Unadjusted results are shown in
Table 1 . The proportion responding to the mailed survey was higher among women, those aged 50 or more, consumers with longer enrollment in the health plan, those insured by Medicare (versus other insurance types), and those making return visits. Response rate appeared lower among those receiving a diagnosis of bipolar or psychotic disorder at the index visit.
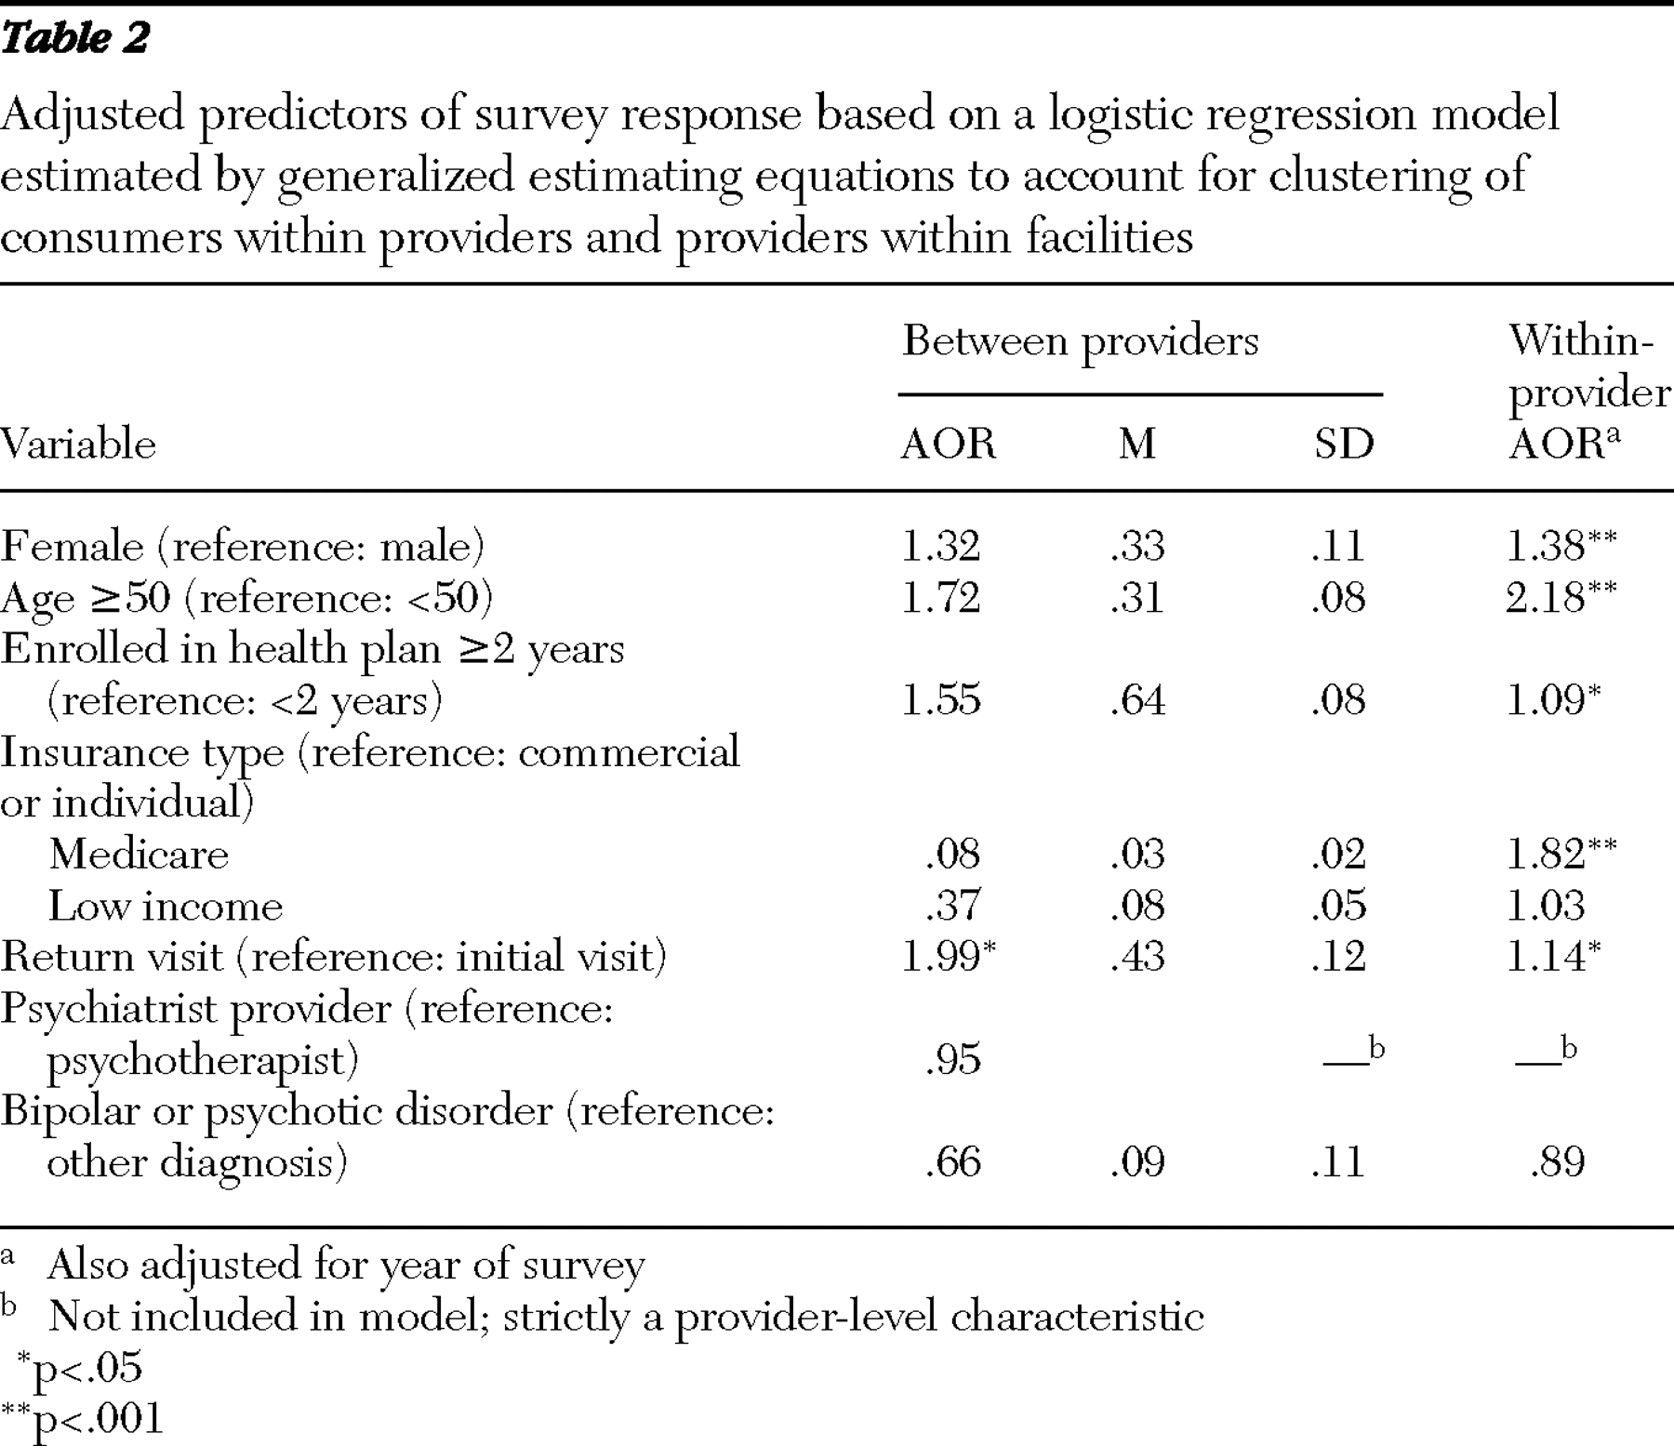
Table 2 shows regression-based estimates of the relationship between covariates and survey response, separated into between-provider effects and within-provider effects. For example, the within-provider odds ratio associated with gender estimates the relative odds of survey response for women versus men and adjusts for other consumer and provider characteristics, whereas the between-provider odds ratio associated with gender estimates the relative odds of survey response for individuals seen by a hypothetical provider who treats only women relative to another provider who treats only men. The means and standard deviations indicate the level of variability between providers. For example, the mean±SD proportion of consumers aged 50 or older was 31%±8% for all providers.
Between providers, having a higher proportion of return visitors was significantly associated with higher response rates (OR=1.99, p<.05). No other between-provider effects reached statistical significance.
Within providers, returning a survey was significantly associated with female sex, older age, longer enrollment in the health plan, being a return visitor, and insurance through Medicare.
Among returned surveys with valid responses, 49.9% gave an excellent rating in response to "How well this practitioner understood your concerns." Unadjusted results are shown in
Table 1 . Again, the proportion of consumers who gave an excellent rating was higher among women, those aged 50 or older, those with longer enrollment in the health plan, those insured by Medicare, and those making a return visit.
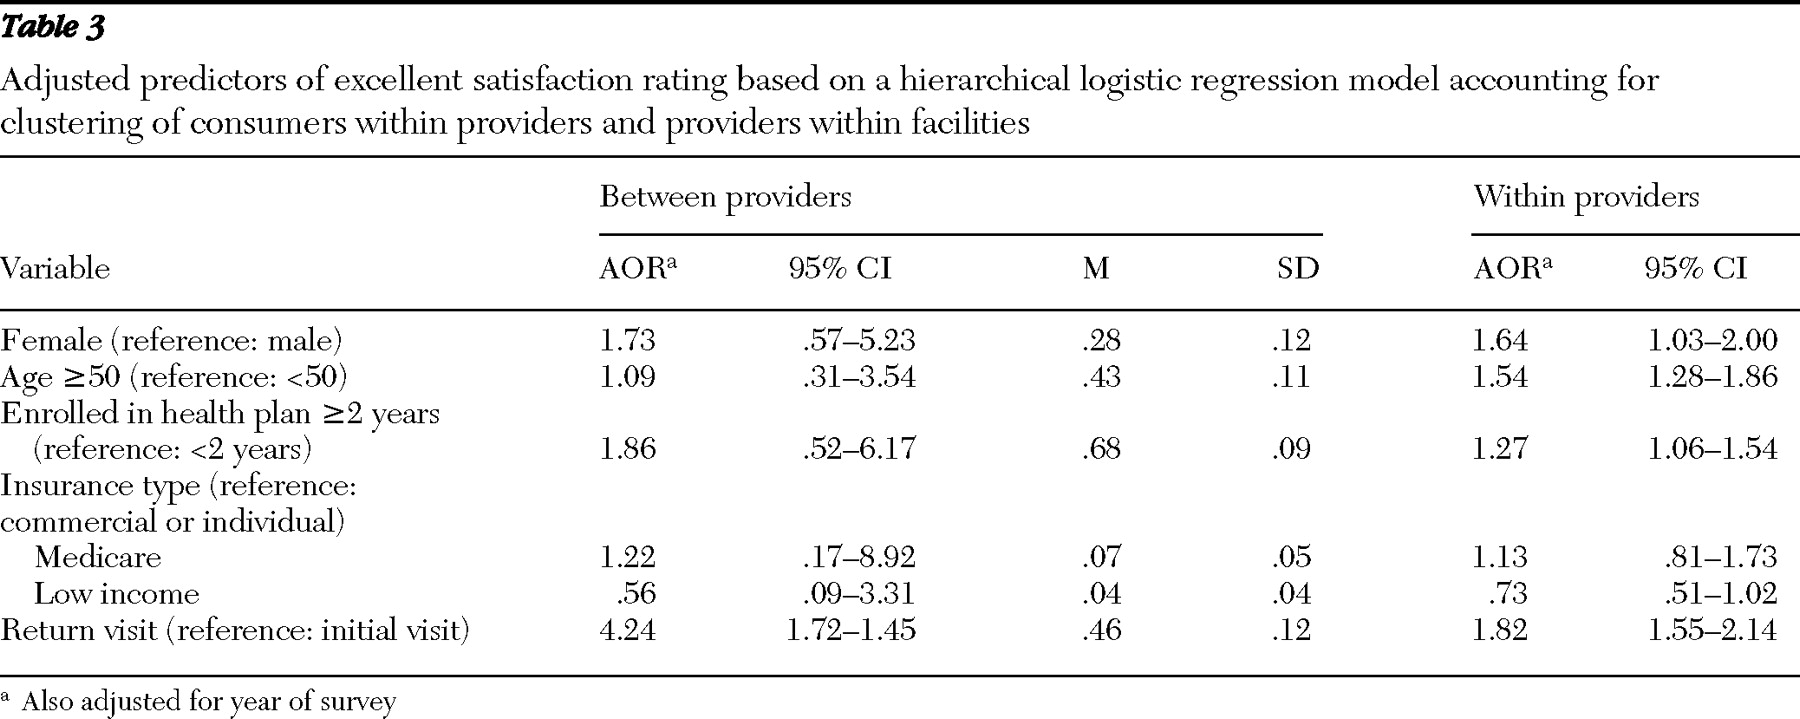
Table 3 shows regression-based estimates of the relationship between covariates and an excellent response, separated into between-provider effects and within-provider effects.
Between providers, a higher proportion of return visitors was significantly associated with higher satisfaction ratings. Again, none of the other between-provider effects were significantly associated with consumer satisfaction.
Within the practice of any provider, higher satisfaction ratings were significantly associated with female sex, older age, longer enrollment in the health plan, and being a return visitor.
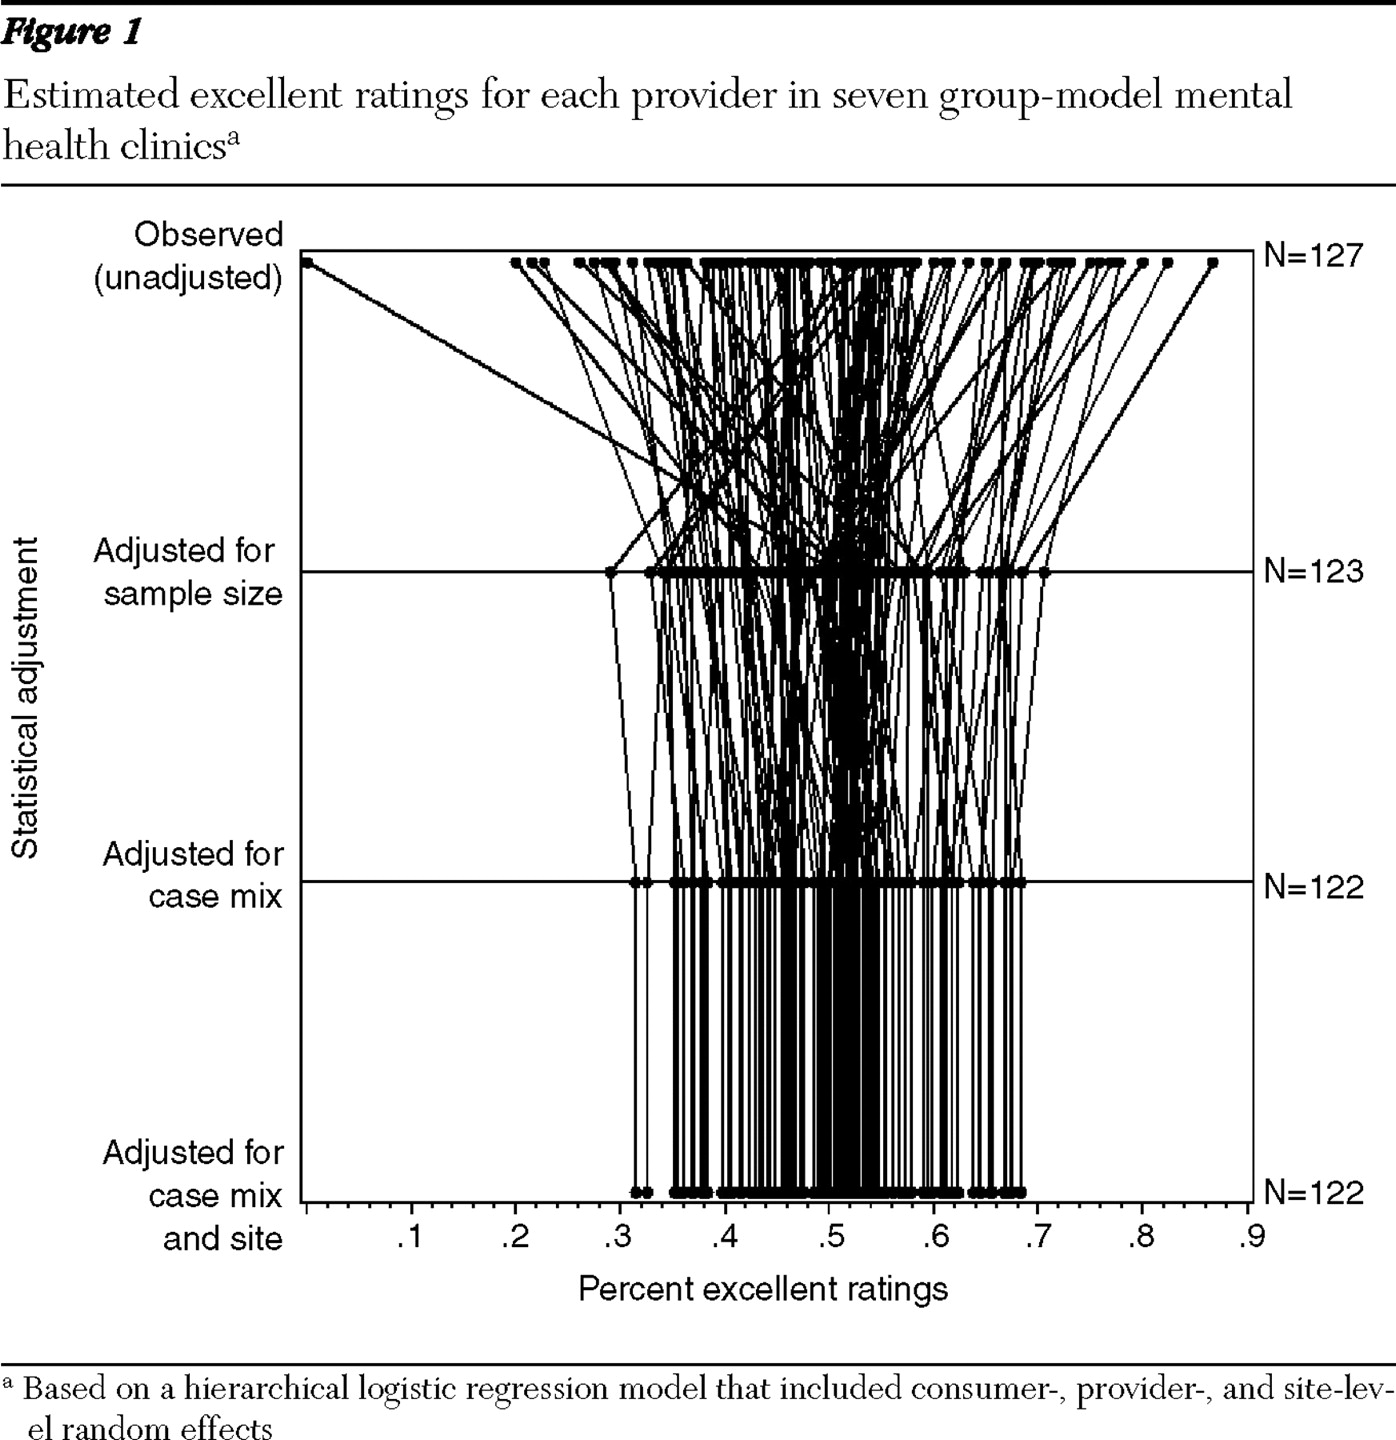
Figure 1 illustrates how adjustment affects the comparison of average satisfaction ratings across providers. These analyses were restricted to 122 providers with distinct estimates of provider and facility random effects. Adjusting for sample size accounted for a moderate portion of the observed variability between providers (in the top section, lines shrink significantly toward the mean value). Adjusting for case mix had a modest effect and changed the relative position of some providers (where some lines cross in the middle section). Adjusting for facility differences had minimal effect on either between-provider variation or the position of individual providers. Qualitative impressions are consistent with estimated random effect variance terms: patient standard deviation was large (SD=2.25, 95% confidence interval [CI]=1.94–2.57), provider standard deviation was moderate (SD=.66, CI=.08–.83), and facility standard deviation was small (SD=.18, CI=.004–.47).
Discussion
In this sample of consumers visiting group-model mental health clinics, both the probability of responding to a mailed satisfaction survey and the probability of giving an excellent satisfaction rating were moderately related to several characteristics of consumers. These characteristics, however, were much more important predictors of differences within individual providers' practices than they were predictors of differences in mean ratings between providers.
Only one-third of consumers responded to mailed surveys, which raised concerns about bias resulting from nonresponse. Our analyses assumed that satisfaction depends on observed characteristics and that, given these characteristics, response is unrelated to (possibly unobserved) satisfaction ratings. At the consumer level, response was significantly higher among women, those over age 50, those insured by Medicare, those with longer enrollment in the health plan, and those making a return visit. If, even after these characteristics were controlled for, consumers who were more satisfied were more likely to return surveys, then mailed surveys could have biased comparisons between providers and overestimated satisfaction ratings for the sample as a whole.
We found less evidence of bias in comparison of satisfaction ratings between providers. When analyses separated variability between providers from the variability within providers' practices, most consumer characteristics were not significant predictors of between-provider differences in survey response or satisfaction ratings. This finding reflects two underlying effects. First, the effects of consumer characteristics on response rates and satisfaction ratings were generally modest (
Table 2 and
Table 3 ). Second, providers' practices did not differ markedly in distribution of age, sex, or other consumer characteristics.
Having a higher proportion of returning patients, however, was significantly associated with differences in satisfaction ratings between providers. Berghofer and colleagues (
23 ) reported a similar association among outpatient consumers in Austria. We can identify two possible explanations for this finding. First, providers who happened to have a higher proportion of returning patients (providers with longer tenure in the clinic) may consequently have had higher satisfaction ratings. In this scenario, comparison of satisfaction ratings between providers might be biased by differences in the mixture of new and returning patients. Second, providers who delivered more satisfying treatment may have had a higher rate of return visits. In this scenario, the difference in case mix would be a consequence of or explanation for between-provider differences in satisfaction rather than a source of bias. Adjusting for differences in the proportion of returning patients would not be appropriate in the second case. Our data did not allow us to distinguish between these two possibilities. Duration of enrollment could also be a consequence (rather than a predictor) of satisfaction with treatment. Enrollment duration, however, was not a significant predictor of between-provider differences in satisfaction ratings.
Although most demographic and clinical characteristics were not associated with between-provider differences in satisfaction ratings, we lack data on other consumer characteristics (income, race and ethnicity, severity of symptoms, and previous treatment experience) that might be associated with satisfaction ratings. If those characteristics were associated with satisfaction and if they differed significantly between providers' practices, then between-provider comparisons of satisfaction ratings could be biased.
Figure 1 shows the proportion of observed variation in satisfaction ratings that is likely caused by random variation and the proportion that is likely caused by true differences between providers. Across all providers, the proportion of excellent ratings ranged from approximately 20% to nearly 90%. Accounting for sample size suggested that a significant proportion of this observed variability was a result of extreme ratings among providers with a small number of surveys. After adjustment for sample size, the proportion of excellent ratings ranged from approximately 30% to approximately 70%. Accounting for differences in case mix had little effect on the range or distribution of ratings. Adjustment had modest effects on the ranking of individual providers, especially for providers with a small number of ratings. Still, adjustment for case mix had little effect on classifying providers into the top or bottom quartiles of consumer satisfaction.
Our results are generally reassuring regarding the validity of consumer satisfaction surveys for evaluating the performance of mental health providers. Managers or administrators who use satisfaction survey results to evaluate provider performance might consider some specific recommendations: First, response rates below 50% do not mean that mailed satisfaction surveys cannot be used to rate or rank providers. Although respondents differed significantly from nonrespondents in several respects, those differences did not appear to lead to significant biases when comparing providers' average ratings. Second, provider rankings in the top or bottom 10% (unadjusted proportion of excellent ratings above 70% or below 30%) may not be reliable, especially for providers with fewer than ten or 15 returned surveys. Provider evaluation or incentive programs should probably focus on less extreme targets, such as ranking in the top or bottom quartile. Third, differences between providers in the characteristics of consumers served (age, sex, type of insurance coverage, or primary diagnosis) are probably not important sources of bias in comparisons of providers' mean satisfaction ratings. Diagnosis was not an important predictor of satisfaction. Consumers' age and sex were related to satisfaction, and these characteristics could be sources of bias if they differed markedly between providers.
We should emphasize that these data were drawn from group-model mental health clinics in a single prepaid, integrated health plan. Both consumers and providers may be more homogeneous than in other settings, thus limiting our ability to detect bias from differences between providers' practices. Our findings should certainly be replicated in samples with a broader range of consumer and provider characteristics.
Conclusions
Although only one-third of mental health consumers responded to mailed satisfaction surveys, there was little evidence that nonresponse bias affected comparison of satisfaction ratings across providers. Among the demographic and clinical characteristics measurable from administrative data (age, sex, insurance type, and diagnosis), none seemed to bias comparison of satisfaction ratings across providers. The potential for bias, however, may be greater in settings with more heterogeneous providers or consumers. Returning consumers tended to give higher ratings than first-time visitors, and analyses of satisfaction ratings may need to account for this difference. Extremely high or extremely low satisfaction ratings should be interpreted cautiously, especially for providers with a small number of ratings.
Acknowledgments and disclosures
This study was supported by grant P20-MH068572 from the National Institute of Mental Health.
The authors report no competing interests.
