This study was a cross-sectional analysis of data from the national VA Survey of the Health Experiences of Patients (SHEP) for FY 2005. SHEP includes questions about demographic characteristics, patient satisfaction, health status, and health behavior information, and it is mailed each month to a randomly selected sample of patients who use VA health care services. The Portland (Oregon) VA Medical Center Institutional Review Board approved this project, and the VA Office of Quality and Performance provided the deidentified data.
Measures
The SHEP sent in FY 2005 included all demographic variables and measures necessary for the study presented here except for age, sex, and site location; these data were obtained from VA administrative databases by the VA Office of Quality and Performance.
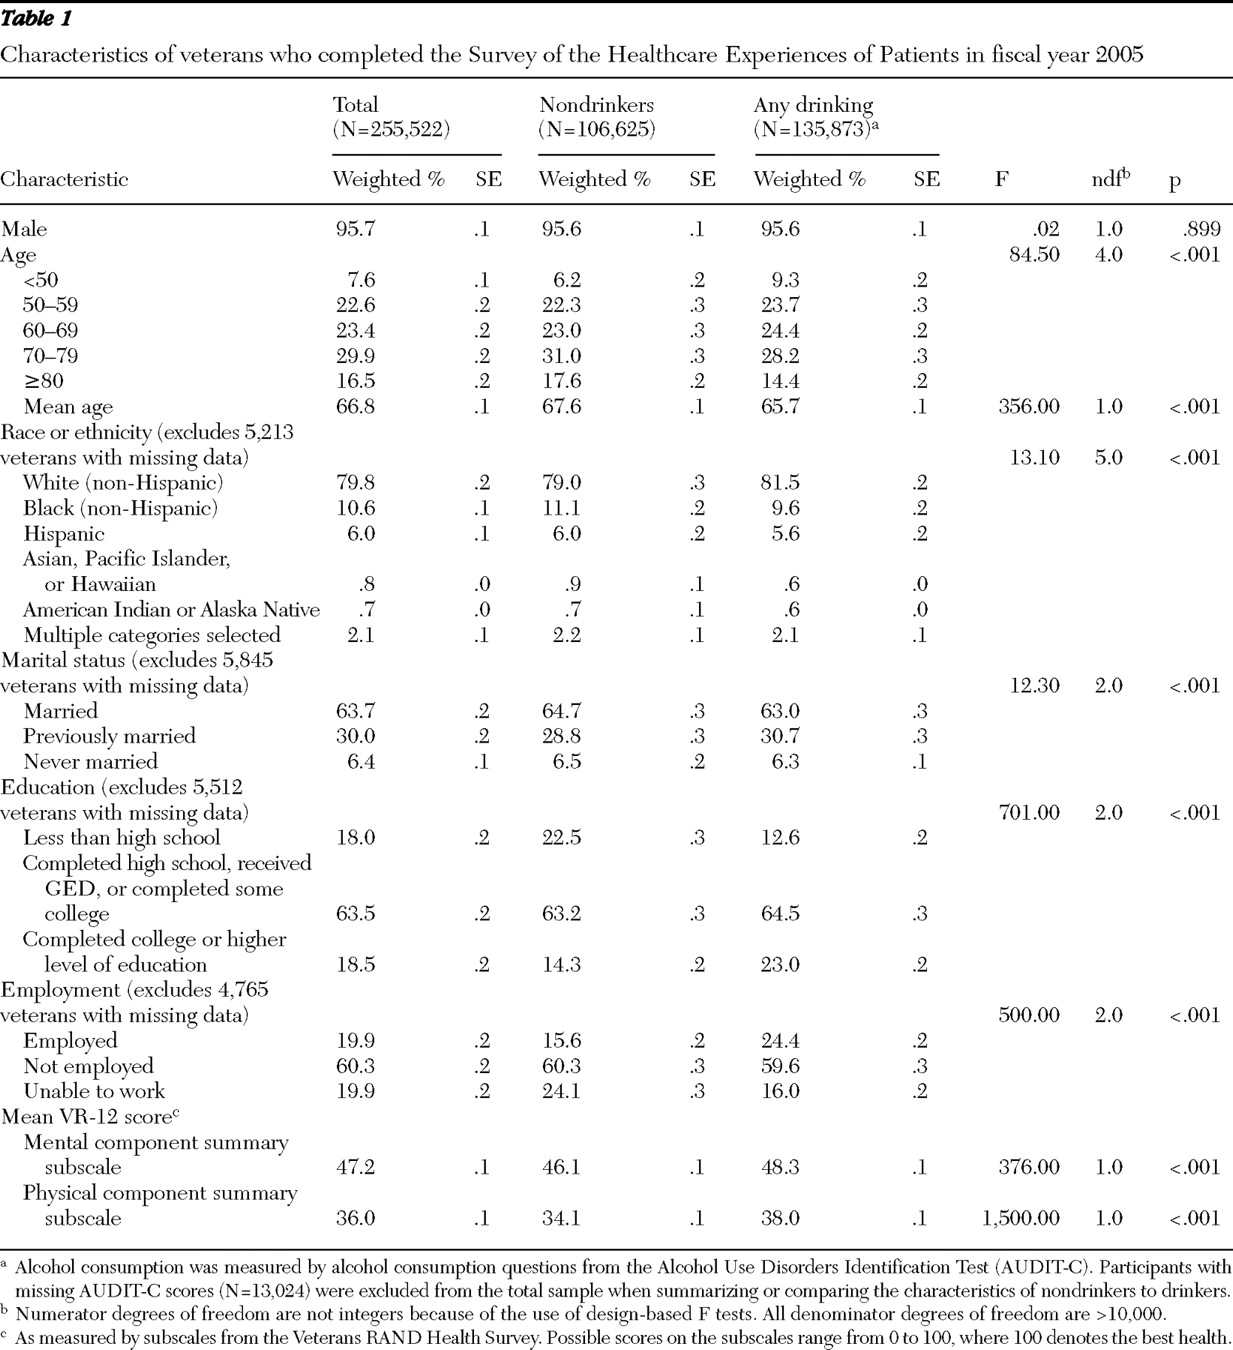
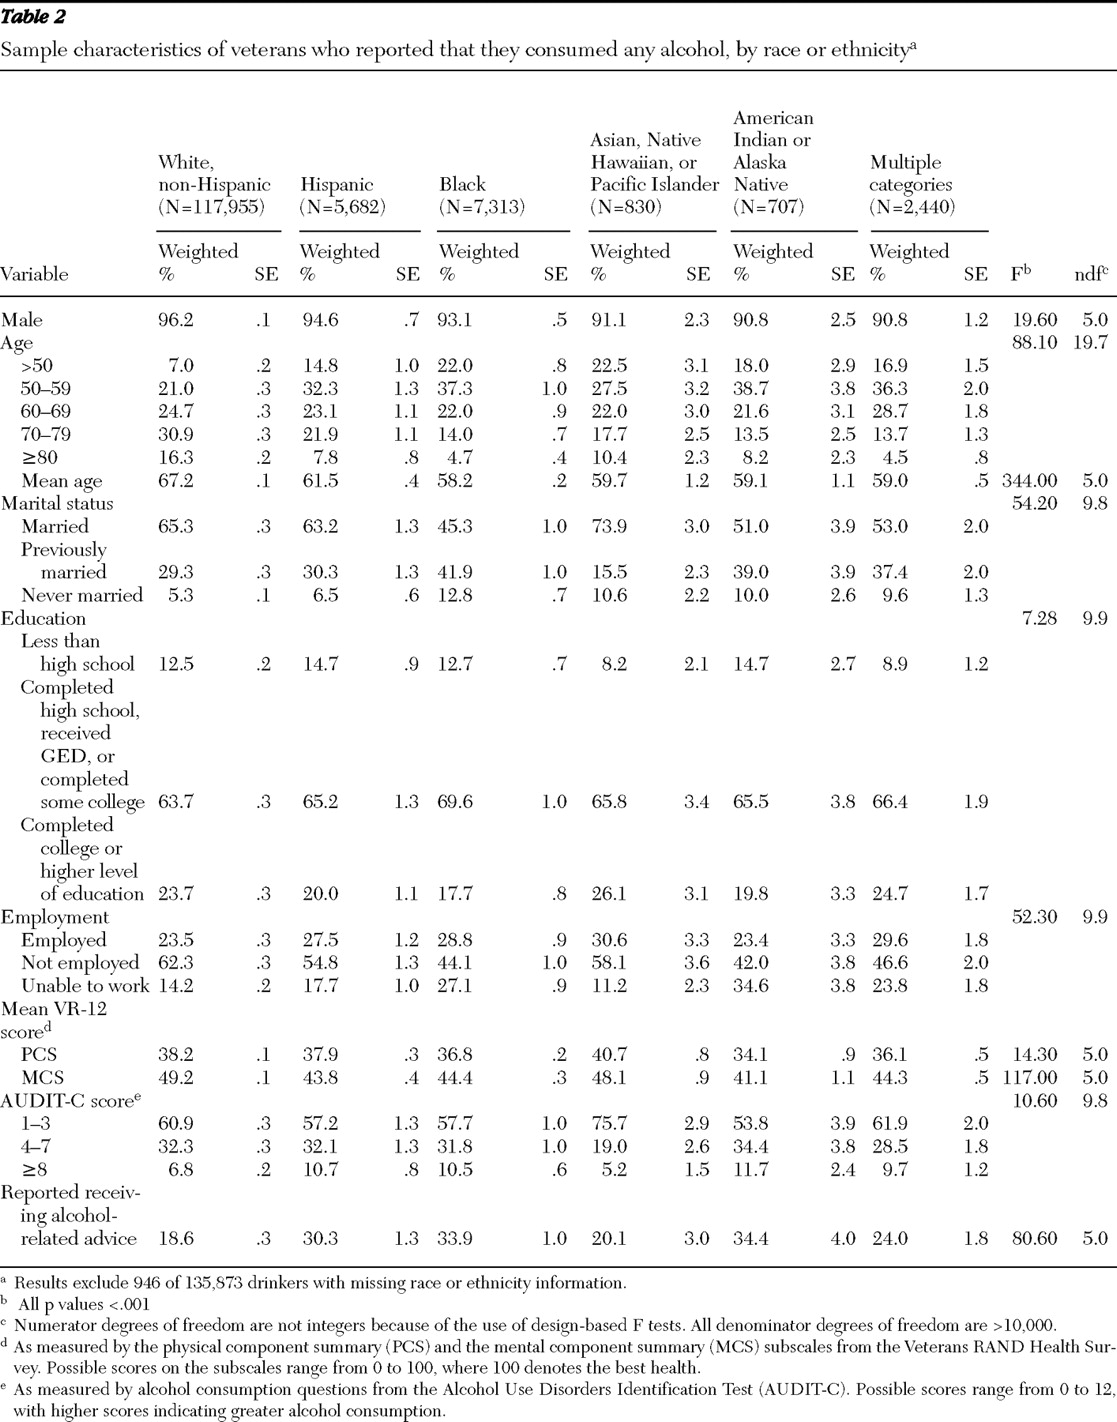
Demographic characteristics. To assess race and ethnicity, SHEP asked whether the respondent was of Hispanic or Latino origin or descent (yes or no) and then asked the participant to select all applicable race categories from the following: white (Caucasian); black or African American; Asian, Native Hawaiian, or Pacific Islander; and American Indian or Alaska Native. In the analyses, we categorized race and ethnicity as: Hispanic (zero or one race category selected); white (non-Hispanic); black (non-Hispanic); Asian, Native Hawaiian, or Pacific Islander (non-Hispanic); American Indian or Alaska Native (non-Hispanic); or multiple (two or more race categories selected). SHEP employment status response options were employed for wages, self-employed, unable to work, looking for work, and unemployed for more than one year, looking for work and unemployed for less than one year, homemaker, student, and retired. In analyses, employment status was categorized as employed (including employed for wages or self-employed), not employed (unemployed categories, homemaker, student, or retired), and unable to work.
SHEP marital status response options were married, divorced, separated, widowed, and never married. In analyses, these were categorized as married, previously married (divorced, separated, or widowed), or never married. Finally, SHEP respondents were asked to select the last year of school completed from the following options: did not complete high school, high school graduate or GED, some college, or college graduate or beyond. In analyses, these were categorized as less than high school, high school or GED completion or some college, or college graduate or higher.
Alcohol use and advice. Alcohol consumption was measured with the three alcohol consumption questions from the Alcohol Use Disorders Identification Test (AUDIT-C), a validated screen for alcohol misuse and for severity of misuse (
16,
17 ). Possible AUDIT-C scores range from 0 to 12, with higher scores indicating greater alcohol consumption, and with optimal cutoff scores for identification of alcohol misuse being ≥4 among men and ≥3 among women (
18,
19 ). The AUDIT-C has been validated for use among men and women and across racial and ethnic groups (
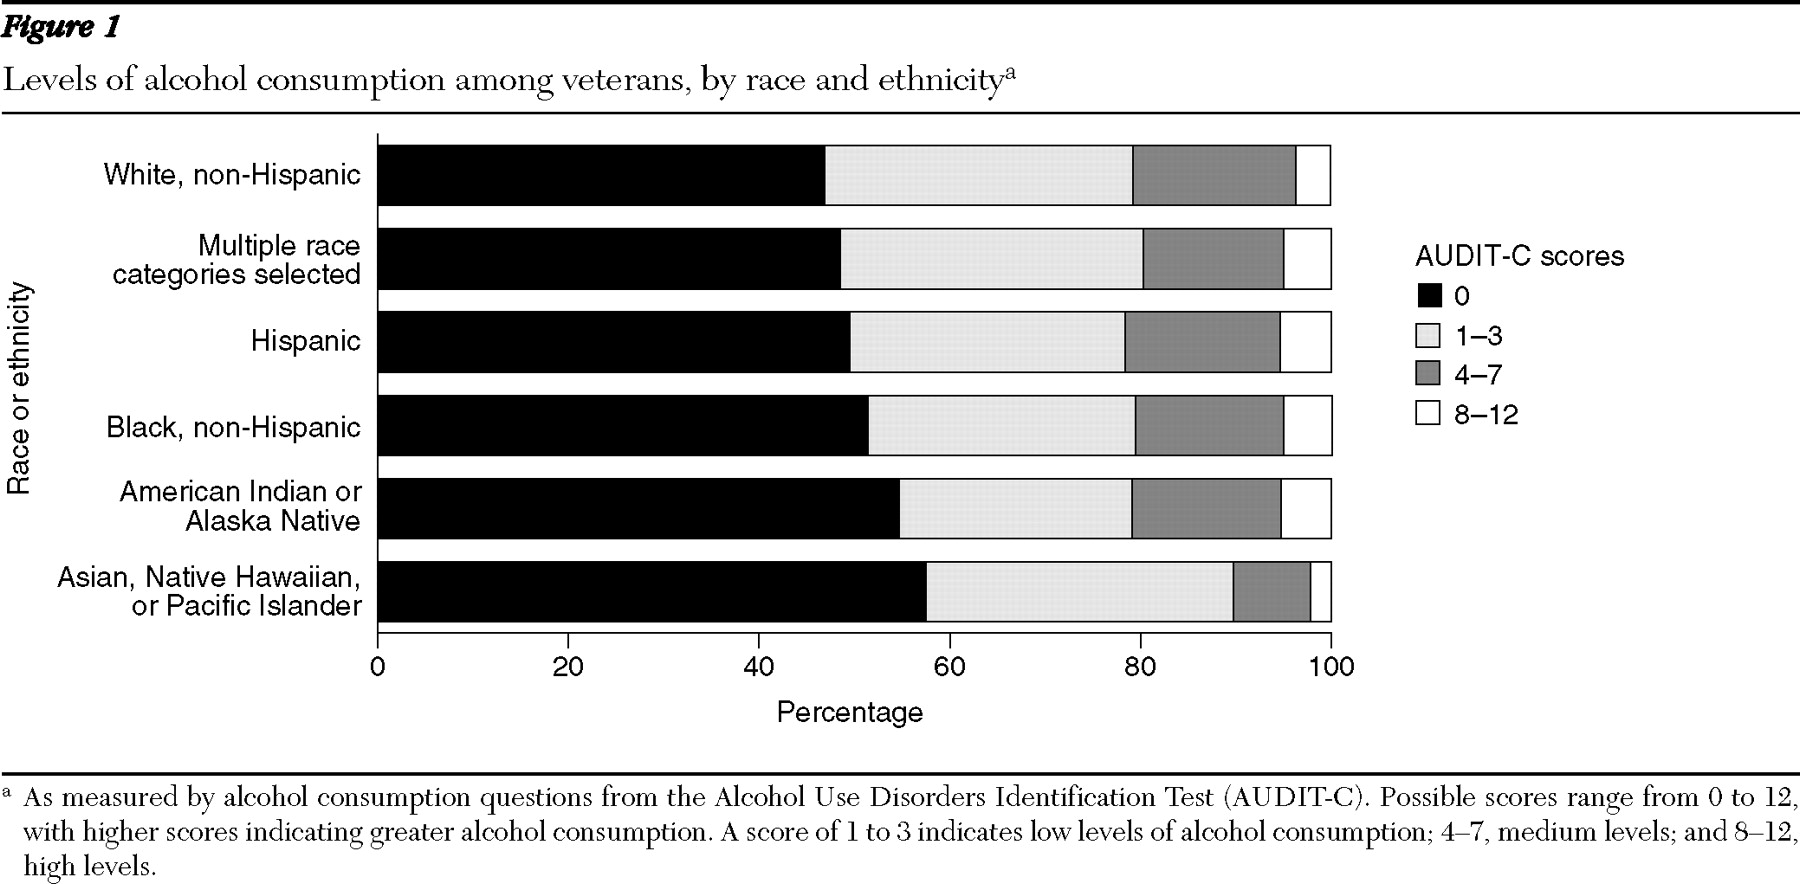
19 ). We used AUDIT-C scores to create four alcohol consumption categories: no consumption (nondrinkers) (score, 0), low levels of consumption (score, 1–3), medium levels (score, 4–7), and high levels (score, 8–12). Survey respondents who endorsed any drinking (score, >0) were asked to complete an additional SHEP item stating, "In the past 12 months has a VA doctor or other VA health care provider advised you about your drinking (to drink less or not to drink alcohol)?" (yes or no response). The answer to this item constituted the dependent variable in our regression models.
To examine the sensitivity of our models to alternative AUDIT-C classification schemes, in secondary analyses we categorized AUDIT-C scores into four categories for persons who consumed any alcohol—low levels of consumption (score, 1–3), medium levels (score, 4–6), medium-high levels (score, 7–9), and high levels (score, 10–12). We also created models that used the AUDIT-C score as a continuous variable.
Health status. Health status was measured with the Veterans RAND 12-Item Health Survey (VR-12), a validated measure of mental and physical health status (
20 ). The VR-12 was developed from the Veterans RAND 36-Item Health Survey (VR-36), which was developed from the 36-Item Short-Form Health Survey, Version 1 (developed by RAND as part of the Medical Outcomes Study) (
21 ). The VR-12 generates two component scores, a physical component summary score (PCS) and a mental component summary score (MCS) (
22 ). Possible PCS and MCS scores range from 0 to 100, where 100 denotes the best health. PCS and MCS scores were used as covariates in our analyses to adjust for independent effects of mental and physical health status on counseling rates. We included these measures as covariates because a previous study within the VA demonstrated associations between health problems and receiving alcohol counseling (
8 ).
Analysis
Using a method developed by Spiro and colleagues (
22 ), we used modified regression estimation to impute VR-12 PCS and MCS scores when data were missing. This resulted in 255,522 patients (97.5% of all respondents) having both PCS and MCS scores, which served as the sample for descriptive analyses. Regression models were constructed for patients who endorsed any drinking (N=135,873) and who also had complete data on demographic characteristics, AUDIT-C scores, and PCS and MCS scores (N=119,237). Rates of missing AUDIT-C scores and race or ethnicity data were approximately 5% and .7%, respectively.
All analyses were based on weighted data, with weights taking into account survey inclusion probability and differential distribution of age, sex, site volume, and clinic type. These weights are used by the VA Office of Quality and Performance to derive nationally representative estimates. Design-based F tests (which take into account survey design and sample weights) (
23 ) were used to compare subgroups. Because of the use of sample weights in analyses, numerator degrees of freedom are not integers. Denominator degrees of freedom are not reported; all are greater than 10,000.
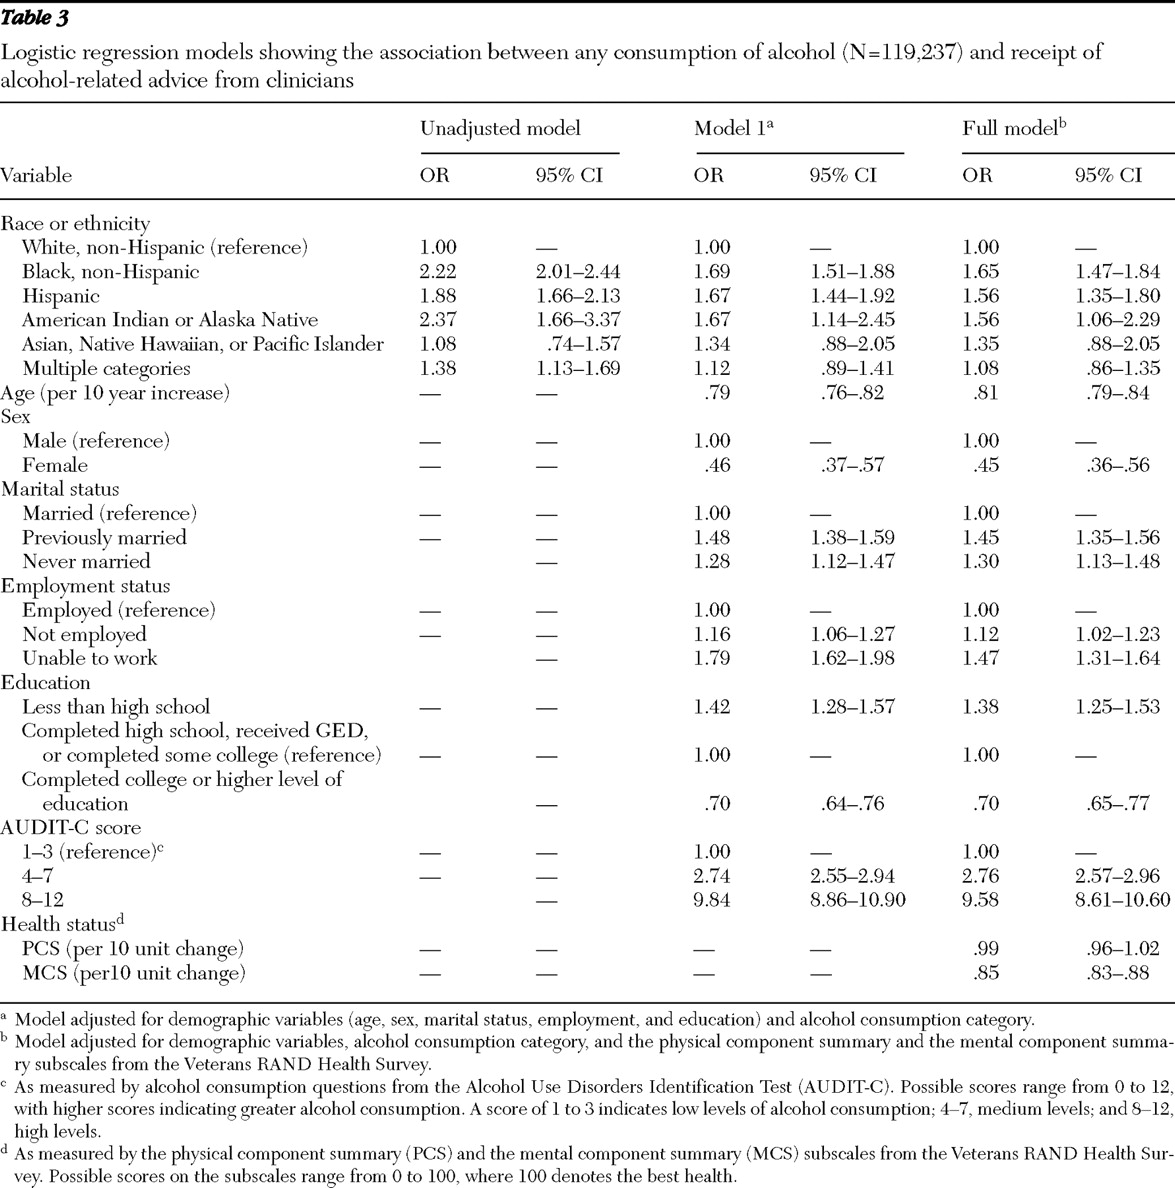
For our main analysis, using the sample of veterans who consumed any alcohol and who completed the item regarding receiving counseling for alcohol use, we constructed logistic regression models to characterize relationships between racial and ethnic categories and reports of receipt of counseling for alcohol use. In the first model, we included demographic variables (age, sex, education level, marital status, and employment status) and alcohol consumption category. In the second (full) model, we included the above variables and added physical and mental health status (MCS and PCS scores).
In secondary analyses, the above procedures were followed using the two alternative AUDIT-C classification schemes. We also constructed models for the sample of patients with AUDIT-C scores ≥4, because these patients are considered to have positive alcohol misuse screens (
18,
19 ), which is a strong indication to offer alcohol-related advice (
4 ). Analyses were conducted using R version 2.6.1 in combination with the R "survey" package (
24,
25,
26 ).
