White matter hyperintensities—areas of increased signal intensity in the periventricular and deep white matter seen best on T
2-weighted magnetic resonance images—have been studied in conjunction with many psychiatric disorders. Studies have found a higher rate and severity of white matter hyperintensities in patients with unipolar depression, as well as those with bipolar disorder, in comparison with individuals who were not ill
(1). Specifically, increased white matter hyperintensities in groups of elderly subjects with depression have been a well-replicated finding
(2–
7); this result has also been reported in studies that included younger subjects
(8,
9), although negative findings with younger groups have also been reported
(10,
11). As a result of these studies, a “vascular depression” hypothesis has been raised
(12,
13). This hypothesis states that depression (mainly late-onset depression) can be caused by cerebrovascular disease (in the form of white matter hyperintensities) affecting white matter pathways and subcortical structures involved in mood regulation. Supporting this hypothesis, white matter hyperintensities are highly correlated with increasing age and cerebrovascular disease risk factors—hypertension, diabetes, history of myocardial infarction or coronary artery disease, and smoking—in both depressed
(14) and nondepressed
(15) populations. Increased white matter hyperintensities are more associated with late onset of depression
(2,
4,
8). In addition, literature on poststroke patients with depression
(16) suggests that certain lesion locations can predispose to depression; similar findings have been noted in a preliminary study of white matter hyperintensity location
(17). Thus, the higher rates of white matter hyperintensities in depressed populations may be a reflection of a greater prevalence of cerebrovascular disease risk factors in the depressed groups.
The converse—that depression itself could lead to white matter hyperintensities by predisposing to cerebrovascular disease—should be considered
(5). Of three studies that matched depressed subjects to comparison subjects according to equal cerebrovascular disease risk factors
(6,
18,
19), two
(6,
18) still showed increased white matter hyperintensities in the depressed group. In addition, a study of depressed patients aged 50 years or older
(20) showed no difference in cerebrovascular disease risk factors from those of nondepressed comparison subjects. Further, that study found no association between cerebrovascular disease risk factors and age at onset of depression. Also, there is evidence that depression increases the risk of cardiovascular death
(21) and stroke mortality
(22,
23) in subjects with preexisting risk factors, suggesting an interaction between depression and cardiovascular risk factors. This interaction could be a direct neurohormonal effect of the depressed state or a result of poorer compliance with medical care among depressed individuals. It is also possible that depression, independent of cerebrovascular disease risk factors, increases the risk of white matter hyperintensities as well as cardiovascular or cerebrovascular death. However, since the previously mentioned neuroimaging and epidemiological studies did not exclude subjects with cerebrovascular disease risk factors, a contribution from depression independent of these risk factors cannot be identified.
The importance of studying white matter hyperintensities in depression is suggested by reports that show poorer outcomes and poorer response to antidepressants
(24,
25), implying that these lesions portend a more severe illness. However, white matter hyperintensities have also been noted to occur at rates of up to 60% in healthy elderly patients
(26), in whom their significance is unknown
(27). While most white matter hyperintensities are thought to reflect small infarcts
(28), other pathology has been suggested
(29,
30). Most prior studies have used a categorical scale of the severity of white matter hyperintensities described by Fazekas et al.
(26), which would be unlikely to differentiate individual lesions of different pathophysiologic origin. To further examine these questions, we studied depressed subjects in remission and matched comparison subjects, screened to exclude cerebrovascular disease risk factors and serious medical illness, by using a volumetric technique of measuring individual lesions on magnetic resonance imaging (MRI) scans.
METHOD
The study subjects were recruited from the Memory and Aging Project and the outpatient psychiatry service at the Washington University School of Medicine, St. Louis; all gave written informed consent. They ranged in age from 24 to 86 years (mean=53 years) and were right-handed. All of the subjects were female, in order to decrease the likelihood of hypertension and occult cardiovascular disease. Comparison subjects were matched to the subjects with a history of depression on age and level of education, and the groups were matched overall on height, a predictor of brain size
(31). Potential subjects were screened by a questionnaire, medical history, review of medical records, and a physical examination. They were excluded if they had medical conditions that might affect the central nervous system (CNS), such as a current or past neurological disorder (or any focal neurologic signs or symptoms), head trauma, myocardial infarction or ischemia, uncontrolled hypertension, Cushing"s disease, steroid use, drug/alcohol abuse, and diabetes. Persons who had received more than three courses of ECT were also excluded. All subjects had documented normal blood pressure.
As described previously
(32), the subjects were assessed clinically by a psychiatrist (Y.I.S.) using the Diagnostic Interview for Genetic Studies to diagnose prior unipolar major depressive episodes and to exclude other psychiatric conditions. Persons in an acute depressive episode (within the past 6 months) were excluded to eliminate potential confounding factors related to effects of hypercortisolemia on MRI volume. Subjects with residual symptoms who were judged to be at their optimal level of recovery were included.
MRI scans were performed on a Magnetom SP-4000 1.5-T imaging system and a standard Siemens 30-cm circularly polarized head coil. Scanning parameters for T
1-weighted scans were TR=10 msec, TE=4 msec, inversion time=300 msec, and flip angle=8. Dual spin-echo sequences were acquired with scanning parameters of TR=3220 msec and TE=20 msec and TE=90 msec for proton-density and T
2-weighted scans, respectively. Image processing was done with the use of ANALYZE software
(33) as described elsewhere
(32).
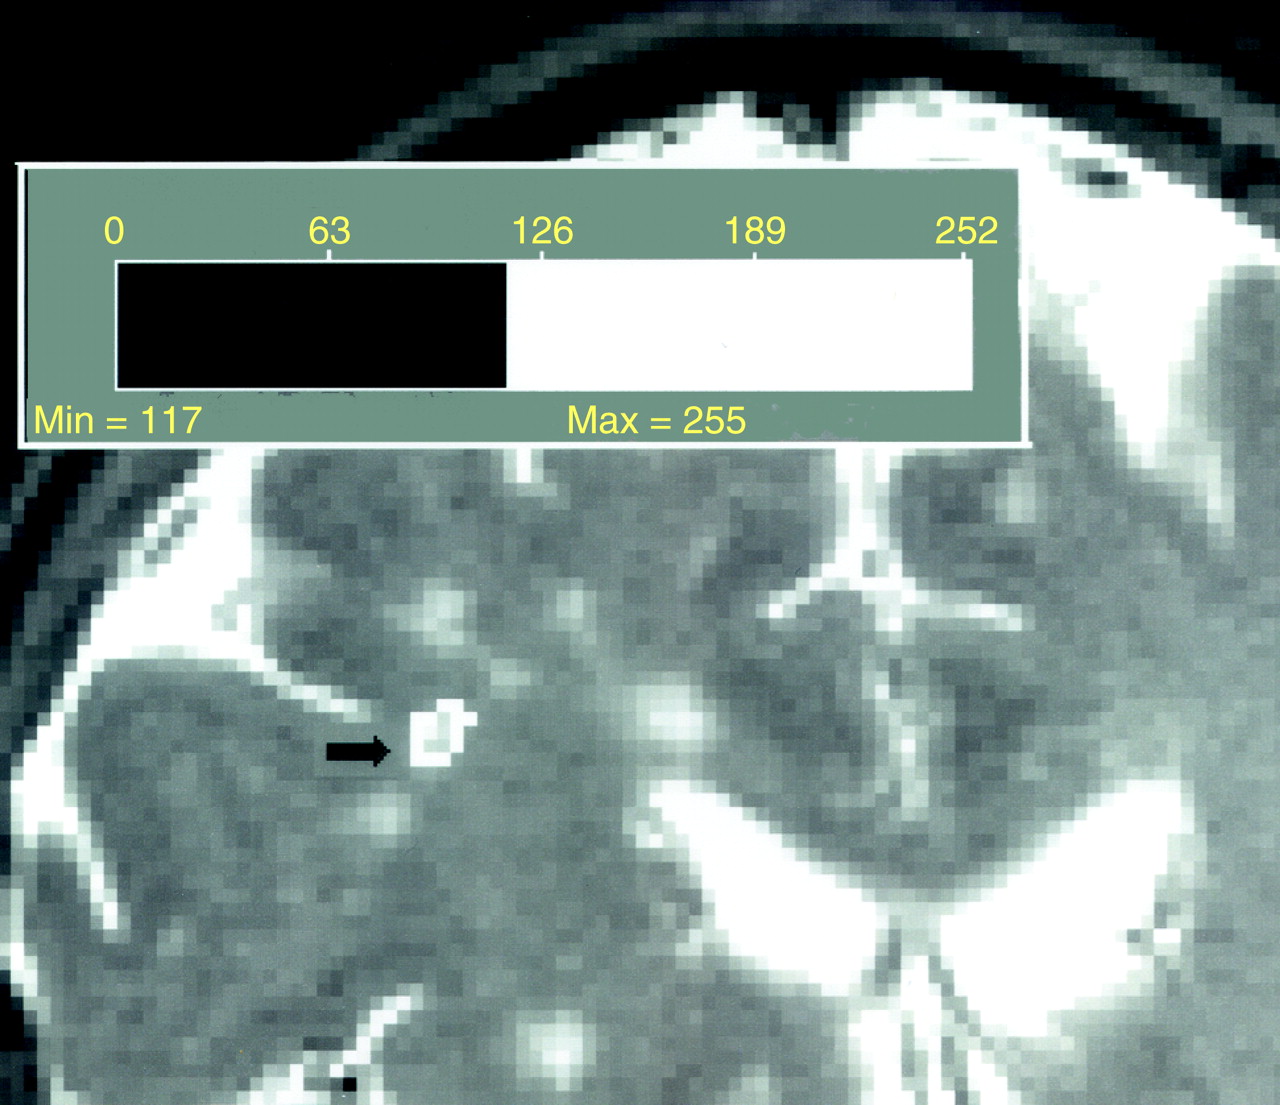
Scans were viewed by a neuroradiologist (D.C.) to determine lesions. Lesions seen as hyperintense in 5-mm coronal sections in both proton-density and T2-weighted images were counted; lesions that were isointense with CSF on proton density were excluded. The area of each lesion in a particular slice was determined as follows. For each subject, all pixels were plotted on a graph by intensity. The resultant curve shows a large peak representing the sum of pixels in the gray and white matter. The threshold for lesions was set as 2 SD above the peak. The area of each lesion was automatically calculated by computer, as shown in figure 1, with manual editing when needed. Two raters (Y.I.S. and E.L.), blind to subject identity, measured the volume of white matter hyperintensities twice for each subject. Intrarater and interrater reliabilities were determined in 20 cases and were 0.99 each. In addition, periventricular and deep white matter hyperintensities were measured by the scale of Fazekas et al. (ratings of 0–3). Interrater reliabilities were 0.90 for periventricular and 0.91 for deep white matter hyperintensities.
Data were compiled separately for total number and volume of white matter hyperintensities and total number and volume of basal ganglia lesions; total lesion (white matter and subcortical gray matter) number and volume were also calculated. Because data were not normally distributed, the Wilcoxon signed ranks test was used to compare the depressed and comparison groups on all MRI measures except the scale of Fazekas et al., for which paired t tests were used. To further test the effect of depression on lesions, multivariate regression analyses were run. To achieve linearity of the regression function, stabilize the variance of the dependent variable, and achieve normality of the residuals, we regressed the logarithmic transformation of the dependent variable (natural log [lesions+1]) on age, age squared, and depression. We found that there was a significant age-by-depression interaction (calculated as age by depression status [1=absent, 2=present]) and therefore included it in the model. This yielded the best fit; the model was also tested with two outliers removed, which improved the R2 value but did not change the significance of the results. Separate analyses were run for total number of lesions, number of small lesions (defined as diameter ≤0.4 cm), and number of large lesions (diameter >0.4 cm).
RESULTS
The subjects with a history of depression and the comparison subjects (N=24 in each group) did not differ in age (mean=52.8 years in each group), race (96% white and 4% black in each group), height (64 inches in each group), or education (16.3 years in each group).
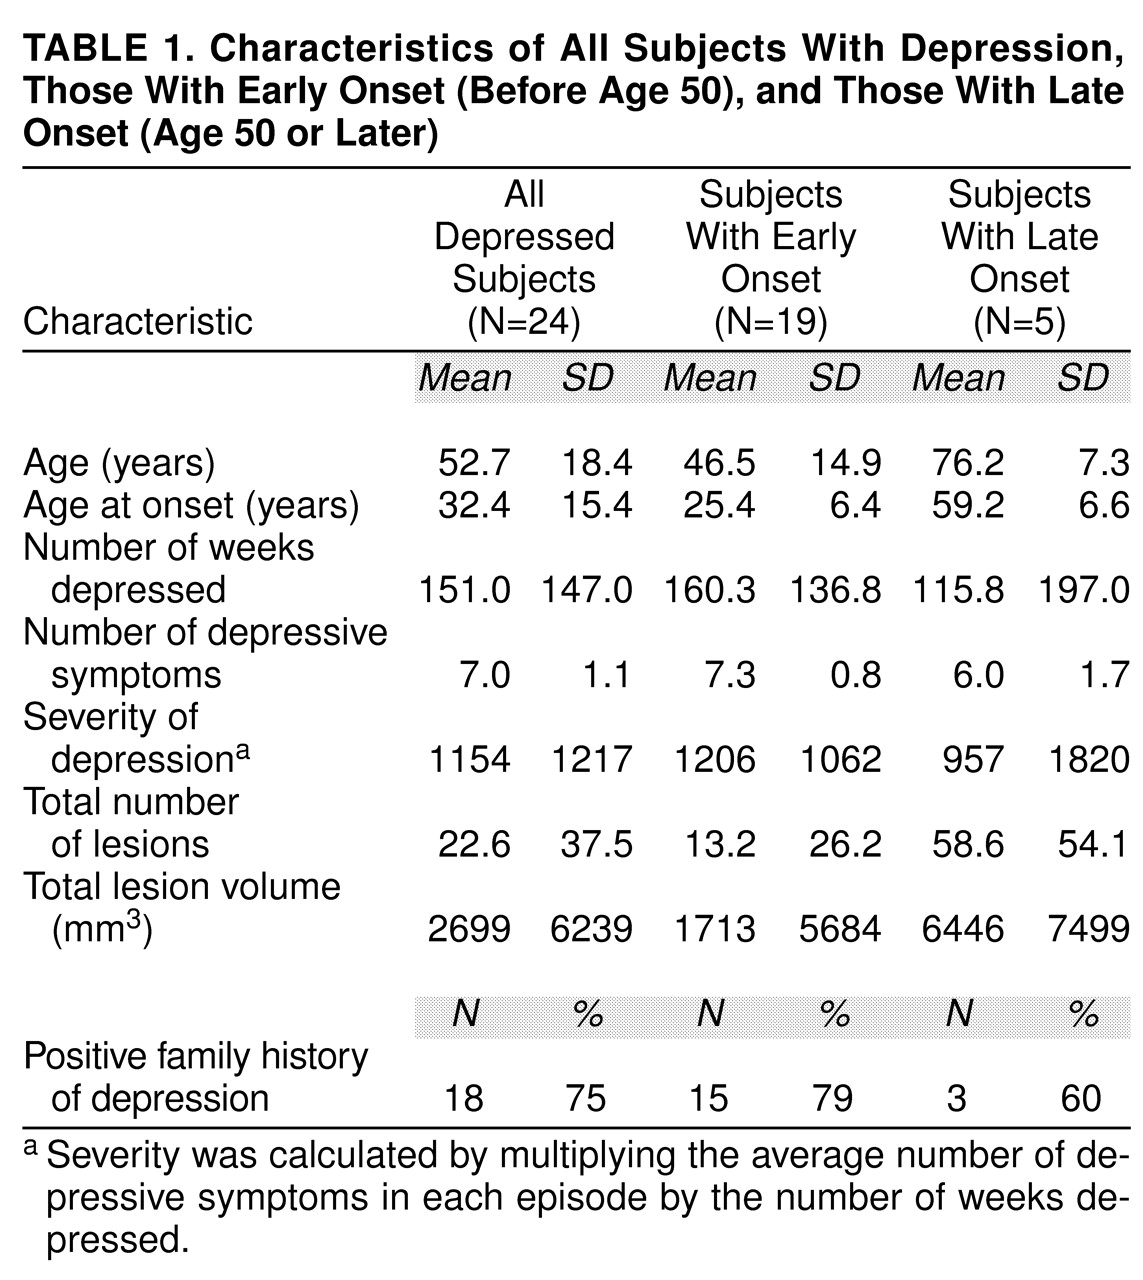
Table 1 shows measures of severity of depression (average number of DSM-IV depressive symptoms in each episode out of nine possible, number of weeks depressed, and a severity multiplier of these), age at onset, and family history. Five of the 24 subjects with a history of depression had a late onset, defined as onset of the first depressive episode at age 50 or later.
Table 1 also shows data on the measures mentioned above for the depressed group divided according to early and late onset. Of the 24 subjects with a history of depression, 20 had a history of suicidal ideation, and three had made prior suicide attempts. Twelve had had prior hospitalizations for depression, and five had been treated with ECT. Sixteen were currently taking antidepressant medication.
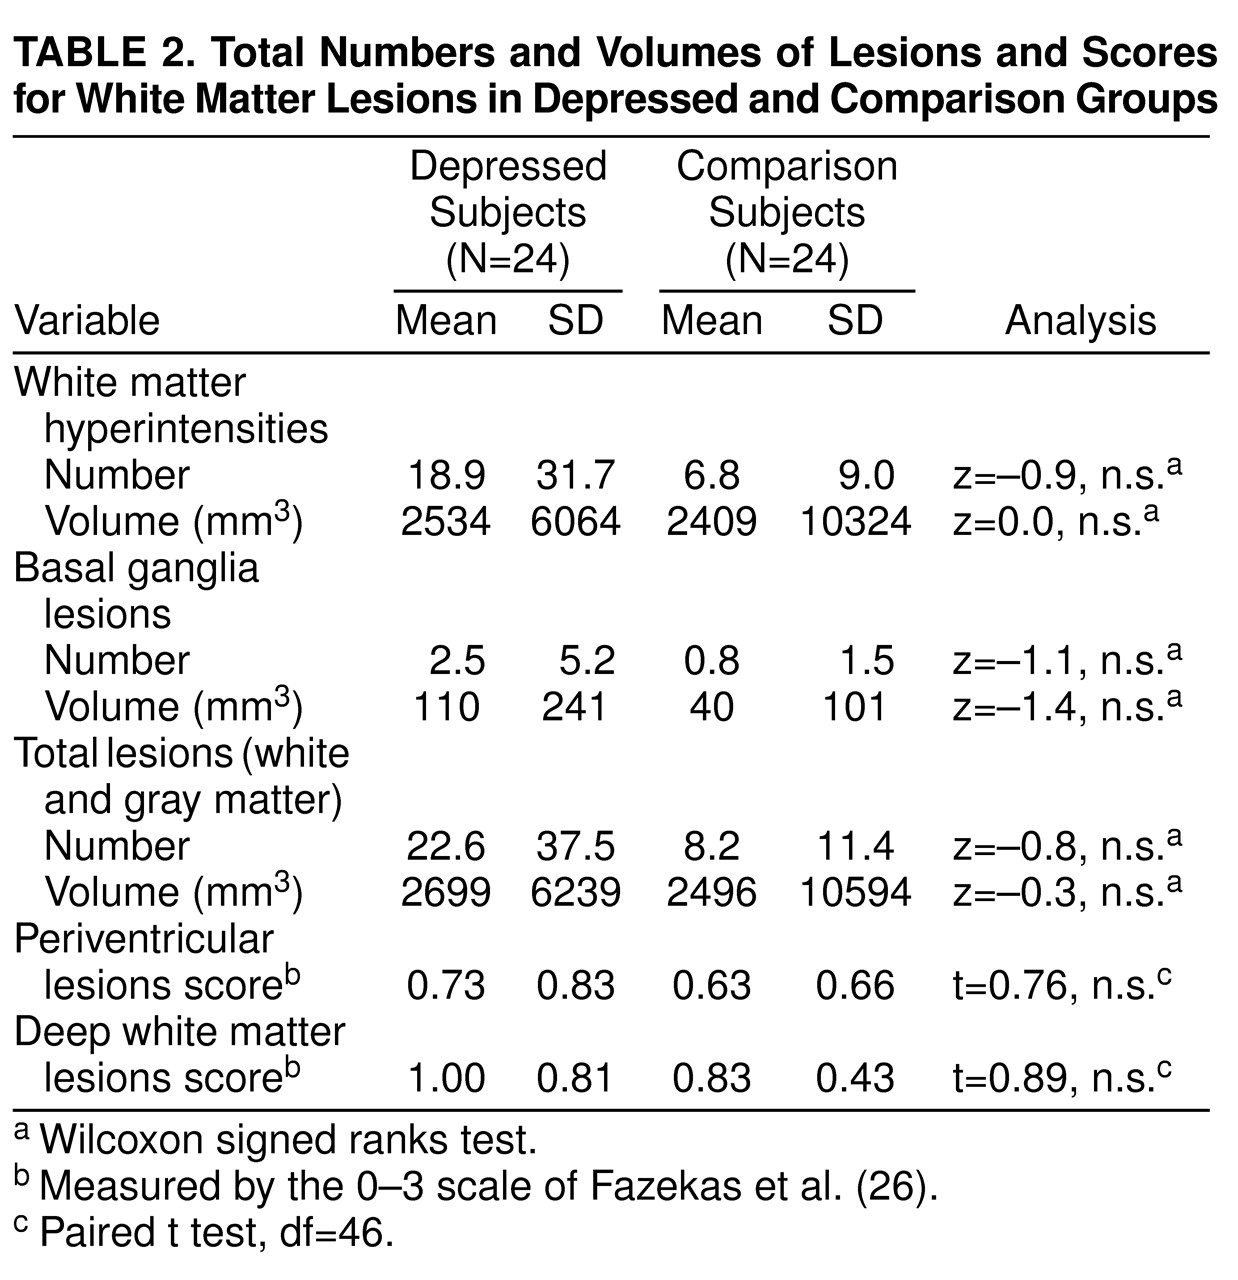
Table 2 shows that the depressed subjects did not differ from the comparison subjects in total volume or number of white matter hyperintensities, basal ganglia lesions, or total lesions. In addition, it shows that the two groups did not differ in periventricular or deep white matter lesion scores on the scale of Fazekas et al. Further analyses revealed no differences in these lesion measures between the subjects with a history of depression and the comparison subjects after we removed the data on the 12 subjects with a history of controlled hypertension or the data on the 30 subjects who had ever smoked.
Table 1 shows differences in total lesion number and volume between subjects with early- and late-onset depression.
One comparison subject had large lesion volumes, accounting for 85% of all lesion volume in the comparison group. Therefore, an analysis was performed in which data on this subject and her depressed matching subject were removed; this showed no significant differences between groups in any lesion measures. Because of reports that white matter hyperintensities may be more prevalent in late-onset depression, we did a further analysis with data on the five subjects with late onset removed. Again there was no difference in the lesion measures.
Table 3 shows the results of a number of multivariate regression analyses. Age and depression status were significant predictors of total lesion number, indicating that lesions increased with age and were also more numerous in depressed individuals. In addition, the interaction between age and depression was significant in the model, giving evidence for a synergism between age and depression in causing lesions. The same analysis was run for small lesions (defined as diameter ≤0.4 cm), showing similar statistical significance for age, depression status, and the age-by-depression interaction. However, when the analysis was run for large lesions (defined as diameter >0.4 cm), there was no significant finding with respect to depression status or the age-by-depression interaction.
DISCUSSION
This study found no gross differences in lesion number or total volume between women with a history of recurrent major depression of moderate severity and case-matched comparison subjects, screened to exclude cerebrovascular disease risk factors and comorbid medical illnesses. This suggests that the white matter hyperintensities in depressed patients in previous studies were primarily a reflection of cerebrovascular disease rather than a result of depressive episodes. We found a correlation between age and lesion number and volume, consistent with evidence of increasing white matter hyperintensities with age. However, we found a correlation between the number of small lesions and depression but not between the number of larger ones and depression. We also found a correlation between the number of small lesions and an age-by-depression interaction variable. Regression analysis indicated that the correlation of lesions with depression and age occurred only in the case of small lesions, while correlation of lesions with age but not depression was seen for large lesions. This suggests a causal role for depression, independent of cerebrovascular disease risk factors, in certain types of white matter lesions. A possible explanation for this finding is a different etiology in depressed subjects for lesions ≤0.4 cm and lesions >0.4 cm in diameter. The typical pathologic entities that appear as focal white matter lesions on MRI are enlarged Virchow-Robin spaces, lacunar infarcts, and focal edema
(34).
Table 4 provides a description of MRI characteristics of these lesions.
Virchow-Robin spaces are subarachnoid extensions along penetrating cortical arteries and deeper arteries in the anterior perforated substance and basal ganglia; they contain blood vessels that become more tortuous during aging. Most of these widened spaces are between 0.2 and 0.5 cm in diameter
(35). In vivo, these spaces presumably contain fluid, and their MRI characteristics are similar to those of old cystic lacunar infarcts that also have a fluid-filled center (
Table 4). Virchow-Robin spaces can be distinguished from lacunar infarcts by differing characteristics on MRI
(36,
37), as
Table 4 shows. In our study, white matter lesions were hyperintense on both sequences, which should exclude Virchow-Robin spaces.
Focal edema is one etiology for periventricular “caps” seen on MRI; it is seen in deep areas as well. The periventricular lesions involve partial loss of ependymal lining cells and myelin
(38). Edema has been postulated as a mechanism in studies that compared postmortem MRI with histology of white matter lesions that were not infarction
(39,
40).
Lacunar infarcts are small, deep cerebral infarcts in white matter and central gray matter nuclei
(41). They are due to occlusion of penetrating branches of the large cerebral arteries and are usually associated with hypertension. They generally range in size from 0.3 cm to 1.5 cm in diameter. Histologically, the involved tissue is necrotic, surrounded by dense astrocytic gliosis. Lacunar lesions may be clinically silent unless a critical area of the brain, such as the internal capsule, is involved. Their MRI characteristics are consistent with the lesions reported in our study. Thus, the greater number of small lesions in the subjects with a history of depression were likely small infarcts or possibly foci of edema.
A mechanism by which apparently healthy elderly depressed subjects could have more small infarcts is by increases in platelet activation. Depressed subjects have been shown to have greater baseline platelet activation and responsiveness than comparison subjects
(42). Serotonin (5-HT) secretion by platelets produces aggregation, and there is a substantial literature indicating disturbed 5-HT function in platelets as well as the CNS of depressed subjects
(43). Increases in platelet 5-HT
2 receptors have been demonstrated in depression
(44), rendering depressed patients more susceptible to atherosclerosis, thrombosis, and vasoconstriction. In the present study, it may be that depression produced a higher propensity for platelet activation, and therefore subjects with a history of recurrent depression still had evidence of more lesions, despite the exclusion of other cerebrovascular disease risk factors.
A methodological advantage of this study is the use of semiautomatic quantitative techniques, yielding measures of total number and total volume of lesions, similar to methods quantifying changes in the volume of white matter in patients with multiple sclerosis
(45). Quantitative measures of individual lesions should also be more sensitive than qualitative measures in detecting and displaying the full range of lesions; hence, these data could be subdivided into those for small and large lesions, showing a correlation that could not be seen with the categorical scale. The automatic thresholding technique was used in order to avoid reliability problems resulting from an operator-determined lesion threshold. Previous work has shown that a change of 1%–3% in choice of threshold can lead to changes of 15%–65% in computed lesion load
(45). As previously shown
(46), the semiautomated methods used in the current study yielded high intrarater and interrater reliability, higher than the same raters’ reliability when the scale of Fazekas et al. was used.
A possible criticism is that subjects with a history of treated hypertension were included, introducing a possible cerebrovascular disease risk factor. We included these subjects because of literature suggesting that treated hypertensive subjects do not have increased white matter hyperintensities
(47); in the present study, all subjects had documented normal blood pressure. An analysis in which data on the subjects with treated hypertension were removed found no difference between the groups in the number or volume of any lesions. Another possible criticism is that some subjects were former smokers. These subjects were not current smokers, and the groups were matched for amount of past cigarette use. An analysis with data on these subjects removed found no differences between the groups in the number or volume of any lesions.
In summary, our technique using automated volumetric analysis has higher reliability than techniques using qualitative or categorical measures and may have greater sensitivity. Because we studied medically healthy subjects without major cerebrovascular disease risk factors, our data do not show differences in white matter hyperintensities between depressed and nondepressed subjects, as some previous studies have shown. However, the correlation of age and depression, as well as an age-by-depression interaction, with the number of small lesions indicates an effect of depression on brain pathology independent of cerebrovascular disease risk factors. Further study will be required to determine the pathways by which depression may lead to white matter hyperintensities, both by interaction with existing cerebrovascular disease risk factors and as a possible risk factor itself. Ultimately, correlation with postmortem specimens is needed to determine what specific brain pathology is related to depression.


