Recent anatomical and functional imaging data
(1) suggest that the cerebellum plays a role in higher cognitive functions and, therefore, deserves further investigation in schizophrenia. Anatomically, the cerebellar hemispheres are connected to cortical association areas subserving cognition, and the vermis is connected to limbic structures, including the hippocampus and amygdala
(2). Functionally, language processing and verbal working memory tasks activate the right inferior cerebellar hemisphere
(3).
Studies using magnetic resonance imaging (MRI) in schizophrenia have primarily focused on one midsagittal slice of the vermian area and have reported mixed results (4), although one study in childhood-onset schizophrenia reported smaller volumes in the total vermis and inferior posterior lobe
(4). In autism, smaller midsagittal areas in vermis lobules VI–VII, with some instances of greater areas, have been reported
(5). To our knowledge, no volumetric study of vermian gray and white matter in schizophrenia has been published, although one study reported no difference for overall cerebellar volume
(6).
We used MRI to measure whole cerebellar, hemispheric, and vermian gray and white matter volumes in patients with schizophrenia and normal comparison subjects. We hypothesized that in schizophrenia, as in autism, vermian lobules VI–VII would be smaller in size and there would be right hemisphere tissue loss, reflecting its role in language and memory processes.
METHOD
Fifteen patients with chronic schizophrenia diagnosed according to DSM-III-R and 15 normal comparison subjects underwent magnetic resonance (MR) scanning. All subjects, obtained from a previous study
(7), were right-handed, and all were men. Patients with schizophrenia and comparison subjects were chosen to be similar in age (mean=37.6, SD=9.3, and mean=37.9, SD=9.8, respectively), handedness, and parental socioeconomic status. The patients with schizophrenia were assessed by using the Scale for the Assessment of Positive Symptoms (SAPS) and the Scale for the Assessment of Negative Symptoms (SANS) as well as a standard neuropsychological battery (available on request). All subjects provided written informed consent.
The MR images were acquired by using a 1.5-T General Electric Scanner (GE Medical Systems, Milwaukee). To measure specific cerebellar regions of interest, a three-dimensional Fourier transform spoiled gradient-recalled acquisition sequence was employed, yielding a coronal series of contiguous 1.5-mm images. To measure total intracranial contents, a double-echo spin-echo sequence was employed, yielding an axial series of contiguous 3-mm double-echo (proton density and T
2-weighted) images. To process regions of interest, we segmented the cerebellum into gray and white matter tissue classes using an iterative expectation-maximization segmentation program based on cerebellar tissue seed points
(8). The image processing steps used to compute intracranial contents as well as the pulse sequence parameters have been described elsewhere
(7).
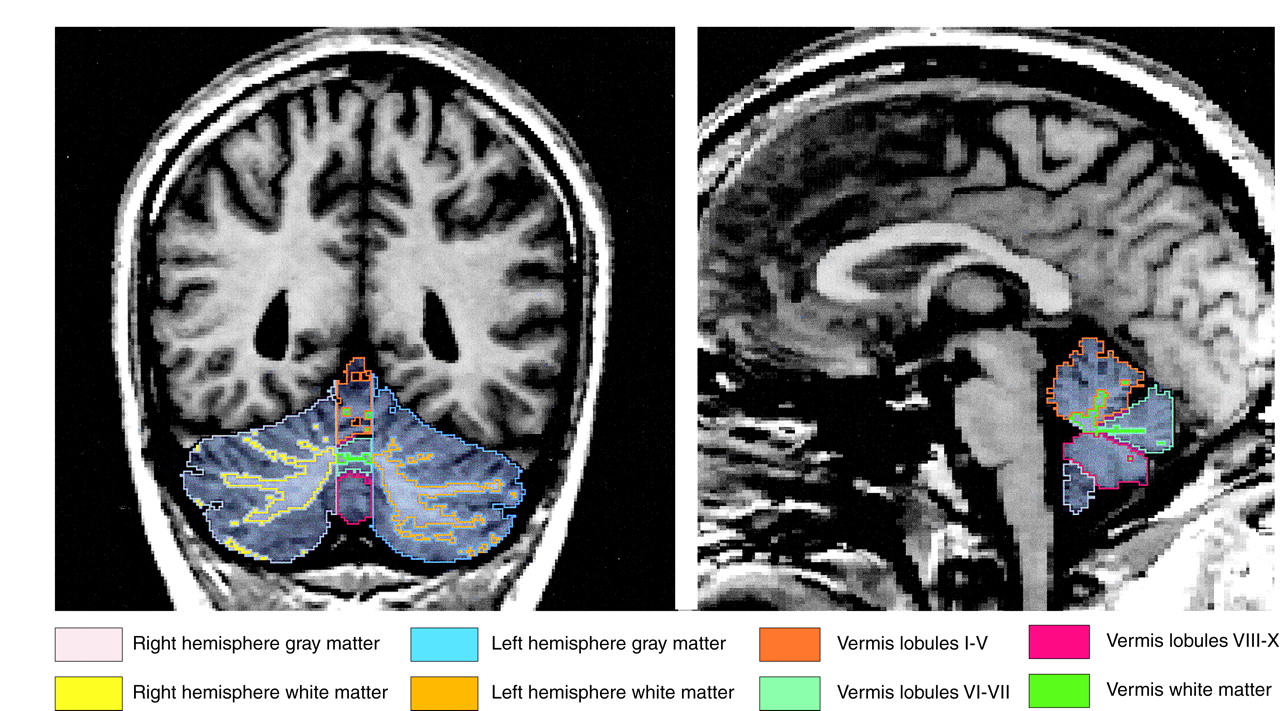
A full description of our cerebellar region of interest anatomical landmarks is available on request. Briefly, using three planes and manual tracing, we separated the cerebellum from the brainstem and cortex and delineated the vermis, which, in turn, defined the left and right gray and white matter hemisphere regions of interest (
Figure 1). Interrater reliability was computed for the regions of interest of three subjects by three raters (J.J.L., C.P., and Y.H.). Intraclass correlations were 0.99 for the whole cerebellum, hemispheric left and right gray and white matter, total vermian gray and white matter, and vermian lobules I–V; 0.90 for lobules VI–VII; and 0.97 for lobules VIII–X.
To correct for head size, region of interest statistical analyses used relative brain volumes (100×absolute volumes/[total intracranial volume]). We used multivariate analysis of covariance (MANCOVA), covarying for age, to evaluate midline vermian region of interest volumes with group as the between-subjects factor and tissue type (gray matter or white matter) as the dependent variable. Follow-up univariate analysis of covariance (ANCOVA) was used for relative means when a main effect for diagnosis was found. A repeated measures MANCOVA, covarying for age, was used to evaluate group volumetric differences in lateral structures. Two-tailed nonparametric Spearman’s rho (rs) tests were used for all correlations. Last, an asymmetry quotient for cerebellar hemisphere volumes was calculated with the following formula: (left–right)/(left+right); a positive value indicated a larger left-sided structure. Mean difference was then tested by using ANCOVA covarying for age.
RESULTS
Whole cerebellar and cerebellar left and right hemispheric gray and white matter volumes did not differ between groups. Analysis of asymmetry quotients for combined gray and white matter hemispheric volume revealed a trend for more left-greater-than-right hemispheric volume asymmetry in patients with schizophrenia (mean=0.0078, SD=0.01) than comparison subjects (mean=0.0017, SD=0.01) (F=3.30, df=1, 27, p=0.08). This was similarly true for gray matter (mean=0.0103, SD=0.02, versus mean=0.0029, SD=0.01) (F=2.85, df=1, 27, p=0.10) but not for white matter (p=0.87).
MANCOVA for vermian tissue revealed a significant main effect for group (F=3.84, df=1, 27, p=0.04). Follow-up ANCOVA revealed a significant group difference for vermian white matter (F=7.38, df=1, 27, p=0.01) but not gray matter (F=0.86, df=1, 27, p=0.36). Parcellated gray matter vermian lobule regions did not differ between groups. (Testing absolute volumes, covarying for intracranial contents and age, did not change our results.)
We restricted correlational analyses to vermian white matter because it discriminated groups best. Vermian white matter volume correlated positively and significantly with global SAPS score (rs=0.55, N=15, p=0.03) and with the SAPS positive formal thought disorder subscale score (rs=0.55, N=15, p=0.03), but not with SANS scores. This variable also correlated significantly with poorer immediate verbal logical memory (rs=–0.54, N=15, p=0.04), as assessed by the Wechsler Memory Scale—Revised. It did not correlate with indirect measures of total lifetime neuroleptic drug exposure (in chlorpromazine-equivalent doses), duration of illness or hospitalization, or age at onset (N=14).
DISCUSSION
Our finding of vermian enlargement in schizophrenia, driven primarily by white matter volume, was made possible by careful definition of the lateral extent of the vermis and gray and white matter parcellation. This finding may represent a neurodevelopmental abnormality, such as a failure of axonal and synaptic pruning, or failure of apoptosis
(10). A possible alternative explanation is a neuroleptic medication effect. There are reports of axonal sprouting in animals given neuroleptics
(11). Vermian white matter volume in schizophrenia, however, did not correlate with indirect indexes of total neuroleptic drug exposure. A limitation of this study is that even with high-resolution MRI, partial volume effects still occur in the cerebellar cortex.
It is noteworthy that the trend-level left-greater-than-right hemispheric asymmetry in schizophrenia implicates the right cerebellar hemisphere, consistent with the finding that language and memory processes functionally activate its inferior portion. Furthermore, given crossed cerebellar cerebral cortical connections, this finding is anatomically consistent with greater left cerebral hemisphere damage in schizophrenia
(7).
In sum, our findings support a role for the cerebellum in higher cognitive functioning and suggest that an abnormality in the vermis may contribute to the pathophysiology of schizophrenia.