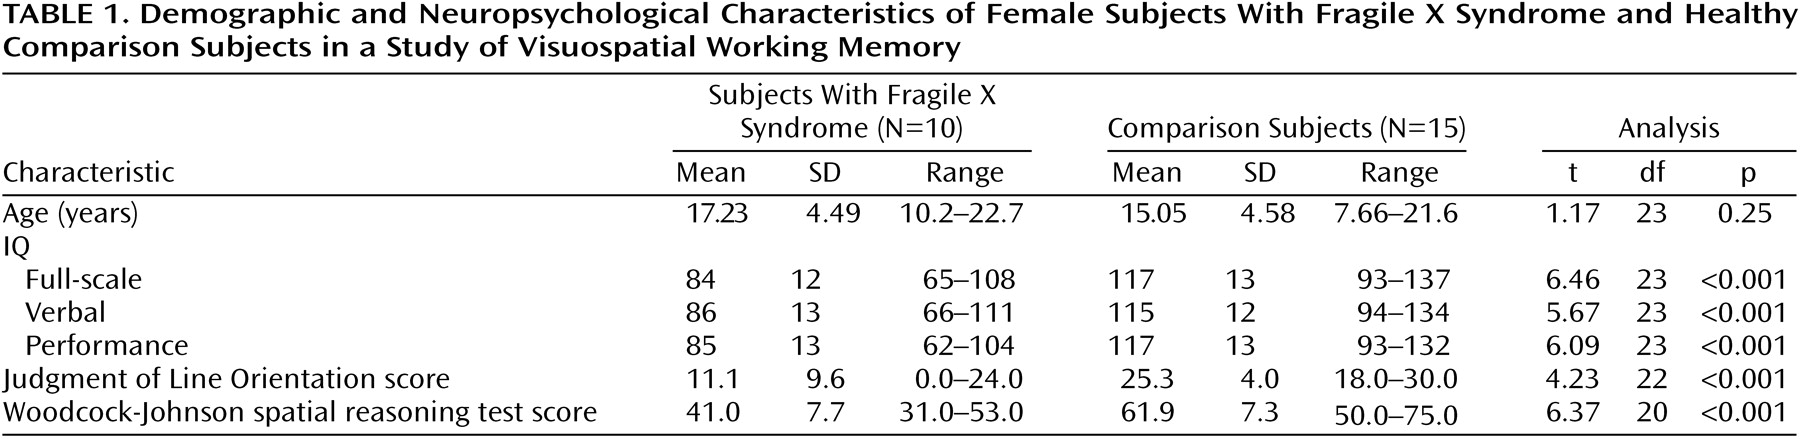
Behavioral Task Analysis
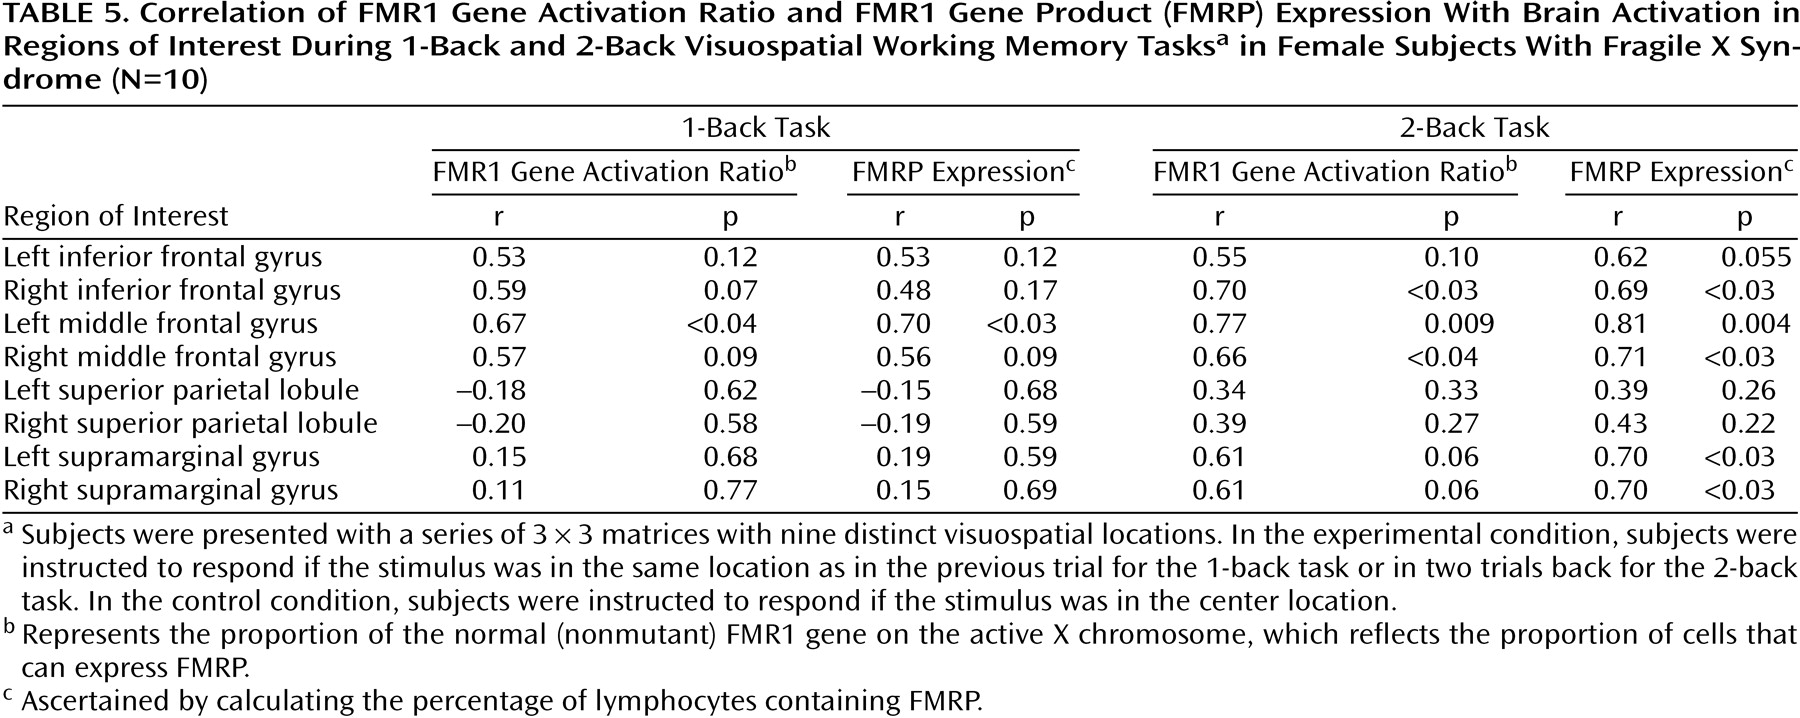
Because comparison and fragile X syndrome groups differed significantly in IQ, full-scale IQ was used as a covariate in all behavioral analyses described below. There was a statistically significant correlation between full-scale IQ and performance on the experimental condition of the 2-back task for the combined groups (r=0.78, df=21, p<0.001) (
Figure 1). When data for each group were examined separately, no significant correlation was seen in either the fragile X syndrome group (r=0.70, df=7, p=0.051) or the comparison group (r=0.35, df=14, p=0.19), although the former correlation approached significance. Experimental behavioral data were successfully collected from all comparison subjects and from eight of the 10 subjects with fragile X syndrome.
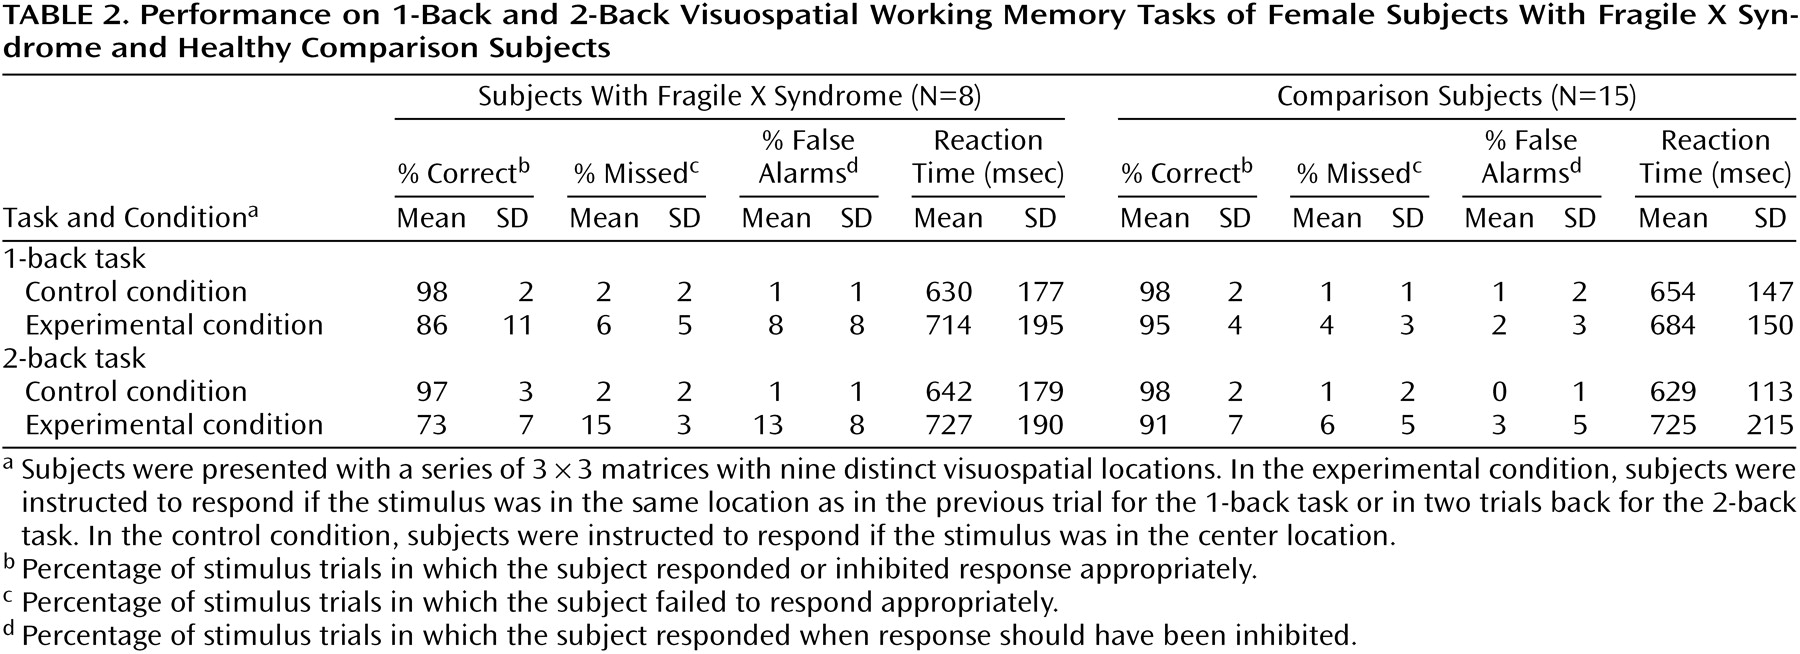
The percentages of correct responses on the visuospatial working memory tasks in the two groups were compared by using ANCOVA (
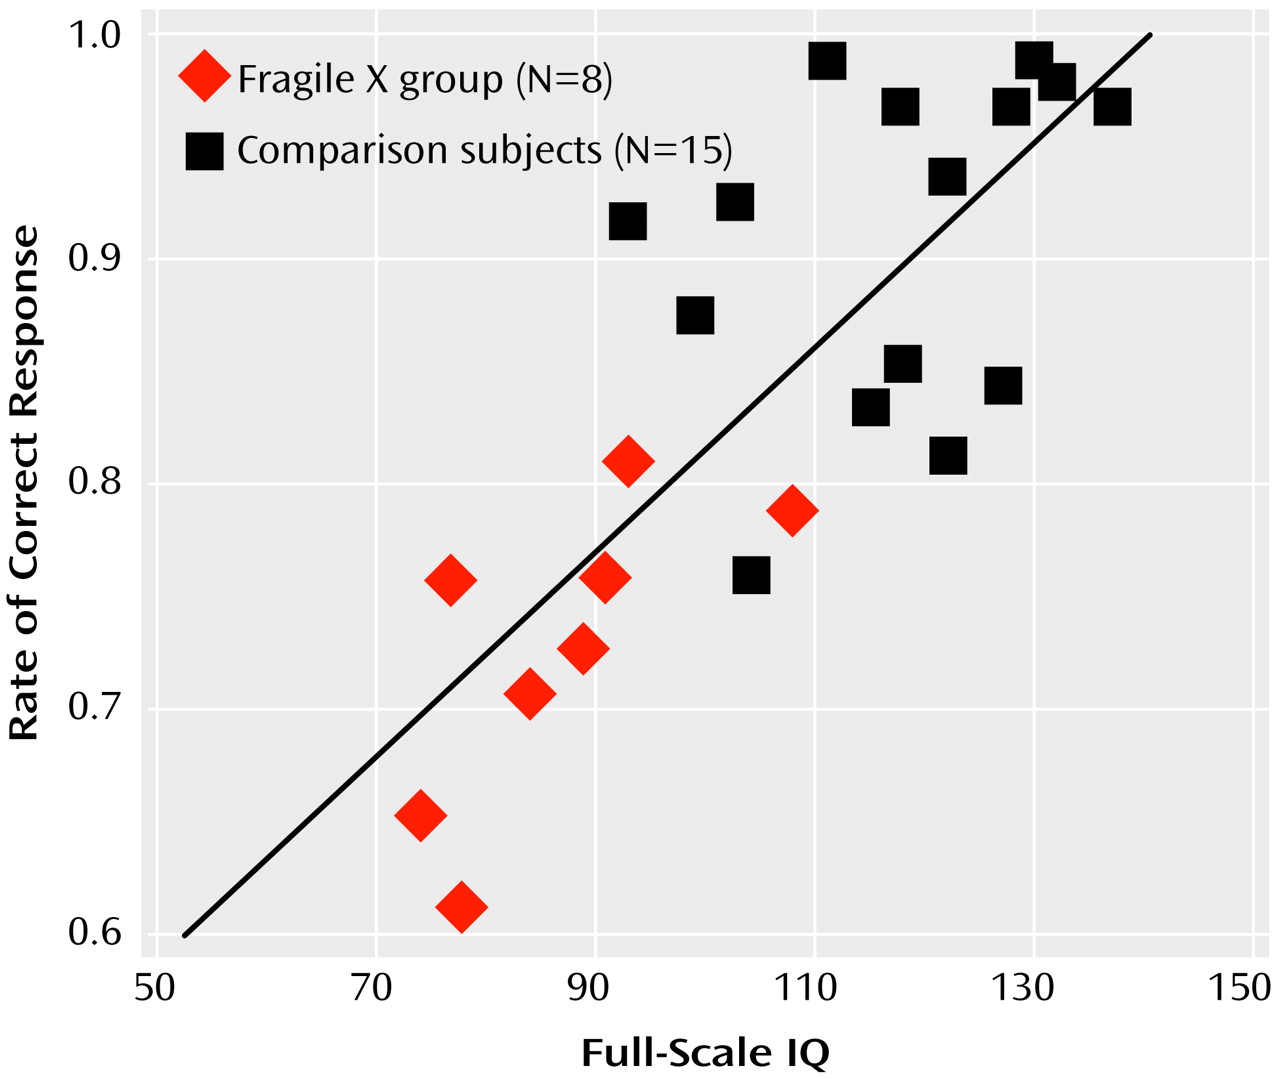
Table 2). Main effects of task (F=26.5, df=1, 21, p<0.0001) and condition (F=106.4, df=1, 21, p<0.0001) were observed, but a main effect of diagnosis was not (F=0.6, df=1, 20, p=0.44). There was a significant interaction of diagnosis, task, and condition (F=8.9, df=1, 21, p<0.008). A separate two-way ANCOVA examining the interaction of diagnosis and task was not significant for the control condition (F=0.2, df=1, 21, p<0.70) but was significant for the experimental condition (
Figure 2). Planned comparisons of this two-way interaction showed that comparison subjects did not differ significantly in performance on the 2-back versus the 1-back task (91% correct responses on 2-back task versus 95% on the 1-back task) (F=4.2, df=1, 21, p=0.052), whereas subjects with fragile X syndrome performed significantly worse on the 2-back task than on the 1-back task (73% correct responses on 2-back task versus 86% on the 1-back task) (F=28.9, df=1, 21, p<0.0001). Moreover, subjects with fragile X syndrome performed worse than comparison group subjects on the experimental conditions of both tasks, with the difference statistically significant on both tasks (
Figure 2).
Analysis of false alarms showed main effects of task (F=24.5, df=1, 21, p<0.0001) and condition (F=26.2, df=1, 21, p<0.0001) but not of diagnosis (F<0.1, df=1, 20, p=0.92). The two-way interaction of diagnosis and task was significant (F=10.9, df=1, 21, p<0.004). Subjects with fragile X syndrome had significantly higher false alarm rates (F=26.1, df=1, 21, p<0.0001) in the 2-back versus the 1-back task. The comparison subjects showed no difference (F=1.9, df=1, 21, p=0.18) in false alarms between the tasks. No significant three-way interaction (diagnosis-by-task-by-condition) was observed (F=4.2, df=1, 21, p=0.053). For reaction time, there were no significant interactions of diagnosis with any of the factors. There was no main effect of diagnosis (F=0.4, df=1, 20, p=0.56). A main effect of condition was observed (F=18.6, df=1, 21, p<0.0003).
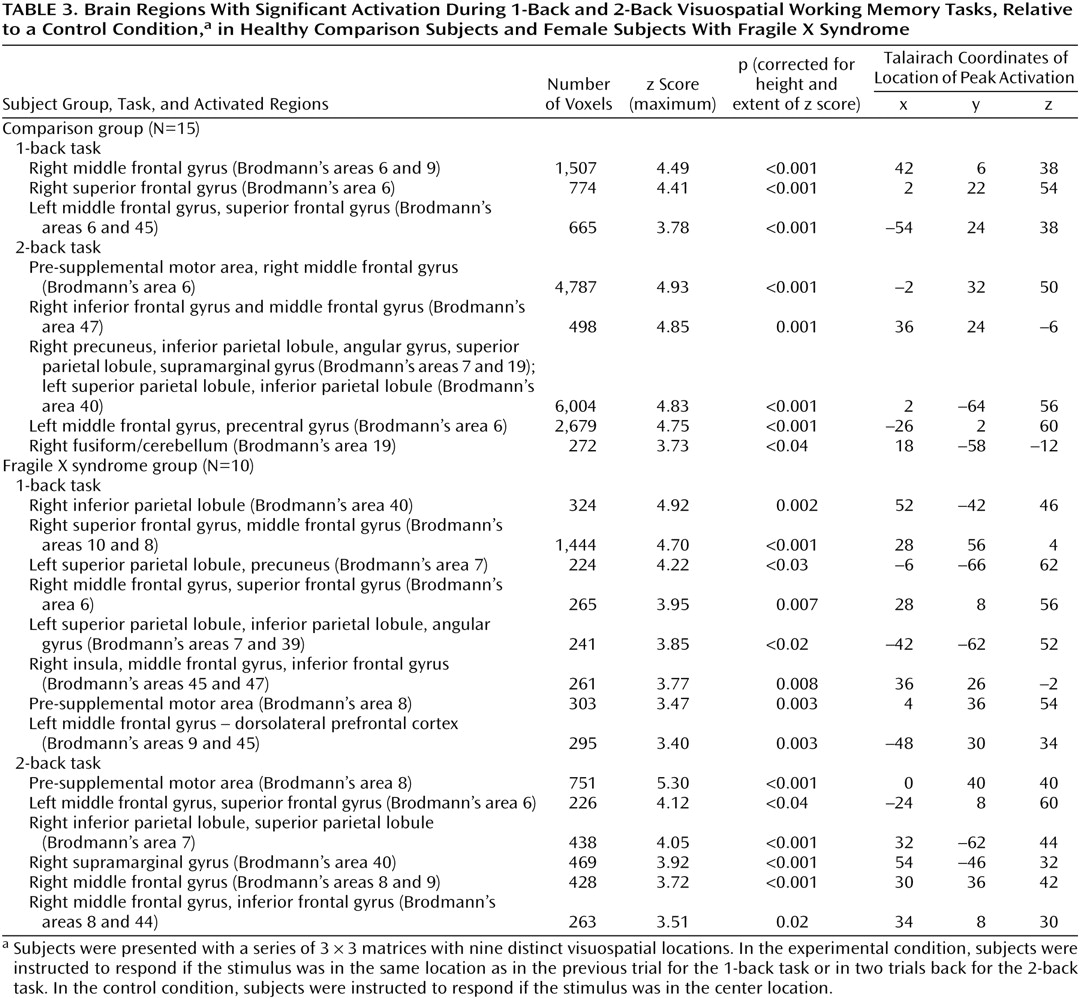
Brain Activation: Region-of-Interest Analysis
Regional differences in activation were investigated by using a four-way ANCOVA, with one between-group factor, diagnosis (comparison group versus fragile X syndrome group), and three within-group factors (region of interest, task, and hemisphere), with full-scale IQ as a covariate.
Statistically significant main effects were observed for region of interest (middle frontal gyrus>inferior frontal gyrus>superior parietal lobule>supramarginal gyrus; F=9.8, df=3, 69, p<0.0001), hemisphere (right>left; F=8.4, df=1, 23, p=0.008), and task (2-back>1-back; F=8.1, df=1, 23, p=0.009). There was no main effect of diagnosis (F=0.2, df=1, 22, p=0.65). However, a significant diagnosis-by-task interaction was observed (F=10.8, df=1, 23, p=0.003). The comparison subjects showed a significant increase in activation between the 1-back and 2-back tasks (F=23.6, df=1, 23, p<0.0001), but subjects with fragile X syndrome showed no difference between the two tasks (F=0.1, df=1, 23, p=0.78). When each task was examined separately, the comparison subjects and subjects with fragile X syndrome did not differ significantly on the 1-back (F=0.4, df=1, 22, p=0.51) or 2-back (F=0.1, df=1, 22, p=0.79) tasks. Therefore, the diagnosis-by-task interaction was driven almost entirely by the working memory load-specific increases in activation shown by the comparison subjects together with the absence of any such increase in subjects with fragile X syndrome. Furthermore, no regional differences in activation were observed as indicated by the lack of an interaction of region of interest, diagnosis, and task. Other higher-order interactions were nonsignificant.
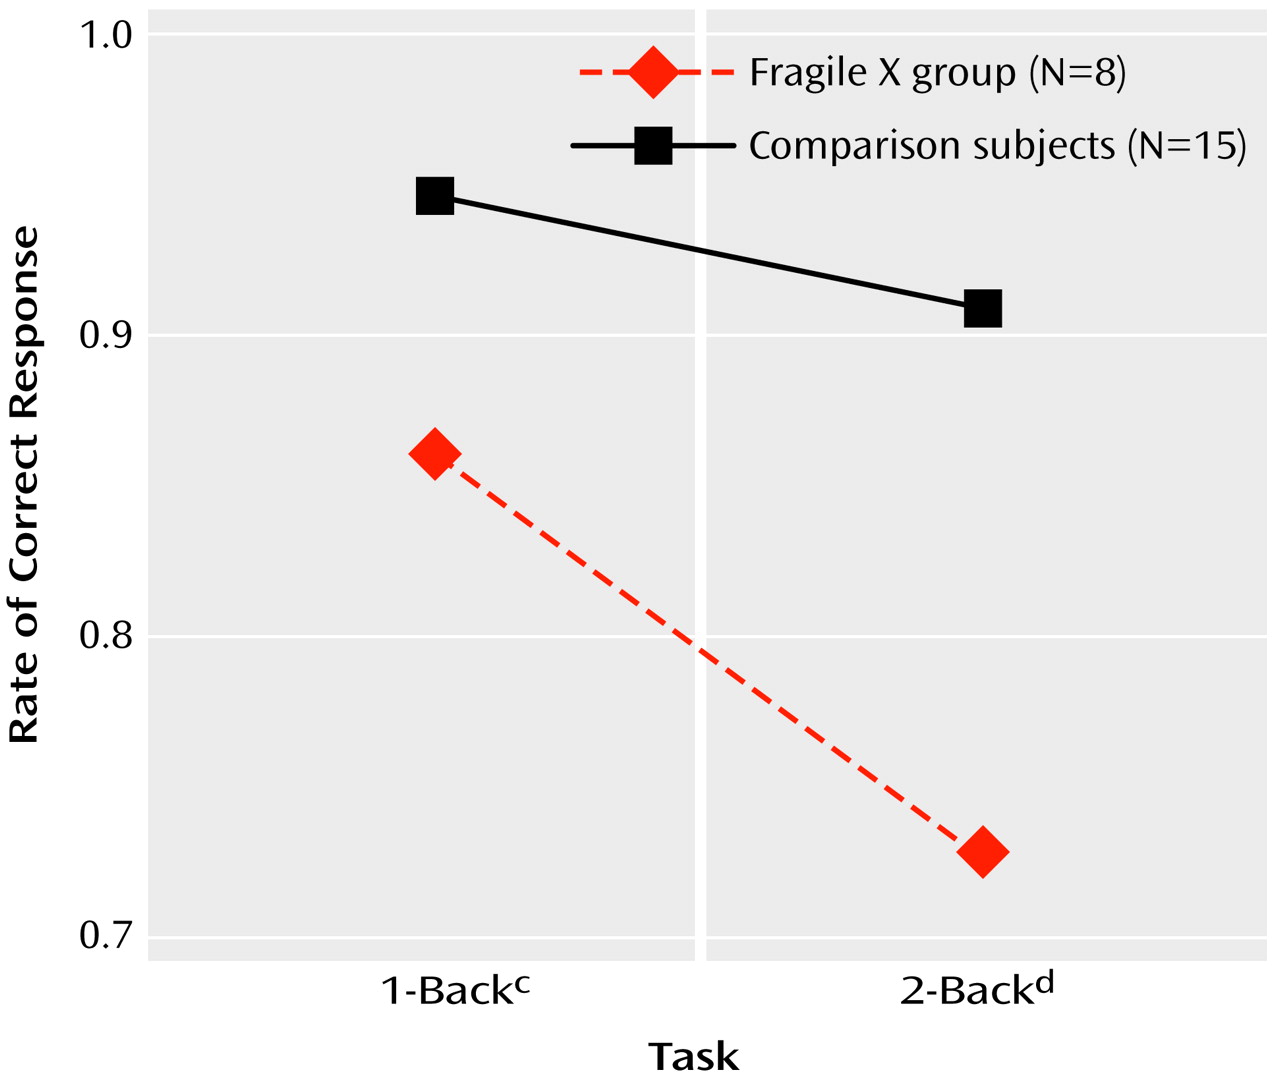
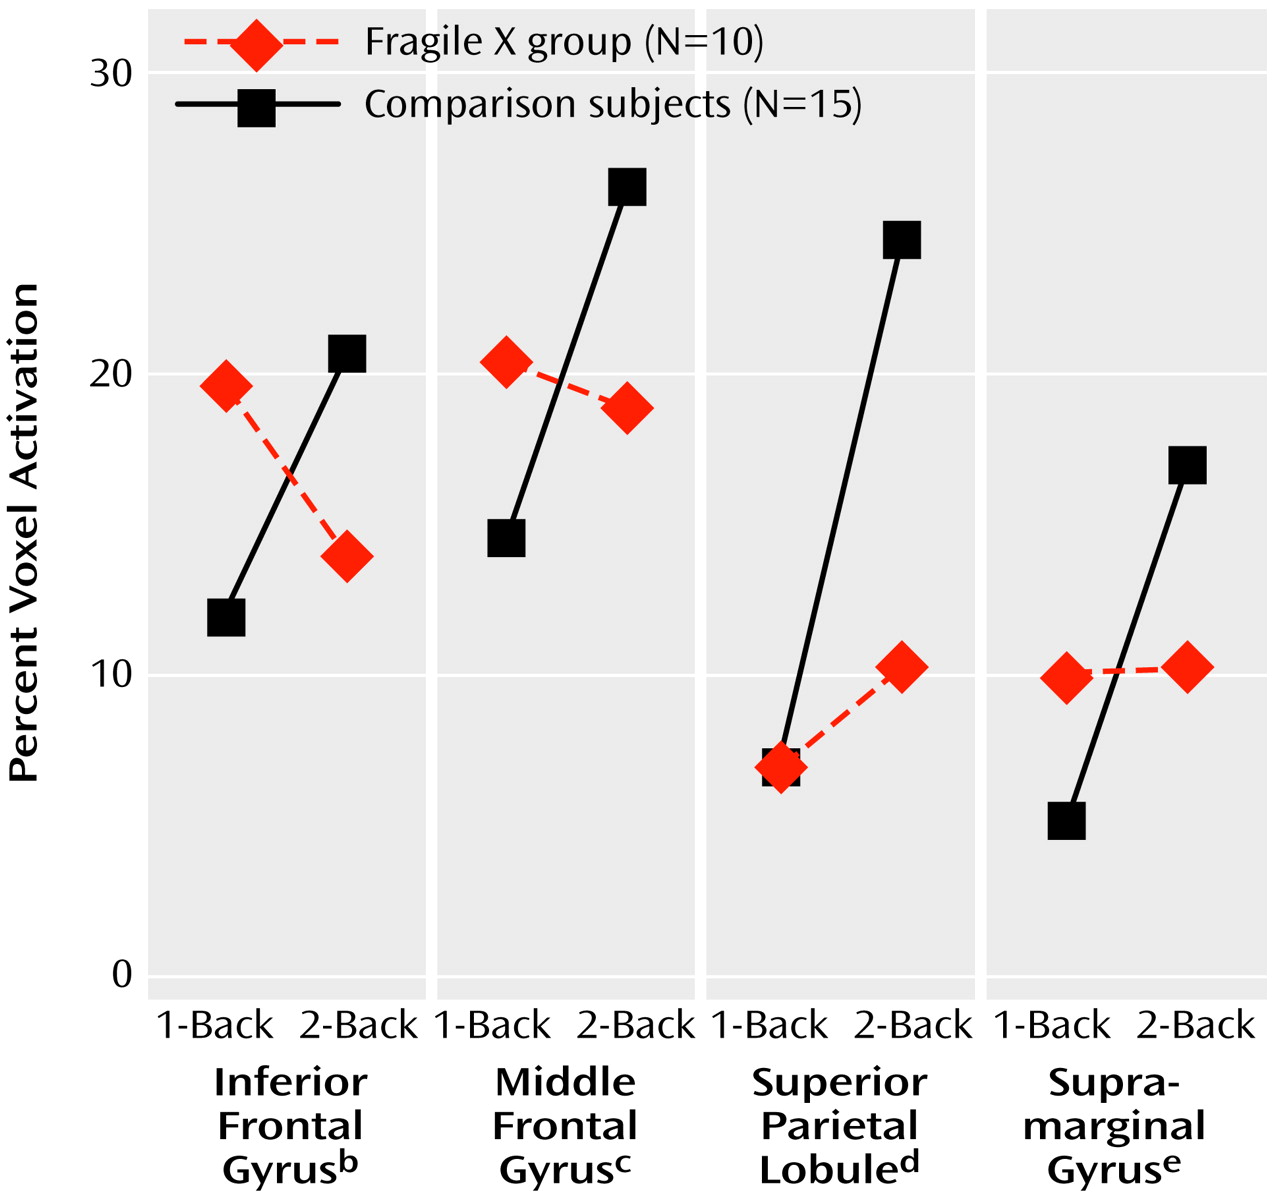
The pattern for each region of interest was that of a significant increase in activation between the 1-back and 2-back tasks for comparison group subjects and a generally flat response for subjects with fragile X syndrome (
Figure 4). All four regions of interest showed significant diagnosis-by-task interactions in activation. In the inferior frontal gyrus, comparison subjects showed significant increase in activation from the 1-back to the 2-back task (F=6.1, df=1, 23, p=0.02), whereas subjects with fragile X syndrome showed a nonsignificant decrease (F=1.7, df=1, 23, p=0.20). Similarly, the comparison subjects showed significant increases in the middle frontal gyrus (F=10.7, df=1, 23, p=0.003), superior parietal lobule (F=44.3, df=1, 23, p<0.001), and supramarginal gyrus (F=34.6, df=1, 23, p<0.001), while subjects with fragile X syndrome did not show such increases (p>0.20).
Brain Activation and Performance
As a corollary to the analysis that showed an association between performance on the visuospatial working memory tasks and full-scale IQ (
Figure 1), the relationship between brain activation and full-scale IQ was examined. When the two subject groups were combined (N=25), Pearson product-moment correlation analysis showed a significant correlation between full-scale IQ and activation during the 2-back task in the left inferior frontal gyrus (r=0.42, df=23, p<0.04), left superior parietal lobule (r=0.41, df=23, p<0.05), left supramarginal gyrus (r=0.50, df=23, p=0.01), and right supramarginal gyrus (r=0.42, df=23, p<0.04). No significant correlations between full-scale IQ and activation were observed in the 1-back task. However, when the groups were examined separately, neither group showed significant correlations between full-scale IQ and brain activation during the 2-back task, suggesting that the average group differences in full-scale IQ and activation were driving the correlation observed when the groups were combined. Nonparametric Spearman analysis also showed no significant correlation between full-scale IQ and brain activation, either within or across groups.
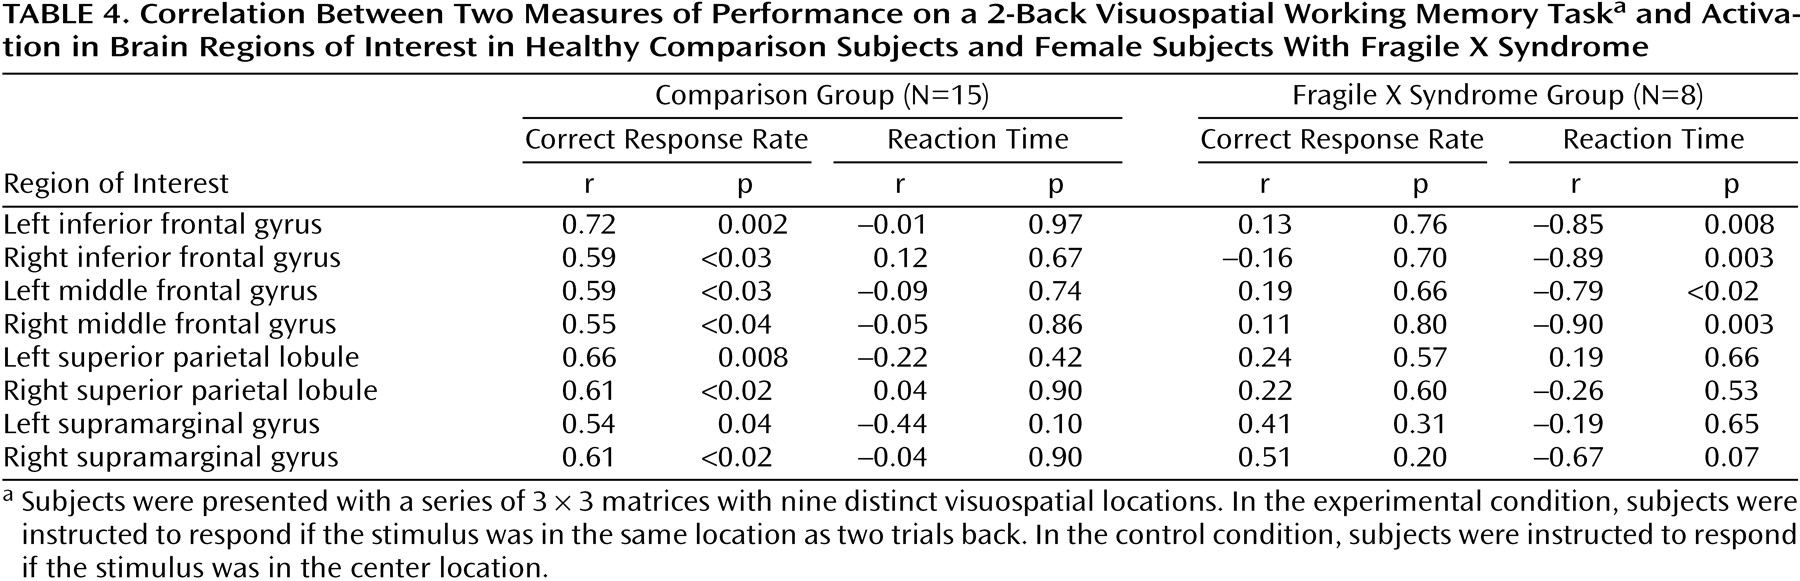
In the comparison subjects, response accuracy on the 2-back task was correlated with activation in the left inferior frontal gyrus, right inferior frontal gyrus, left middle frontal gyrus, right middle frontal gyrus, left superior parietal lobule, right superior parietal lobule, left supramarginal gyrus, and right supramarginal gyrus (
Table 4). No such correlations were found in the subjects with fragile X syndrome. In the subjects with fragile X syndrome, reaction time on the 2-back task was significantly inversely correlated with activation in both frontal lobe regions of interest bilaterally (left inferior frontal gyrus, right inferior frontal gyrus, left middle frontal gyrus, and right middle frontal gyrus) (
Table 4). The comparison subjects showed no such correlations on the 2-back task.
In the 1-back task, significant correlations were seen for reaction time but not for accuracy. Reaction time correlated positively in the comparison group (N=15) with activation in the right inferior frontal gyrus (r=0.56, df=13, p<0.03) and negatively in the fragile X syndrome group (N=8) with activation in the right inferior frontal gyrus (r=–0.80, df=6, p<0.02) and right superior parietal lobule (r=–0.78, df=6, p<0.03).