The corpus callosum, the largest white matter tract in the brain, is a midline structure whose development is associated with the formation of the hippocampus, septum pellucidum, and cingulate cortex, all of which have been implicated in the pathogenesis of schizophrenia
(1). Moreover, the development of cortical-cortical and subcortical-cortical connections determines the pattern of brain growth and shape
(2). Deformations in corpus callosum shape, therefore, may reflect a midline neurodevelopmental abnormality. Recent studies by DeQuardo et al.
(3) and Downhill et al.
(4) found corpus callosum shape alterations in schizophrenia.
We evaluated corpus callosum area and shape in first-episode psychotic patients with schizophrenia, first-episode psychotic patients with affective disorder, and normal comparison subjects. We included psychotic patients with affective disorder to assess the specificity of corpus callosum shape deformations to schizophrenia. For our shape measure we used a two-dimensional skeletonization model employed in the field of computer vision
(5).
Method
Subjects were 14 first-episode psychotic inpatients with schizophrenia (11 men, three women), 19 first-episode psychotic inpatients with affective disorder (14 men, five women), and 18 comparison subjects (16 men, two women). The diagnoses of the patients with affective disorder were bipolar disorder, mania (N=12), bipolar disorder, mixed (N=4), and major depression (N=3). Comparison subjects were recruited through newspaper advertisements. Diagnostic information and inclusion and exclusion criteria are detailed elsewhere
(6). All subjects provided written informed consent before study participation.
The mean ages of the study subgroups were 28.1 years (SD=7.8) for the schizophrenia group, 25.8 (SD=5.8) for the affective disorder group, and 24.5 (SD=4.5) for the comparison group (F=1.54, df=2, 48, p=0.22). The socioeconomic status of patients with schizophrenia was lower than that of the comparison subjects, in accord with the effects of their illness (F=4.74, df=2, 48, p=0.01). Parental socioeconomic status for the schizophrenia group was lower than that of the comparison group and the affective disorder group (F=5.83, df=2, 48, p=0.005), though all groups ranged between middle and upper class.
Patients were assessed with the Brief Psychiatric Rating Scale (BPRS), the Global Assessment Scale (GAS), and the Mini-Mental Status Examination (MMSE).
Magnetic resonance (MR) images were acquired on a 1.5-T General Electric system (General Electric Medical Systems, Milwaukee) (echo time [TE]=5 msec, repetition time [TR]=35 msec, one repetition, nutation angle=45°, field of view=24 cm, acquisition matrix=256×256×124, with dimensions 0.9375×0.9375×1.5) (for additional details, see Hirayasu et al.
[6]).
For MR post-processing image analysis of area, a midsagittal slice was chosen that included the clearest view of the corpus callosum, aqueduct, tectum, septum pellucidum, and falx. The best midsagittal slice and two slices laterally on each side of the midsagittal slice (N=5 slices) were then segmented. Area was computed by summing pixels in each slice for the entire corpus and for four sections (genu, midbody, isthmus, and splenium
[7]). Group differences in the best midsagittal slice, the average of five slices, and the subsections were compared by using analysis of variance. Analyses of covariance (ANCOVA) were performed to control for the effects of age and overall head/brain size.
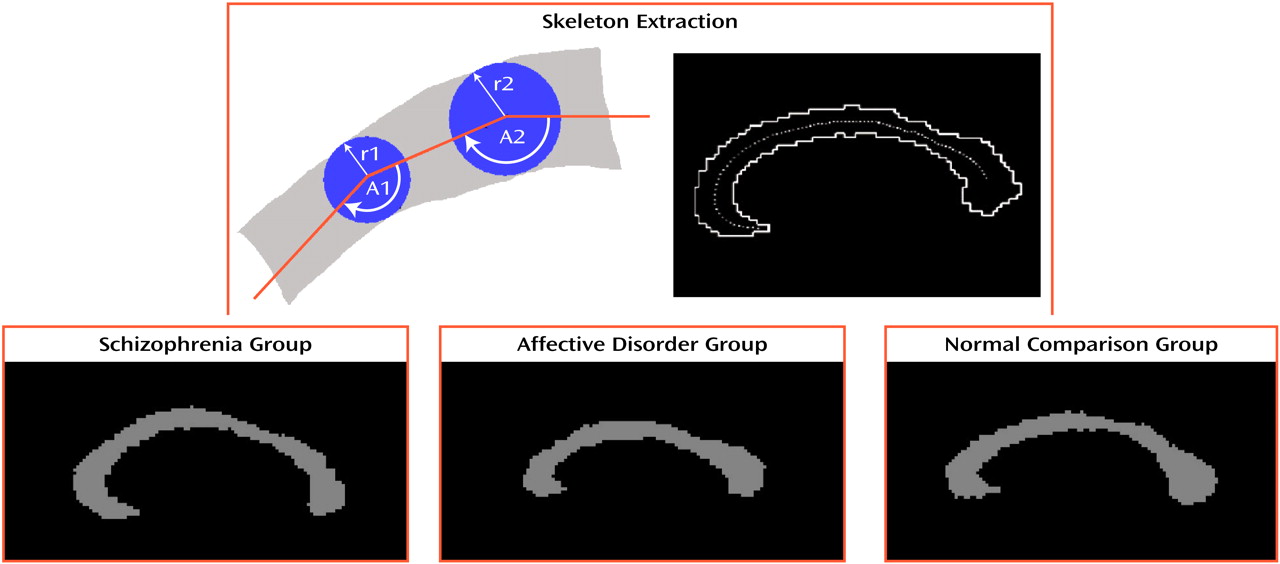
For MR post-processing image analysis of shape, a two-dimensional skeleton of the corpus callosum was extracted by using the same best midsagittal slice and one slice laterally on each side of the midsagittal slice (N=3 slices) (top part of
Figure 1). Width and curvature were measured at eight equidistant points. Likelihood of group membership was assessed by using a classification analysis in which we examined each of the two-by-two classifications: normal versus affective disorder, normal versus schizophrenia, and affective disorder versus schizophrenia. We used bootstrap methods to obtain standard errors for the two-by-two classifications statistics. We obtained 100 bootstrap resampling repetitions, yielding chi-square statistics (df=16) with standard error estimates on the basis of the 100 bootstrap repetitions.
Results
No statistically significant differences in area between the groups were found for the best midsagittal slice (F=1.03, df=2, 48, p=0.54), average of five slices (F=1.92, df=2, 48, p=0.18), or subdivisions of the genu (F=0.14, df=2, 48, p=0.72), midbody (F=1.24, df=2, 48, p=0.29), isthmus (F=1.17, df=2, 48, p=0.30), or splenium (F=0.20, df=2, 48, p=0.66). Using ANCOVA to control for the effects of age and size of the intracranial cavity, we found no significant differences in area between groups. As there are gender differences in corpus callosum size
(7), we excluded 10 female subjects in one analysis; there were no area differences between the schizophrenia and comparison groups (F=0.26, df=1, 25, p=0.61) or between the affective disorder and comparison groups (F<0.01, df=1, 28, p=0.96). For all groups, there were no statistically significant correlations between area and lateral ventricular volumes, nor between area and MMSE, BPRS, or GAS scores or chlorpromazine equivalents of medication received by the subjects.
For analysis of shape, an angles-and-widths multinomial regression model was used (on the basis of the eight equidistant points used to extract the skeleton image) to obtain the classification data for examining each of three two-by-two classification tables. The three two-by-two contrasts (comparison versus affective disorder, comparison versus schizophrenia, and affective disorder versus schizophrenia) were estimated by bootstrap methods, with chi-square statistics (df=16) defined as the mean chi square among all 100 bootstrap repetitions. The contrast between the comparison and schizophrenia groups was statistically significant (χ
2=30.6, df=16, p<0.02). The other contrasts were not statistically significant (comparison versus affective disorder: χ
2=19.3, df=16, p=0.25; affective disorder versus schizophrenia: χ
2=20.3, df=16, p=0.21). The lower part of
Figure 1 shows prototypic corpus callosum shapes for each diagnostic group.
For shape measures, there were no statistically significant correlations of average angle and width with area, lateral ventricular volumes, or scores on the clinical measures (MMSE, BPRS, GAS). In the affective disorder group only, as the width decreased, the angle decreased (r=0.89, df=18, p<0.02), i.e., as the corpus callosum width narrowed, the shape became more curved.
Discussion
Corpus callosum area and shape were evaluated in first-episode psychotic patients with schizophrenia and with affective disorder and normal comparison subjects by using two-dimensional shape analyses. No differences were found in corpus callosum area among the three groups, although differences in shape were observed between the patients with schizophrenia and the comparison subjects. In addition, in the affective disorder group only, as corpus callosum width narrowed, the angle decreased, resulting in a more curved shape. These findings, while intriguing, need to be confirmed in an independent group of study subjects. Moreover, an insult to the developing brain during the time of rapid growth of the corpus callosum may partially account for these findings, although this explanation is speculative.


