Neuropsychological and neuroimaging studies suggest that abnormal connectivity between various cortical and subcortical brain regions plays a role in schizophrenia
(1,
2). Disturbance of cortical connectivity may result from perturbations of cortical development. Postmortem studies of schizophrenia subjects have shown that several brain structures, including the parahippocampal gyrus, may be affected by a variety of cytoarchitectural, neuronal morphometric, and innervation abnormalities, which suggests anomalous development
(3).
During development, neurons destined to constitute the cortical gray matter migrate through the subplate before reaching the cortical plate, a structure that later matures into cortical layers II through VI. Both thalamic and callosal axons accumulate within the subplate for extended periods of time before penetrating the cortical plate. Lesion studies suggest that the interactions between subplate neurons and cortical afferents during this period are critical for the subsequent formation of proper connections with cortical neurons
(4,
5). When these maturation processes are completed, most subplate neurons are eliminated, with few remaining as interstitial neurons in the adult white matter
(6). Anomalies in interstitial white matter neurons observed later on may indicate early maldevelopment of the cortical subplate.
Several studies have reported an abnormal distribution of immunohistochemically defined populations of interstitial white matter neurons in prefrontal, temporal, and parietal neocortices in schizophrenia subjects
(7–
11). The findings have been interpreted as evidence that schizophrenia may be related to prenatal disturbances in the cortical subplate
(7–
11). While most studies report a similar distribution of neurons in the white matter of comparison subjects, they disagree on how schizophrenia affects that distribution. These studies used arbitrary divisions of the white matter that could influence the outcome of the statistical analysis and hence account for the different findings. Furthermore, the statistical power was limited given the small group sizes in all but one study
(7–
11). To address these problems, we have used a pseudo-Euclidian distance map to evaluate the distance of each interstitial white matter neuron to the gray matter/white matter boundary and Poisson regression to evaluate changes in neuron distribution. Moreover, the size of the cohort in the present study was much larger than those of previous studies.
In the sole interstitial white matter neuron distribution study in the temporal lobe
(7), significant changes in density of nicotinamide-adenine dinucleotide phosphate-diaphorase neurons (another marker of interstitial white matter neurons) were found both in the gray matter and white matter of the lateral temporal lobe neocortex in seven schizophrenia brains, whereas no consistent changes were detected within the parahippocampal gyrus of the medial temporal lobe. Yet the parahippocampal gyrus is where numerous studies have reported other types of anatomic abnormalities. Furthermore, changes in neuronal distribution in the cortical white matter are not similar when using different neuronal markers
(11). While nicotinamide-adenine dinucleotide phosphate-diaphorase has been shown to label only a small subset of subplate neurons, the microtubule-associated protein MAP2 is expressed by the majority of subplate neurons and by their derivatives in the adult brain
(12) and could allow a better index of developmental disturbances. In the present study, we quantified the number and distribution of MAP2-labeled interstitial white matter neurons in the anterior region of the parahippocampal gyrus in schizophrenia subjects.
Method
Patients
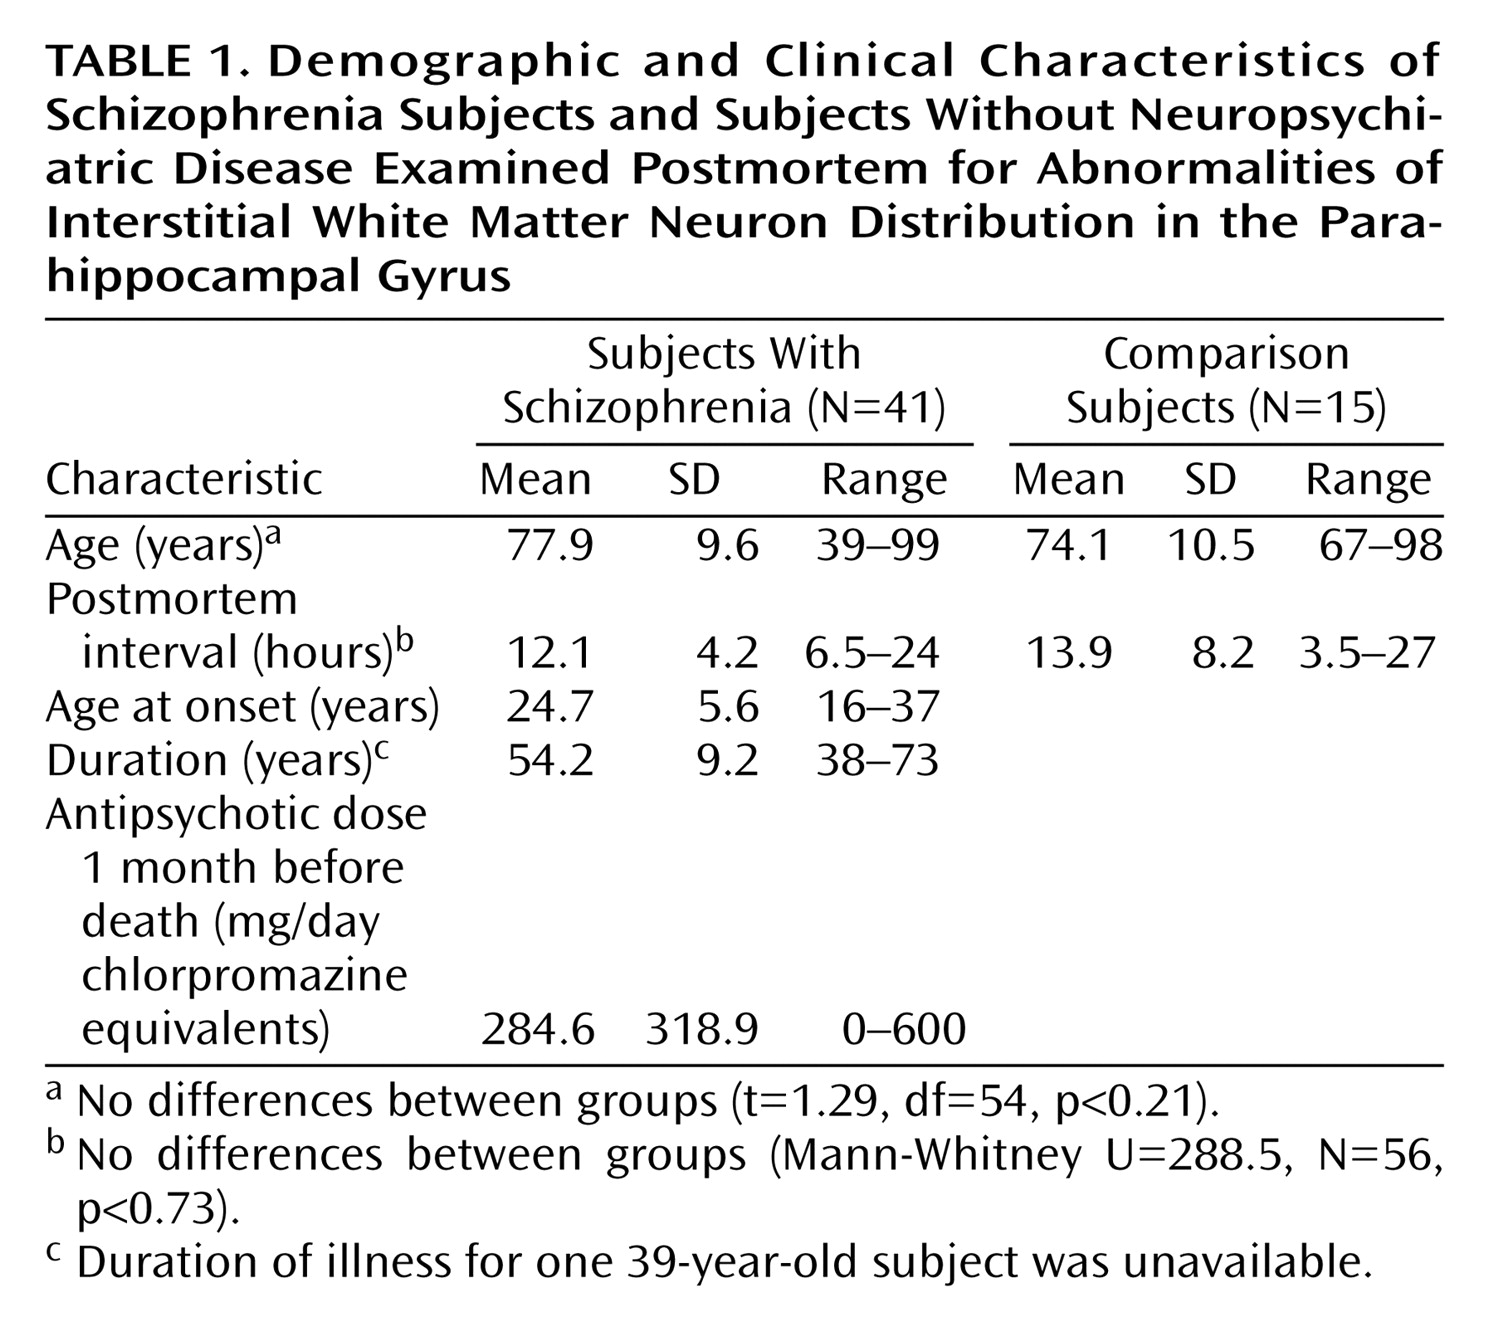
Brains were obtained at autopsy from 41 schizophrenia subjects (29 women and 12 men) and 15 subjects without neuropsychiatric disease (seven women and eight men) who were comparable for age, sex, and postmortem interval distributions (
Table 1). All schizophrenia subjects had been participants in a prospective clinicopathological study program
(13) in which diagnosis was established at consensus conference according to DSM-III-R/DSM-IV criteria on the basis of medical history, interview with caregivers, and direct clinical examination of the subject. All had required chronic hospitalization for many years because of severe schizophrenia-related symptoms, including cognitive and functional impairment. Patients were excluded from the study because of 1) alternative or ambiguous DSM-IV diagnoses, 2) substance abuse, 3) neurologic disorder predating the onset of psychiatric symptoms, or 4) subsequent confounding neurologic disorder. After complete description of the study, written informed consent for antemortem evaluation and autopsy in the event of death was obtained from next of kin. Brain tissues from normal elderly comparison subjects were obtained through the University of Pennsylvania’s Center for Neurodegenerative Disease Research. While none of these normal subjects had undergone antemortem assessments, a review of their clinical histories found no evidence of any neurological or psychiatric illness. At the time of death, subjects were excluded for prolonged agonal state (>24 hours), ventilator support (>12 hours), history of CNS neoplasm, anoxic injury, or extensive injury due to trauma, stroke, infection, or toxins. Gross and microscopic diagnostic neuropathological examination results were conducted in all cases to assess the presence of neurodegenerative or other lesions. None of the subjects had Alzheimer’s disease or other neurodegenerative conditions.
Tissue Processing and Immunohistochemistry
Coronal blocks of the ventromedial temporal lobe were dissected at autopsy. Tissues from 10 comparison subjects and eight schizophrenic subjects were fixed in ethanol (70% ethyl alcohol, 150 mM NaCl), and five comparison subjects and 33 schizophrenic subjects were fixed in formalin (3.7% formaldehyde in 0.1 M Tris, 0.9 g/liter NaCl) for 24 hours. All blocks were paraffin embedded, cut into 20-mm sections, and mounted on poly-lysine coated slides. A mix of left and right hemispheres was used: eight left and seven right hemispheres from comparison subjects, and 19 left and 22 right hemispheres for schizophrenic subjects. For each subject, we used one randomly chosen section from the anterior portion of the parahippocampal gyrus including the middle rostrocaudal extent of the entorhinal cortex. Because the shortest radial distance from a point in the white matter of the parahippocampal gyrus to its gray matter boundary lies within the coronal plane, careful attention was paid to maintain the coronal orientation of the sections during the blocking, embedding, and sectioning of the brains.
To visualize MAP2-positive neurons, tissue sections were labeled with M13, a mouse monoclonal antibody that identifies a phosphorylation-independent epitope of the high molecular weight isoform of MAP2 in human brain (gift from Dr. V.M.-Y. Lee). As previously described
(14), sections were deparaffinized, rehydrated, and quenched in 1% H
2O
2 at room temperature to remove endogenous peroxidase activity. After two washes in Tris-buffered saline (0.1 M Tris, 0.9 g/liter NaCl), sections were incubated in Tris-buffered saline containing 4% normal horse serum for 60 minutes at room temperature. The sections were then incubated overnight at 4°C in Tris-buffered saline containing 4% normal horse serum and M13 at a dilution of 1:1000, rinsed three times with Tris-buffered saline, and incubated in biotinylated secondary antibody in Tris-buffered saline with 4% normal horse serum (1:200, Vector Laboratories) for 1 hour at room temperature. After rinses with Tris-buffered saline, they were incubated 1 hour in Vectastain ABC reagent (1:100; Vector Laboratories, Burlingame, Calif.) at room temperature. After rinses in Tris-buffered saline, they were incubated with the chromogen diaminobenzidine (0.1% DAB in 0.1 M Tris, 0.01% triton [pH 7.3]) and 0.03% H
2O
2 for 6 minutes and rinsed with water. Sections were then dehydrated, coverslipped with Permount, and coded as the case number. All cases were processed in a single, precisely timed run.
Quantitative Measure of MAP2 Neurons
After codification of slides for blind measurements, the number of MAP2-labeled neurons and their positions were determined by using computer-assisted microscopy (StereoInvestigator, MicroBrightfield Inc, Colchester, Vt.). Sections of the parahippocampal gyrus at a middle coronal level of the entorhinal cortex (subfield EI)
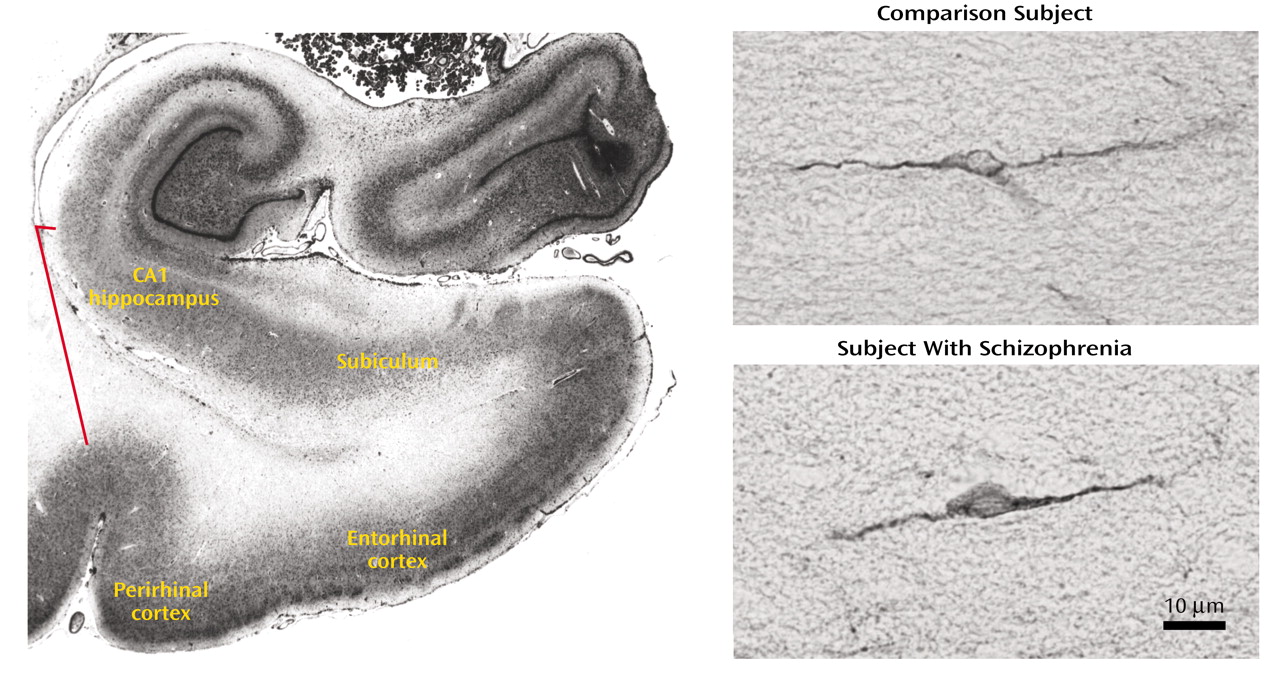
(15) were selected for analysis. The region of interest included all white matter within this section underlying the perirhinal and entorhinal cortices, subicular complex, and most distal portion of CA1. The lateral boundary was defined by a line drawn between the fundus of the collateral sulcus and the inferomedial-most point of the temporal horn of the lateral ventricle (
Figure 1). It was drawn after coding of the slides. The neurons were identified by their immunoreactivity for MAP2 and their characteristic appearance (
Figure 1). Slides were analyzed in random order by one operator (K.L.). After delineating the white matter area at low magnification, the positions of all labeled cells within it were mapped under a 20× objective.
Intrarater reliability in identifying neurons was assessed by tracing the contour of the parahippocampal white matter on three different sections three times and evaluating the number of neurons in each search area three times. We evaluated our ability to delineate the search area and the ability to recognize its neurons by using the intraclass correlation coefficient test.
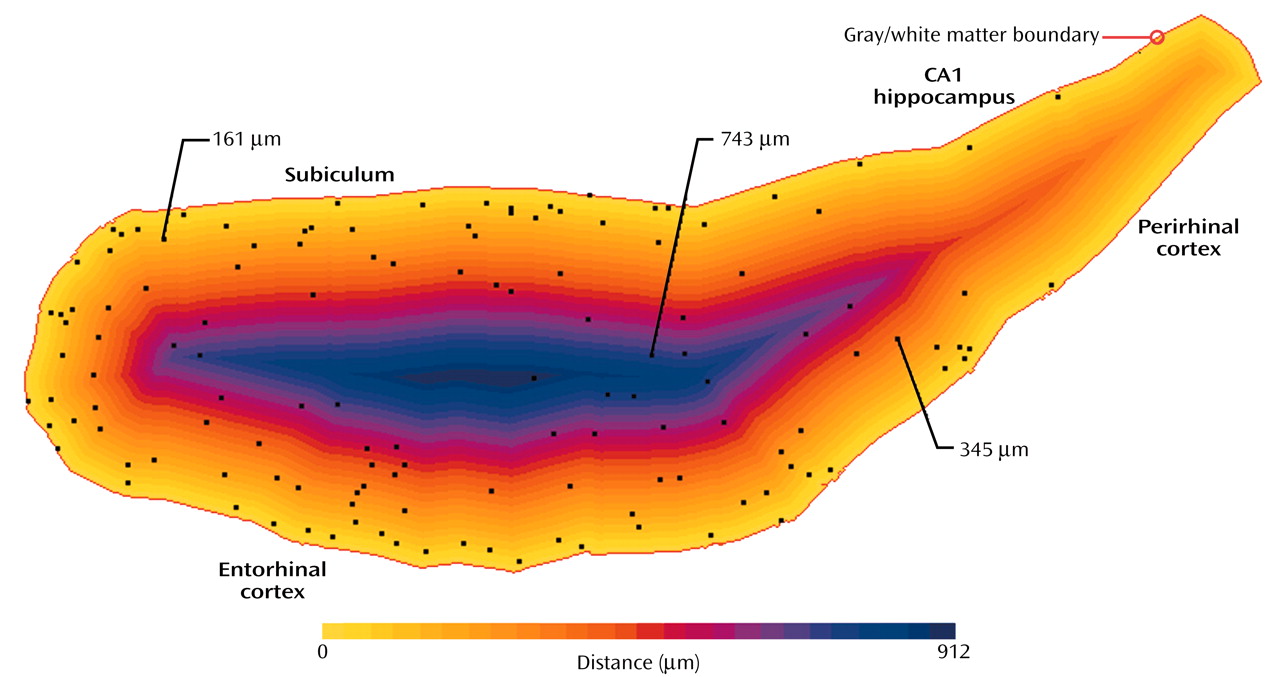
To measure the distance of cells from the gray matter/white matter boundary, a pseudo-Euclidean distance transform
(16), a standard image processing tool
(17), was generated from the contour of that boundary. Starting with a binary (black and white) image, this transform generates a gray value map where the value of each background pixel is proportional to its distance from the closest point on the feature of interest. In our case, the feature of interest was the manually delineated gray matter/white matter boundary, while the background was the enclosed white matter with its neurons. The line drawn between the fundus of the collateral sulcus and the inferomedial-most point of the temporal horn of the lateral ventricle was used to generate the distance map but was not considered in further calculations as a gray matter/white matter boundary because it was never the closest boundary for any of the white matter neurons in any of the cases. For each section, a registered pair of maps was produced—a distance map as well as a map marking the location of each found neuron (
Figure 2). The distance for each cell from the gray matter/white matter boundary was determined by reading the pixel value on the distance map at its x-y coordinates. For each subject, we obtained a distribution of all interstitial white matter neurons as a function of the distance from the gray matter/white matter boundary. The spatial resolution of the distance map analysis was set to 28.6 mm for all sections evaluated. It resulted in neurons being grouped by a distance interval of 28.6 mm to generate a distribution of neurons as a function of their distance from the gray matter/white matter boundary. The number of neurons found between 0 and 28.6 mm of the gray matter/white matter boundary corresponded to interval 1, the number found between 28.7 and 57.2 corresponded to interval 2, and so forth. We normalized the data to correct for differences in gyrus size between subjects by expressing the position of any neuron of a particular subject as a percentage of the maximal distance from the gray matter/white matter boundary in that subject’s gyrus. We generated a distribution of the neuron counts by distance intervals of 1% for use in statistical analysis. To assess if gyrus shape could contribute to a difference in interstitial white matter neuron distribution between groups, we determined the major and minor axes of the best-fitting ellipse corresponding to the delineated white matter surface area for each gyrus. This is a standard way to approximate the ratio of the length to width of the white matter surface area. The difference in mean ratio between the two groups was evaluated.
Statistical Analysis
The variables under consideration in our study, the total neuron counts per section and the counts within each of the distance intervals of 1%, were not well represented by the normal distribution. The Poisson distribution
(18), which is commonly used to represent variables that are counts, was used instead. We compared the mean total counts for schizophrenia and comparison groups using a two-sample t test (on the Poisson means).
Poisson regression
(18) is used to model outcomes that are counts, and thus are distributed as Poisson rather than normally distributed. Similar to regression assuming normality, Poisson regression can be used to test for differences in the means between groups while adjusting for other factors by including them as covariates. Poisson regression was used to test the difference in the mean total neuron counts between the two groups while adjusting for gender, fixation, and hemisphere.
In order to assess the effect of distance, i.e., white matter depth, on the count across the 100 distance intervals, we used a Poisson regression model with distance as a covariate. This allows for testing the linear trend in count across distance by using a single hypothesis test. Additionally, Poisson regression also was used to assess the interaction between distance and diagnostic group. The presence of such an interaction would indicate that the effect of distance on the count within a distance interval was different in the two diagnostic groups.
In the models for the total neuron counts, there is one measurement per subject. However, in the models examining the trends across distance, each subject has 100 measurements, one for each normalized distance interval. These multiple measurements per subject are not independent as is typically required. To accommodate this feature, the Poisson regression models for the distance interval counts were fit by using a generalization of Poisson regression, a generalized estimating equation model
(19), which specifically permits these multiple nonindependent measurements for each subject.
Student’s t test and Mann-Whitney were also used to evaluate differences in search area, gyrus shape (ratio of length to width), age, and postmortem intervals between the two groups.
Results
In the white matter of both comparison and schizophrenic subjects, MAP2-immunoreactive neurons were bipolar or multipolar in morphology, with immunoreactivity in the somata and dendrites (
Figure 1). No qualitative differences in the morphological characteristics of labeled neurons were observed between groups.
Intrarater reliability in identifying neurons was assessed on three different sections three times with the intraclass correlation coefficient (ICC) test and found to be excellent. The ICC for the search area was 0.97 (p<0.05) and 0.99 (p<0.05) for the number of neurons.
The total number of MAP2-immunoreactive parahippocampal interstitial white matter neurons per section did not differ significantly between the schizophrenia group (362.5 [SD=187.1]) and the comparison group (325.7 [SD=176.9]) (Poisson regression: χ2=0.56, N=56, p<0.50). Gender did not effect these findings (Poisson regression: χ2=3.77, N=56, p=0.052). After adjusting for hemisphere difference (χ2=0.54, p<0.47) or fixation (χ2=0.41, p<0.53), there was no difference between groups. Neither the search area (Student’s t test: t=0.48, df=54, p<0.63) nor the mean density of parahippocampal interstitial white matter neurons per section (t=0.52, df=54, p<0.61) were different between groups. The search area was 29.0 mm2 (SD=15.1) for the schizophrenia group and 26.8 mm2 (SD=14.5) for the comparison group. The mean density of neurons was 14.07/mm2 (SD=4.06) for the schizophrenia group and 14.91/mm2 (SD=7.08) for the comparison group. The ratio of length to width for the search area was not significantly different between groups (t=1.14, df=54, p<0.27). The ratio, an index of the shape of the search area, was 3.35 (SD=1.04) for the schizophrenia group and 3.72 (SD=1.20) for the comparison group.
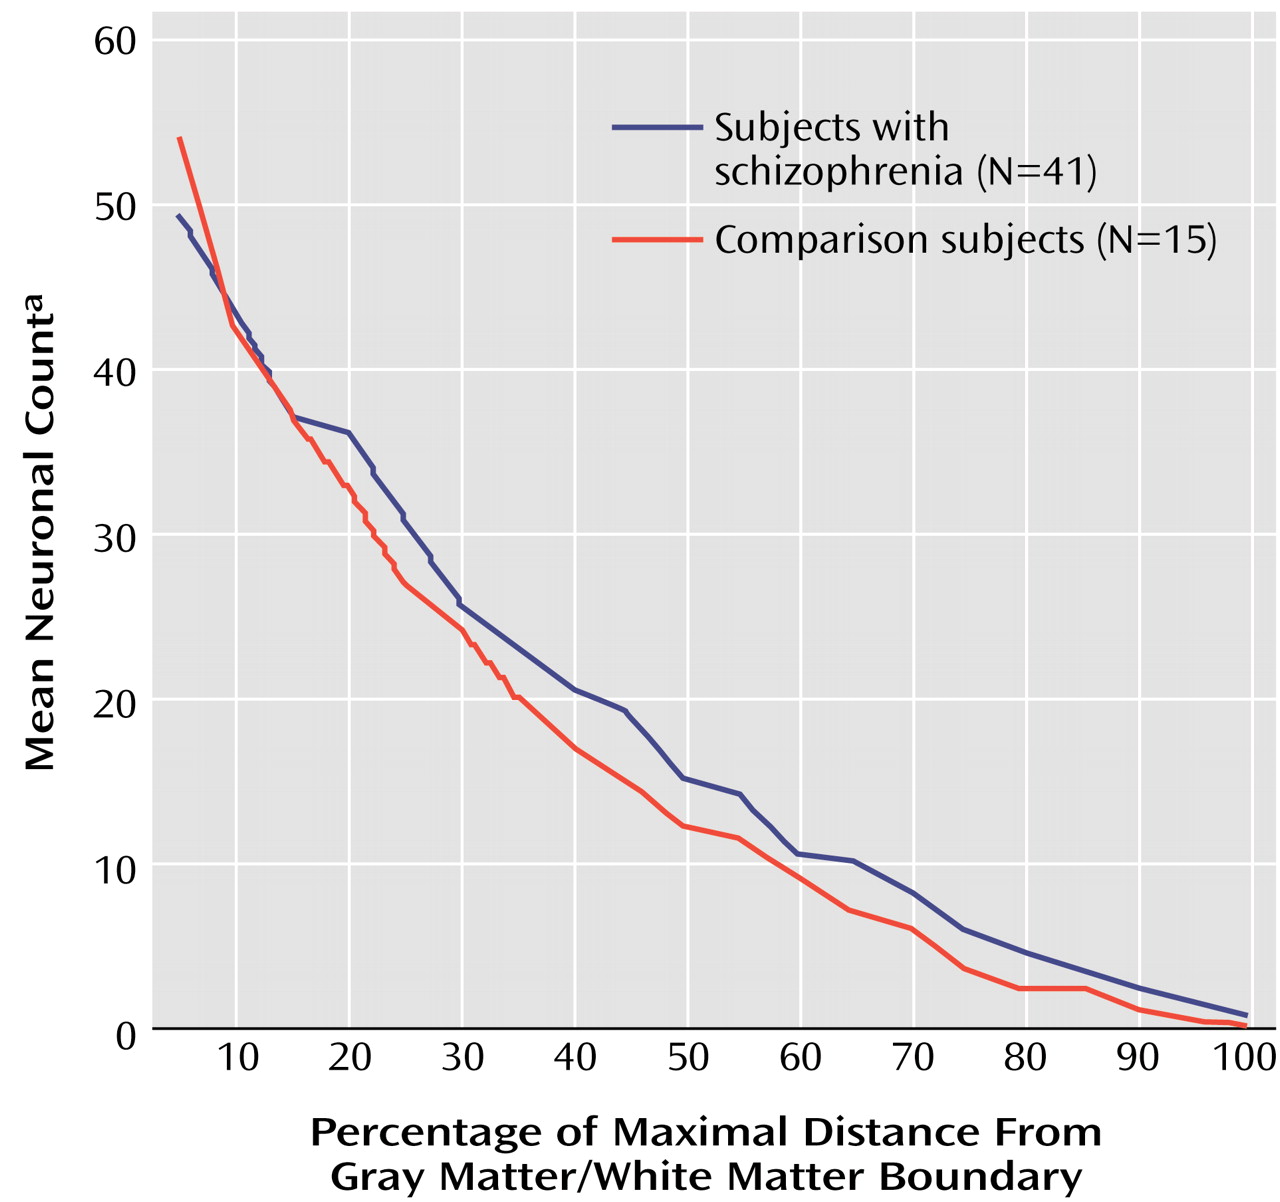
In both schizophrenia and comparison subjects, the number of interstitial white matter neurons was greatest in the most superficial white matter and decreased significantly (Poisson regression: z=15.78, N=56, p<0.0001) with increasing white matter depth (
Figure 3). Moreover, the two groups had different distributions of their interstitial white matter neurons (Poisson regression: z=2.23, N=56, p<0.03) (
Figure 3). With increasing distance from the gray matter/white matter border, the slope of decrease in neuron counts was significantly steeper in comparison subjects (3.60% neuron count decrease by 1% distance interval decrement) than in the schizophrenic subjects (3.03%). This difference was not due to variations in brain size, since the data had been normalized. Adjustment for gender, hemisphere, or fixation had no effect on the significance of the findings (Poisson regression: χ
2=2.23, N=56, p<0.03). No correlation was found between our findings and subject’s age or postmortem interval for any of the subjects nor between the findings and duration of illness, age at onset, or neuroleptic usage in the schizophrenia group.
Discussion
As previously reported in other areas of the brain
(7,
9–11), our study shows a significant difference in the distribution of interstitial white matter neurons in the anterior parahippocampal gyrus in schizophrenia. This differs with a previous study that did not detect significant changes in the density of nicotinamide-adenine dinucleotide phosphate-diaphorase neurons in this limbic area of the medial temporal lobe in a much smaller cohort
(7). There are a number of methodological issues that need to be considered in the interpretation of these findings. First, changes in neuronal distribution in the cortical white matter are not similar when using different neuronal markers
(11). Nicotinamide-adenine dinucleotide phosphate-diaphorase has been shown to label only a small subset of subplate neurons, while MAP2 immunoreactivity is expressed by the majority of subplate neurons and their derivatives in the adult brain
(12) and could allow a better index of developmental disturbances.
Second, tissue samples used in our study came from a more rostral region of the parahippocampal gyrus than those used in the previous study in the medial temporal lobe
(7). Parahippocampal abnormalities in schizophrenia have been found to be most prominent in rostral regions. Since only one central section was used in our study, we cannot say whether abnormalities in interstitial white matter neuron distribution are present in other parts of the parahippocampal gyrus or not. Because of the complex temporal and topographical patterns of development among cortical regions, it is certainly possible for different areas to be affected differently. Varying maturational patterns open specific windows of vulnerability to particular insults or sequelae of disturbed genetic pathways responsible for the regional anatomy and function.
A third consideration in the interpretation of the results is that our study group consisted of schizophrenia subjects who were elderly and required chronic hospitalization. While this population may not be fully representative of schizophrenia at large, it has advantages that make it particularly useful for postmortem studies. Given that all schizophrenia subjects were prospectively accrued and assessed, confidence in diagnosis and clinical characterization is quite high. Their history, predominance of negative symptoms and thought disorder, and courses of illness were consistent with a poor outcome/Kraepelinian subtype of schizophrenia
(20,
21). Their clinical characterization and need for chronic hospitalization indicate that they were at the more severe end of the schizophrenia spectrum. It is likely that any neuropathological abnormalities associated with schizophrenia would be more evident in severely affected individuals than in other, community-based samples.
Fourth, it has been suggested that the strategy of measuring neuron densities in the parahippocampal white matter is flawed
(7) because the parahippocampal gyrus is reduced in size in schizophrenia
(22). Thus, a subtle increase in neuron density in the white matter may be a secondary effect of reduced tissue volume while decreases in neuron density may be obscured. In our study, we did not rely on neuron number or density to evaluate the distribution of the interstitial white matter neurons in the parahippocampal gyrus. Instead we measured the position of each neuron in relation to the gray matter/white matter boundary. Those positions would also be affected if the parahippocampal gyrus were reduced in schizophrenia. However, it has been shown that the temporal lobe white matter is not reduced in schizophrenia
(23). In agreement with that fact, the area of the delineated white matter was not reduced in our schizophrenia group relative to the comparison group. The number and density of interstitial white matter neurons per section was not increased either, contrary to what would be expected if the parahippocampal gyrus were reduced in schizophrenia. Moreover, we did not observe a shallower distribution of the interstitial white matter neurons in schizophrenia as would be found if there were size reduction.
Not enough is known about the mechanisms involved in the present biological phenomenon to decide if the relative or the absolute neuronal distance to the pial surface is the most relevant measure. To remove any effect of gyrus size, we normalized the data. This yielded a similar pattern of distribution to the absolute values but decreased the large interindividual variability observed when using absolute value data. Normalization did not remove the effect of shape. The reported difference in neuron distribution (more neurons more distant from the surface in the schizophrenic subjects) could have been caused by the gyrus being, on average, slightly more elongated in the schizophrenic subjects. We observed no significant difference between groups in the ratio of the major to the minor axis of the best fitting ellipse corresponding to the delineated white matter surface area. In fact, on the basis of these ratios, the gyrus in the schizophrenic group tended to be slightly less elongated than the comparison group.
Since paraffin embedding can give rise to uneven or anisotropic shrinkage, we cannot exclude the possibility of shrinkage in the direction perpendicular to the section even when no shrinkage was detected in the area of the section. However, unless the shrinkage was extremely uneven, it would not affect the distribution of white matter neurons substantially. Change in cell size or lost caps have a definitive effect on cell density or number but should not be of consequence in the distribution of white matter neurons in relation to the gray matter/white matter border. We did not evaluate the size of the white matter neurons, but a previous study that did found no change between schizophrenic and comparison subjects
(7).
Finally, another potential bias relates to our analysis of only one section per case. Because up to 70% of the variability observed in studies such as ours can be due to interindividual variability, we chose to make our study more robust than previous studies by increasing the size of our subject sample
(24). However, our approach could have introduced a source of variation in the data because we did not analyze several randomly chosen sections. In addition to methodological unbiasedness, the benefit of a more elaborate stereological design would have been the possibility of a formal analysis of the variance due to intersection variation versus intersubject variation.
Previous studies
(25–
27) have shown that overall MAP2 immunoreactivity is reduced in the pyramidal cell layer of the subiculum and superficial layers of the entorhinal cortex in schizophrenia. The basis for this decrease is not clear. One hypothesis is that these limbic cortices are developmentally underpopulated with MAP2-expressing neurons, which fail to migrate to their normal positions and survive in ectopic position, perhaps as interstitial white matter neurons. While we find no abnormality in the density of surviving MAP2 interstitial white matter neurons in the central parahippocampal gyrus, their maldistribution is compatible with this hypothesis.
It has been suggested that an altered density or distribution of interstitial white matter neurons may be the residual markers of an abnormal cortical subplate
(7,
10). Our findings are consistent with an abnormality suggestive of aberrant development of the cortical subplate in the parahippocampal gyrus in schizophrenia, at least as can be gleaned from its highly derivative appearance in adulthood. Our data are most in agreement with those of previous studies
(7,
10,
11) in frontal and temporal regions that described more neurons in deeper white matter in schizophrenia. As suggested in those studies, interstitial white matter neurons could be misplaced because of defective neuronal migration or abnormal pruning during development. Either possibility could result in the establishment of abnormal neuronal connectivity in the hippocampal formation.
