Inadequate inhibition of redundant sensory information, measured as a deficit in auditory sensory gating, is thought to underlie reports of sensory overload and attentional dysfunction in patients with schizophrenia
(1–
3). Sensory gating is typically assessed by using a paired-click sensory gating paradigm in which subjects are presented with two clicks separated by 500 msec while the EEG is recorded. The amplitude of the event-related brain potential at electrode Cz 50 msec after the first click (S1) and after the second click (S2) is scored. In normal subjects, the amplitude of the P50 component of the event-related brain potential associated with S2 is diminished, and this suppression of P50 is typically quantified as a ratio (S2/S1). Research has demonstrated maximum suppression when the interstimulus interval is less than 1 second
(4–
10). Patients with schizophrenia often fail to show normal gating, with the S2 response equal to the S1 response or only slightly reduced
(1,
4,
6,
7,
9,
11–14). Although this finding is well replicated, the relevant neural mechanisms are not fully understood nor have behavioral correlates been adequately explored. Among other limitations, the relationship of the gating deficit to other lateralized deficits in schizophrenia is unknown.
For technical reasons, EEG does not lend itself to identification of the presumably lateralized cortical generators of P50. Magnetoencephalography (MEG) is uniquely well suited to the study of lateralized auditory sensory gating in that it provides the same high temporal resolution of EEG while achieving superior source localization capability compared with standard clinical electrode arrays. This is due to reduced signal smearing by intermediate tissue
(15). MEG can be very effective in the localization of sources in the auditory sensory cortex
(15), and recent work has demonstrated its efficacy for investigation of the lateralized nature of auditory sensory gating
(16). MEG studies have identified M50, the MEG analogue of P50, as being generated primarily from posterior areas of the superior temporal gyrus
(17–
22). However, it is unclear whether P50 and M50 reflect activity from the same brain generators. Onitsuka et al.
(22) recorded auditory event-related brain potentials and auditory evoked magnetic fields simultaneously and investigated the effect of varying the interstimulus interval on P50 and M50. They observed a significant effect of interstimulus interval on M50 amplitude but not on P50 amplitude. Huotilainen et al.
(21), recording auditory event-related brain potentials and evoked magnetic fields simultaneously, concluded that one or more generators contributed to P50 that were not detectable by MEG. Work in our lab suggests that the signal observed at electrode Cz, which is the standard site for measuring P50, is primarily a function of the activity of two neural sources that localize to the bilateral superior temporal gyrus
(23). Thus, to the extent that it discriminates individual sources, sensory gating measured via M50 may be a better marker of the neuropathology of schizophrenia than P50. MEG used in conjunction with EEG may provide more information than either technique alone
(23). Furthermore, recent research has shown abnormal lateralization of MEG-assessed sensory gating to be characteristic of schizophrenia
(16,
24), highlighting the importance of assessing lateralized neurophysiological functioning in sensory gating studies.
In addition to the issue of laterality, the relationship of the P50 gating deficit to clinical phenomena has not been fully explicated. Studies examining the diagnostic specificity of the deficit indicate that it occurs in patients with schizophrenia with both predominantly positive symptoms and predominantly negative symptoms
(24) and that similar P50 gating deficits are found in both acutely ill schizophrenic inpatients
(10,
25) and more stable schizophrenic outpatients with less psychosocial impairment
(6,
10). The deficit is not specific to schizophrenia and can be observed in subjects with acute mania
(25); individuals addicted to cocaine
(26); individuals with mild, moderate, or severe head trauma
(27); subjects diagnosed with posttraumatic stress disorder
(28); patients with Alzheimer’s disease
(29); and normal subjects under induced stress
(30). Recent studies examining the effect of medication type on the sensory gating ratio in schizophrenia patients have shown that novel antipsychotic medications may reduce the sensory gating deficit
(31,
32), whereas conventional antipsychotics do not
(6,
33,
34).
P50 sensory gating has also been related to neuropsychological measures. Although sensory gating is presumed to be a metric of an attentional deficit in schizophrenia, few studies have demonstrated a relationship. Cullum et al.
(35) observed a significant correlation between impairment in P50 suppression and performance on a sustained-attention task. Variability in sensory gating measures has been shown to be related to attentional manipulations, such as mental arithmetic or stimulus counting
(36,
37). However, at least one study has shown no relationship between sensory gating and attention
(10). Thus, the significance of sensory gating in terms of cognition remains unresolved.
Although some studies, with a relatively small number of subjects, have demonstrated only generalized neuropsychological deficit in schizophrenia (e.g., references
38,
39), others have successfully demonstrated differential impairment of cognitive functions, for example memory deficit
(40) and greater relative memory, executive, and attentional dysfunction
(41,
42). Others have used specific neuroimaging-based brain markers of impairment and found them to be related to neuropsychological measures of executive and frontal lobe dysfunction in schizophrenia (for example, anterior hippocampal volume
[42] and anterior cingulated gyrus volume
[43]). Attentional function is mediated by multiple interacting systems, but bilateral frontal and inferior parietal cortices are a particularly important part of, and a final common pathway for, attentional function
(44–
46). Imaging studies demonstrate some lateralization of frontal lobe recruitment during attentional tasks depending upon the degree of language dependence of the task. Unfortunately, little is known about modulation of attentional resources by the superior temporal gyrus. Recent studies that have used a mismatch negativity paradigm, however, have suggested attentional control to be related primarily to right-hemisphere circuitry
(47). Thus, to the extent that attentional control is lateralized, successful sensory gating may be better measured in one hemisphere or the other.
The first purpose of the present study was to investigate the utility of MEG for assessment of auditory sensory gating and deficits in gating, which are traditionally measured with EEG in the schizophrenia literature. Thus, EEG and MEG were recorded simultaneously and compared. If MEG proved effective in identifying and distinguished left- and right-hemisphere sources, a second purpose was to evaluate possible lateralization of the M50 gating deficit. A third purpose was to explore the relationship of P50 and (possibly lateralized) M50 gating deficits to behavioral measures. We hypothesized that 1) auditory gating would be evident in M50 sources in the superior temporal gyrus, demonstrating ratios similar to P50; 2) M50 would resemble P50 in distinguishing gating in comparison subjects and patients with schizophrenia, but M50 would show lateralization of the gating deficit; and 3) P50 and M50 sensory gating ratios would predict neuropsychological measures in patients and comparison subjects, with the MEG identification of left- and right-hemisphere sources allowing for the evaluation of lateralization in brain-behavior relationships.
Method
Subjects
Thirteen male and two female healthy comparison subjects were recruited through ads in the local media, while 17 male and three female patients with schizophrenia were recruited from the Albuquerque VAMC and from the University of New Mexico Health Sciences Center. No subject had a history of head injury, neurological disorder, or unstable medical illness. All subjects were diagnosed with the Structured Clinical Interview for DSM-IV Axis I Disorders, Clinician Version
(48). Subjects with a history of alcohol or other substance abuse in the 3 months preceding the study were excluded. All patients met predetermined criteria for clinical stability: they had been treated with the same antipsychotic medications for at least 3 months and had not had an inpatient stay during the past year. Time since first hospitalization ranged from a minimum of 1 year to a maximum of 39 (mean=23.4 years, SD=9.5). Groups were matched in terms of age (comparison group: mean=42.4 years, SD=10.6; patient group: mean=46.0 years, SD=9.6) and education (comparison group: mean=14.6 years, SD=1.7; patient group: mean years=13.3, SD=2.5). Of the comparison subjects, five were smokers, and 10 were nonsmokers. Of the patients, 10 were smokers, and 10 were nonsmokers. All patients were taking either novel (N=13) or conventional (N=7) antipsychotic medications.
Screening procedures also included a “noise run,” where subjects were placed in the MEG dewar to screen for metal-induced artifact (e.g., from dental work) that might interfere with MEG/EEG data collection and analysis. During this procedure, subjects were introduced to the testing environment and testing procedures were explained. Before data collection and after a complete description of the study, written informed consent was obtained from the subjects.
Neuroimaging Data Collection
Subjects were asked to refrain from smoking for at least 1 hour before the examination. To ensure compliance, all subjects were asked to report to the facility an hour before recordings commenced. During that time, subjects were familiarized with the equipment and procedures and were prepared for the data recording session.
MEG was recorded in a magnetically and electrically shielded room using a whole-head, 122-channel biomagnetometer system (NeuroMag, Helsinki). At the start of each test session, subjects were fitted with an electrode cap to which three small coils were attached. These coils provided specification of the position and orientation of the MEG sensors relative to the head. Nineteen EEG channels (referenced to right mastoid and re-referenced offline to linked mastoids) and a bipolar oblique electro-oculogram (EOG) channel were recorded simultaneously with MEG. Electrode impedances were maintained below 10 kΩ. The subject’s head was placed in the MEG dewar while supine to reduce head and neck muscle artifact in EEG/MEG recordings. Since it was necessary for the subject’s head to remain fixed in the same place in the dewar across the recording session, a number of precautions were taken to ensure head stability. Foam wedges were inserted between the subjects’ face and the inside of the dewar to ensure that the patient’s head remained motionless across the entire recording session. In addition, a Velcro strap running under the subject’s chin, and a knee bolster under the subject’s legs were further used to ensure immobility and comfort.
Separately, three-dimensional volumetric T1 magnetic resonance images (MRIs) were collected with a 1.5-T Picker Edge Imager. The pulse sequence was a field echo three-dimensional sagittal (Picker) with the following parameters: TR=15 msec, TE=4.4 msec, field of view=256 mm, flip angle=25°, matrix=192 × 256, slice thickness=1.5 mm, no gap.
Paired-Click Design
Stimuli were presented in pairs with a 500-msec interstimulus interval and an intertrial interval that randomly varied in 1-second steps between 8 and 12 seconds. Stimuli were binaural 3-msec clicks, created and delivered using NeuroStim software through Etymotic earphones placed in the subject’s ear canal. Before data collection, each subject’s hearing threshold was determined, and peak click intensity was set 30 dB above threshold. In order to minimize motion-related artifact produced by the plastic tubes connected to the Etymotic earphones, the tubes were taped to the subject’s face and ear. Uncontaminated tone-pair epochs (N=150) were collected with the overall session lasting approximately 30 minutes, with some variability depending on the number of epochs rejected online because of artifact. Epochs were rejected if peak-to-peak signal strength exceeded 150 μV in any EOG or EEG channel or 3000 fT in any MEG channel. EEG and MEG data were digitized at 500 Hz per channel for 1000 msec beginning 100 msec before S1.
EEG Data Analysis
For P50 peak scoring, cross-trial average event-related brain potentials were digitally filtered by using a four-point moving-average filter and a recursive high-pass filter (A=0.85)
(49). Each filter was applied twice, in the forward and reverse direction, to increase roll-off and to preserve waveform latency (i.e., to avoid introducing a phase shift). The prestimulus baseline (–100 to –10 msec) was removed. P50 was defined as the most positive peak at Cz between 40 and 80 msec after S1 onset. If two equal-amplitude peaks were present, the later peak was scored. Amplitude was measured relative to the immediately preceding negativity. Thus, S1 amplitude was calculated as the difference between the positive peak and immediately preceding negative trough. Following Judd et al.
(7), this trough did not have a latency of less than 30 msec following onset of S1 (i.e., the trough search is stopped if a horizontal tangent line is not encountered by 30 msec poststimulus, and the 30-msec point is then used as the start of the P50 component). For the S2 score, the most positive point at Cz following S2 onset within 10 msec of the latency of the S1 P50 peak was selected. This range ensured that the same response was measured for S1 and S2. If there was no peak in that range, the amplitude was scored as zero. As with S1, the S2 score was calculated relative to the immediately preceding negative trough. P50 gating ratio was calculated as S2 amplitude divided by S1 amplitude.
MEG Source Localization
To localize neuronal sources with MEG one needs to solve the MEG forward and inverse problems. The forward problem involves calculating the external magnetic field distribution for a given source configuration and electrical conductivity distribution of the head. Considering the complex conductivity distribution of the head, certain approximations need to be made to simplify the calculation. Typical head models assume that the head contains several homogeneous layers (e.g., scalp, skull, and brain). The geometry of different layers can be described by best fitting spheres (spherical head model)
(50,
51) or a large number of small triangular boundary elements (boundary element model)
(52–
55), a procedure that requires much more extensive computations. Using a human skull phantom, we showed that, for the superior temporal gyrus, the spherical model and boundary element model yield very similar results
(56) because of the high spherical symmetry of the skull in this region. Therefore, in the present study a spherical MEG head model
(57) was adopted. In such an approach, a sphere is fitted to the inner surface of the skull (obtained from each subject’s structural MRI). The inverse problem of MEG, on the other hand, involves reconstructing the sources for a given magnetic field distribution measured by an array of MEG sensors. The solution to the inverse problem of electromagnetic measures is nonunique if no constraints are imposed on the source. Therefore, constraints on sources (source models) are needed to reduce the nonuniqueness of the MEG inverse solution. In the present study, the equivalent current dipole model was adopted, with the assumption that the neuronal sources were focal.
To coregister MEG and MRI data, three anatomical landmarks (nasion and right and left preauriculars) were measured for each subject by using the Probe Position Identification System (Polhemus, Colchester, Vt.) before data collection. The same three points were identified in the subject’s MRI, and a transformation matrix that involved rotation and translation between the MEG and MRI coordinate systems was used. To increase the reliability of the MEG-MRI coregistration, approximately 50 points on the scalp were digitized with the Polhemus system, in addition to the three landmarks, to ensure that all points were located on the MRI scalp surface.
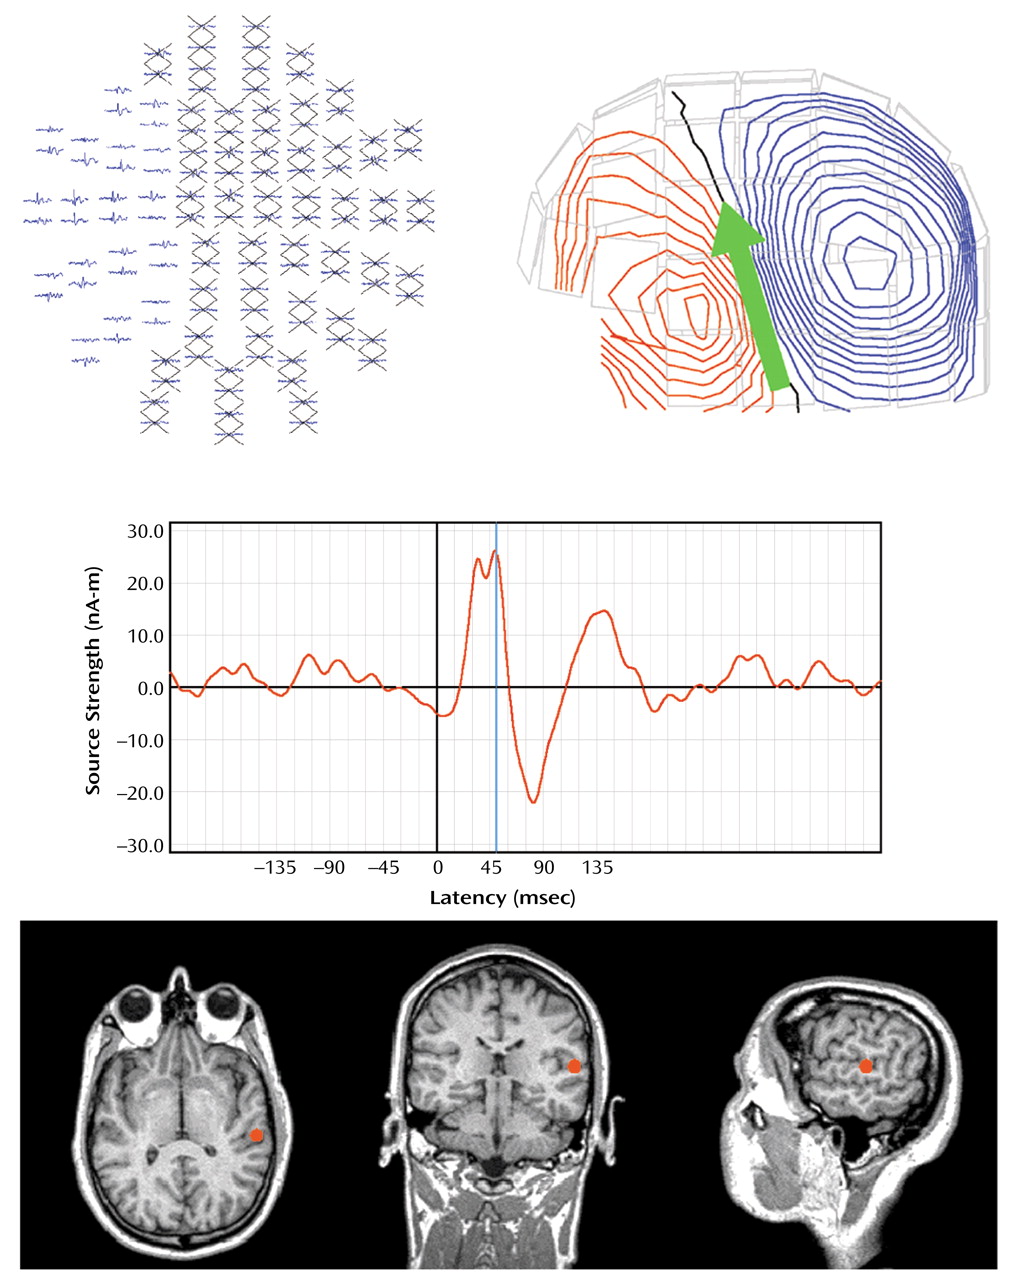
A 5–55 Hz bandpass filter and a –100 to –10 msec baseline adjustment were first applied to averaged MEG data. Dipolar sources were then identified in left and right hemisphere for S1 M100 responses to each click (a dipole oriented downward peaking 80–120 msec poststimulus). M50 was defined as the first upward-oriented dipole occurring before M100, 40–80 msec poststimulus. Determination of the strength, location, and peak latency of the M50 source over the left and right hemisphere was accomplished by fitting each dipole separately over the left and right hemispheres using subsets of 34 planar gradiometers over the temporal lobe (
Figure 1). For modeling S1 M50, 5 msec of data before the M50 peak and 5 msec of data following the M50 peak were selected. Equivalent current dipoles were then determined separately for each hemisphere by using the aforementioned source localization routines. Only equivalent current dipoles with goodness-of-fit values (a measure of the correlation between calculated and measured signal) exceeding 75% for S1 were accepted. Peak strength of the source over the 10-msec period was then determined. S2 M50 was identified by using a procedure outlined by Cardenas et al.
(57), in which the location of the S2 dipole was assumed to be the same as that of the S1 dipole, and the strength of S2 M50 was determined over the same 10-msec period. M50 suppression for each hemisphere was expressed as a ratio similar to that of P50: S2 dipole peak strength divided by S1 dipole peak strength.
Neuropsychological Test Battery
Subjects were tested on a battery of neuropsychological tests that included 1) the Shipley Institute of Living Scale
(58), which has verbal and analytical subscales and provides an estimated WAIS-R full-scale IQ
(59); 2) the Connors version of the Continuous Performance Test
(60), which provides various subscales that are based on a subject’s ability to attend and respond to intermittent visual stimuli; 3) Digit Span Forward, which requires subjects to repeat increasingly long lists of numbers, and Digit Span Backward, in which subjects are asked to reverse the order of presented numbers
(59); 4) Attention Process Training
(61), a battery of tests that provides scores for sustained, selective, divided, and switching attention; 5) Auditory Consonant Trigrams
(62), a test on which subjects are asked to remember three letters under a varying distracter task load (counting backwards); 6) the logical memory and visual reproduction subtests of the Wechsler Memory Scale—Revised (WMS-R)
(63), which assess the ability to reproduce stories and a series of line figures from memory; and 7) Trail Making Test, part A, which involves rapid alphabetic sequencing, and part B, which involves switching between alphabetic and alphanumeric sequencing
(64). To simplify analyses, standard scores were calculated for each test and combined to create neuropsychological factor scores. Factor 1, working memory, was created from the Digit Span Backward test and the Auditory Consonant Trigrams overall score (Digits Back
[65]). Factor 2, sustained attention, was created from two Continuous Performance Test subscores shown to be measures of sustained attention in patients with schizophrenia (CPT d′ + CPT Hit Rate [
66,
67]). Factor 3, executive attention, was created by combining scores from parts A and B of the Trail Making Test
(68). Since higher scores on these tests reflect worse performance, these scores were adjusted (multiplied by –1) before standardizing so that the performance relationships were consistent across factors. Factor 4, general memory, was created from the subscale scores from the WMS-R logical memory and visual reproduction subscale scores. Factor 5 was the WAIS-R estimated IQ score from the Shipley Institute of Living Scale. Scale and subscale scores not used in factors (e.g., all attention process training subscales) were left out of analyses because floor or ceiling effects made their use untenable. This set of factors was developed on the basis of two evaluations. First, the literature on neuropsychological findings was surveyed in selecting the neuropsychological tests and in combining them into factors. Second, a factor analysis was conducted on the present data to confirm that the judgments about the grouping of tests were appropriate. Because of the limited study group size, the formal results of the factor analysis (e.g., factor scores) were not used in the analyses.
To test the hemispheric specificity of the correlations between right- and left-hemisphere M50 gating ratios and neuropsychological factor scores, statistical significance was assessed by using the methods described by Meng et al.
(69).
Results
Two comparison subjects and one patient with schizophrenia were removed from the analyses, either because of extreme scores on P50 EEG gating ratio (over three standard deviations away from the group mean) or because P50 S1 amplitude was below 0.5 μV. Thus, data from 13 normal comparison subjects and 19 patients with schizophrenia were analyzed.
EEG Results
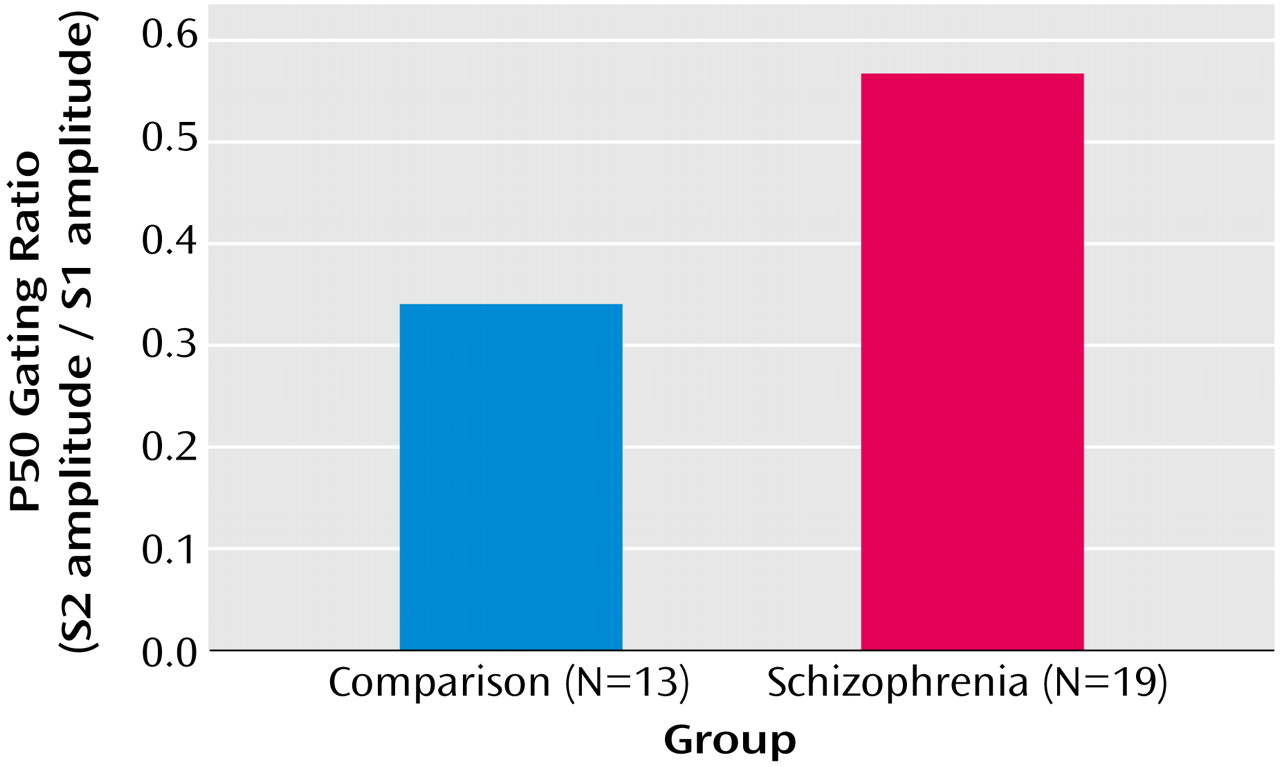
For the comparison group, mean P50 amplitude for S1 was 1.61 μV (SD=0.86); mean amplitude for S2 was 0.59 μV (SD=0.39). For the patient group, mean S1 P50 amplitude was 1.79 μV (SD=0.86), and mean S2 P50 amplitude was 0.87 μV (SD=0.47). Patients demonstrated a larger P50 gating ratio (S2/S1=0.56) than comparison subjects (S2/S1=0.34) (
Figure 2).
There was no group difference in S1 or S2 latency. However, collapsed across groups, S1 occurred significantly later following stimulus onset than did S2. Thus, there was a main effect for stimulus (but no interaction) in a stimulus (S1 and S2)-by-group repeated-measures analysis of variance (ANOVA) (F=7.64, df=1, 30, p=0.01).
MEG Results
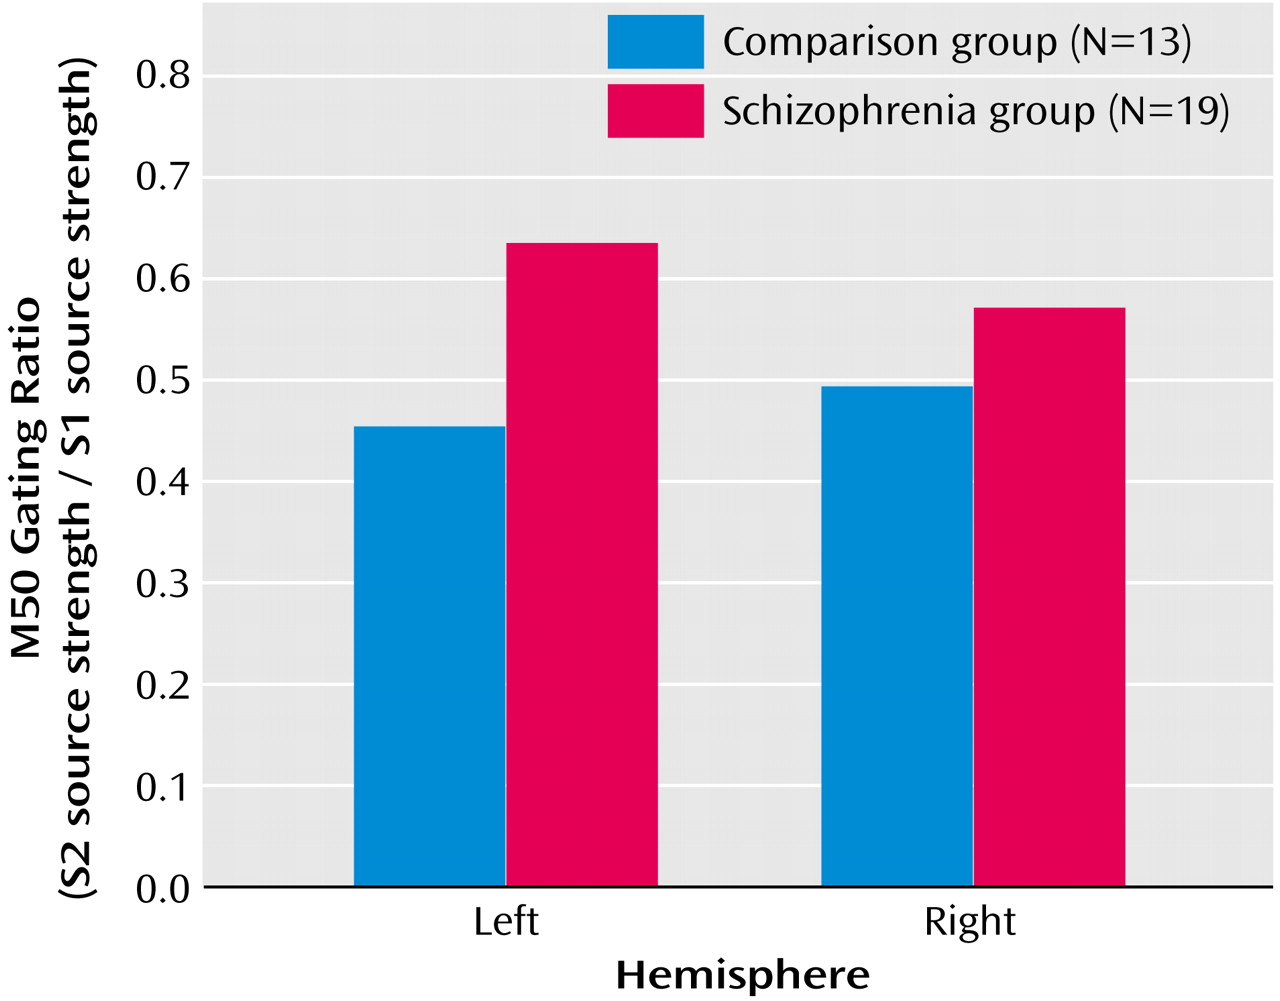
Initial analysis of M50 left- and right-hemisphere gating ratio data, which used repeated-measures ANOVA with hemisphere (left and right) as a within-subject factor and group as a between-subject factor, revealed a group-by-hemisphere interaction (F=4.93, df=1, 29, p=0.03). Investigation of this effect showed that patients had higher gating ratios than comparison subjects in M50 gating ratios in the left hemisphere but not in the right hemisphere (
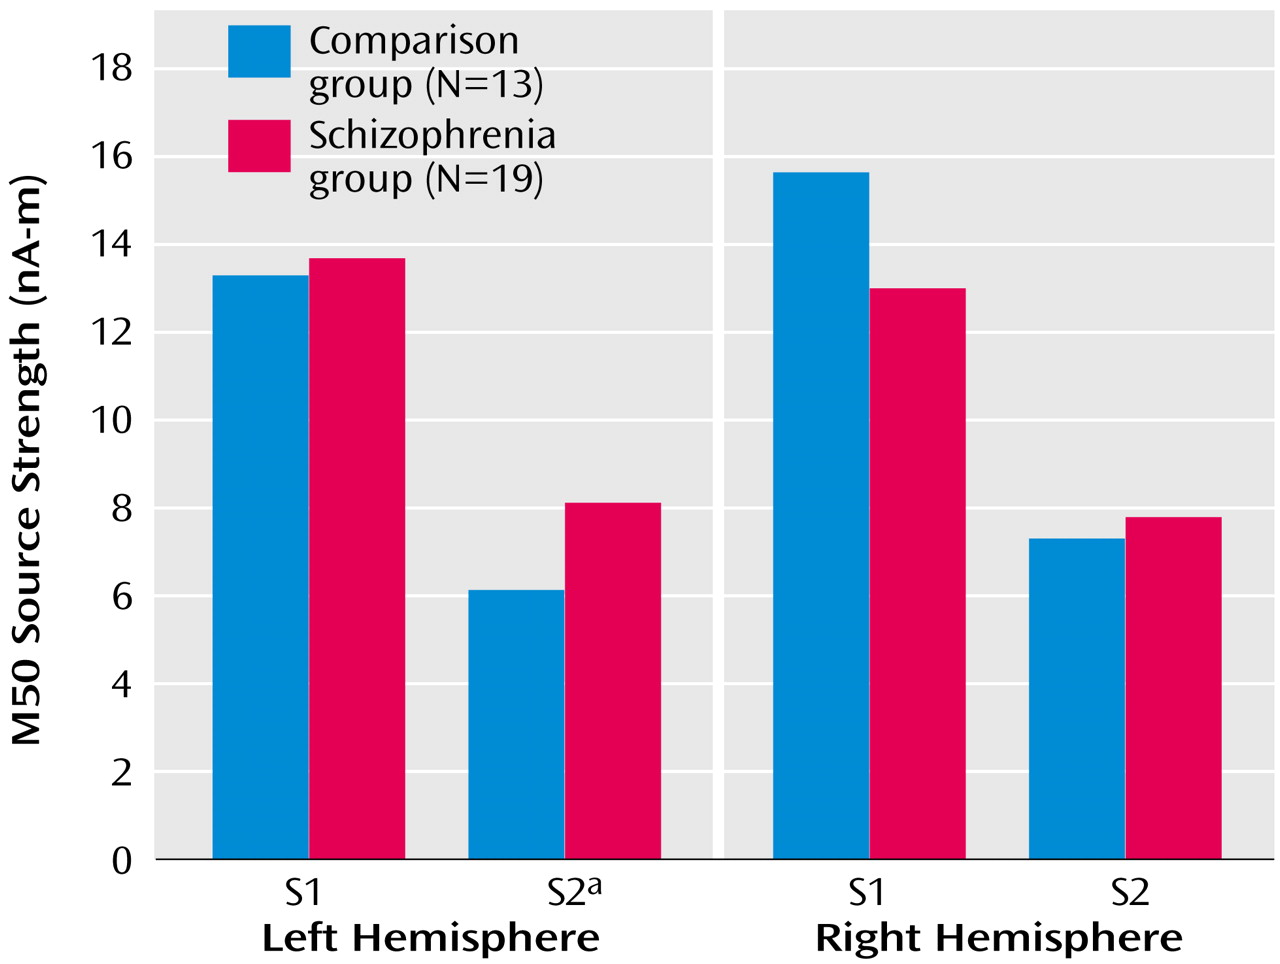
Figure 3). Univariate t tests were used to test group effects on source strengths, and patients’ left S2 source strength reliably exceeded that of comparison subjects (
Figure 4), suggesting a primary role for left hemisphere S2 in group differences in conventional sensory gating ratios.
Figure 4 shows mean S1 and S2 M50 source strength separated by group. The three-way hemisphere-by-stimulus-by-group interaction was not statistically significant, however (F=0.36, df=1, 29, p=0.50).
Source dipole latencies were examined with a hemisphere-by-stimulus-by-group repeated-measures ANOVA. There was no main effect for hemisphere (F=1.25, df=1, 29, p=0.27), stimulus (F=0.009, df=1, 29, p=0.93), or group (F=0.16, df=1, 29, p=0.69). However, there was a stimulus-by-group interaction (F=5.71, df=1, 29, p=0.02), with patients having earlier latencies for S2 (mean=56.1 msec [SD=10.9]) than S1 (mean=57.1 msec [SD=10.2]), while comparison subjects had earlier latencies for S1 (mean=57.4 msec [SD=10.7]) than S2 (mean=58.5 msec [SD=10.8]).
In every subject, M50 dipolar sources localized either to the primary auditory cortex or the nearby superior temporal gyrus. Dipole position, expressed in terms of distance (mm) on the x (left versus right), y (front to back), and z (up and down) axes from the center of the spherical head model, were examined separately for each hemisphere. The axis coordinate values were calculated for the left and right hemispheres in the comparison subjects (x: mean=–51.12 [SD=7.81] and 49.19 [SD=6.63], respectively; y: mean=–0.64 [SD=9.9] and 4.91 [SD=8.80]; z: mean=54.3 [SD=6.14] and 52.35 [SD=8.74]). Similar values were calculated for the patient group (x: mean=–47.44 [SD=7.98] and 53.34 [SD=7.63]; y: mean=1.56 [SD=9.68] and 6.51 [SD=7.46]; z: mean=50.22 [SD=6.89] and 51.66 [SD=11.07]). Repeated-measures multivariate ANOVA (MANOVA) with x, y, and z as dependent, within-subject measures found no group difference for dipole position in left (F=0.12, df=1, 28, p=0.73) or right (F=0.86, df=1, 28, p=0.36) hemisphere.
Repeated-measures MANOVA was used to test for between-group differences in MEG source strength in each of the three axes. There was a main effect for hemisphere (F=16.59, df=1, 29, p<0.001), a main effect for axis (x, y, z) (F=12.88, df=2, 27, p<0.001), and a main effect for their interaction (F=15.72, df=2, 27, p<0.001), but no significant main effects or interactions involving group (
Figure 4 shows group mean source strength values).
EEG-MEG Correlations
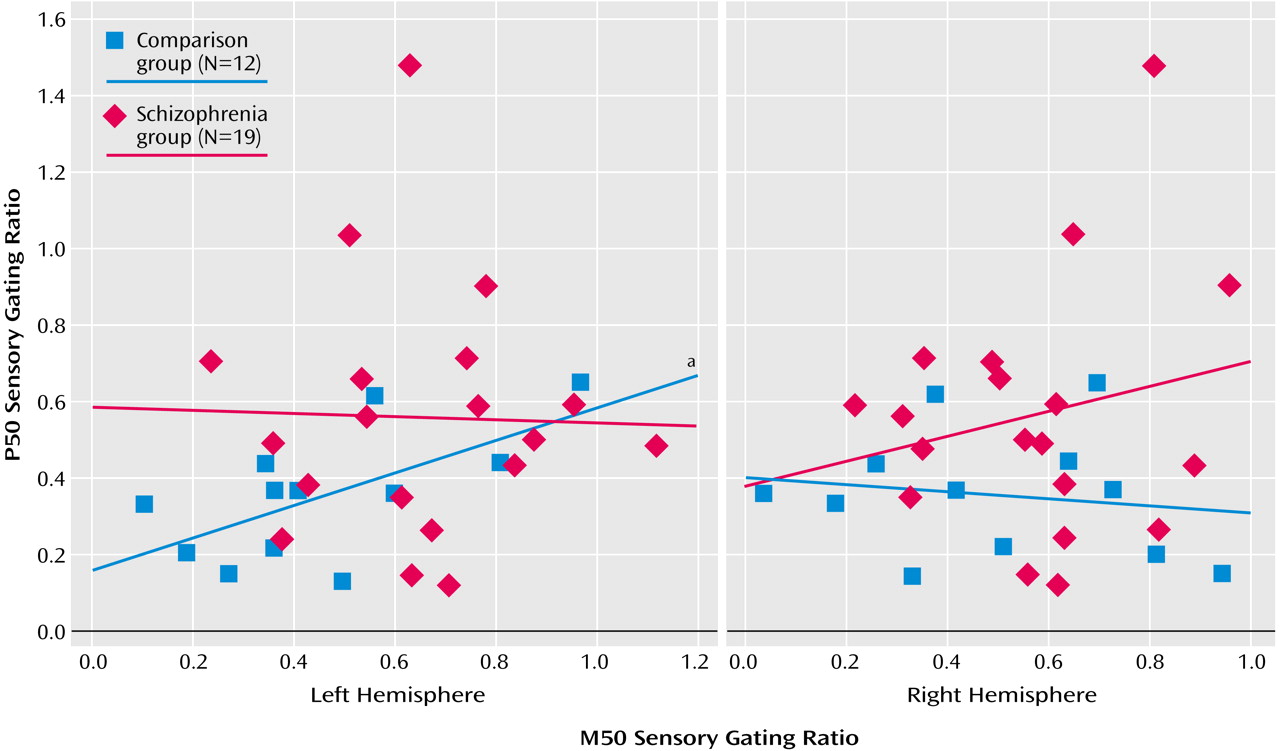
For comparison subjects, the P50 sensory gating ratio correlated positively with the left M50 sensory gating ratio (
Figure 5) but not with the right M50 sensory gating ratio (r=–0.16, df=10, p=0.61). For patients there were no significant correlations between the left (r=–0.02, df=17, p=0.92) or the right (r=0.20, df=17, p=0.41) M50 gating ratios and the P50 gating ratio (
Figure 5).
Neuropsychological Factors and Sensory Gating
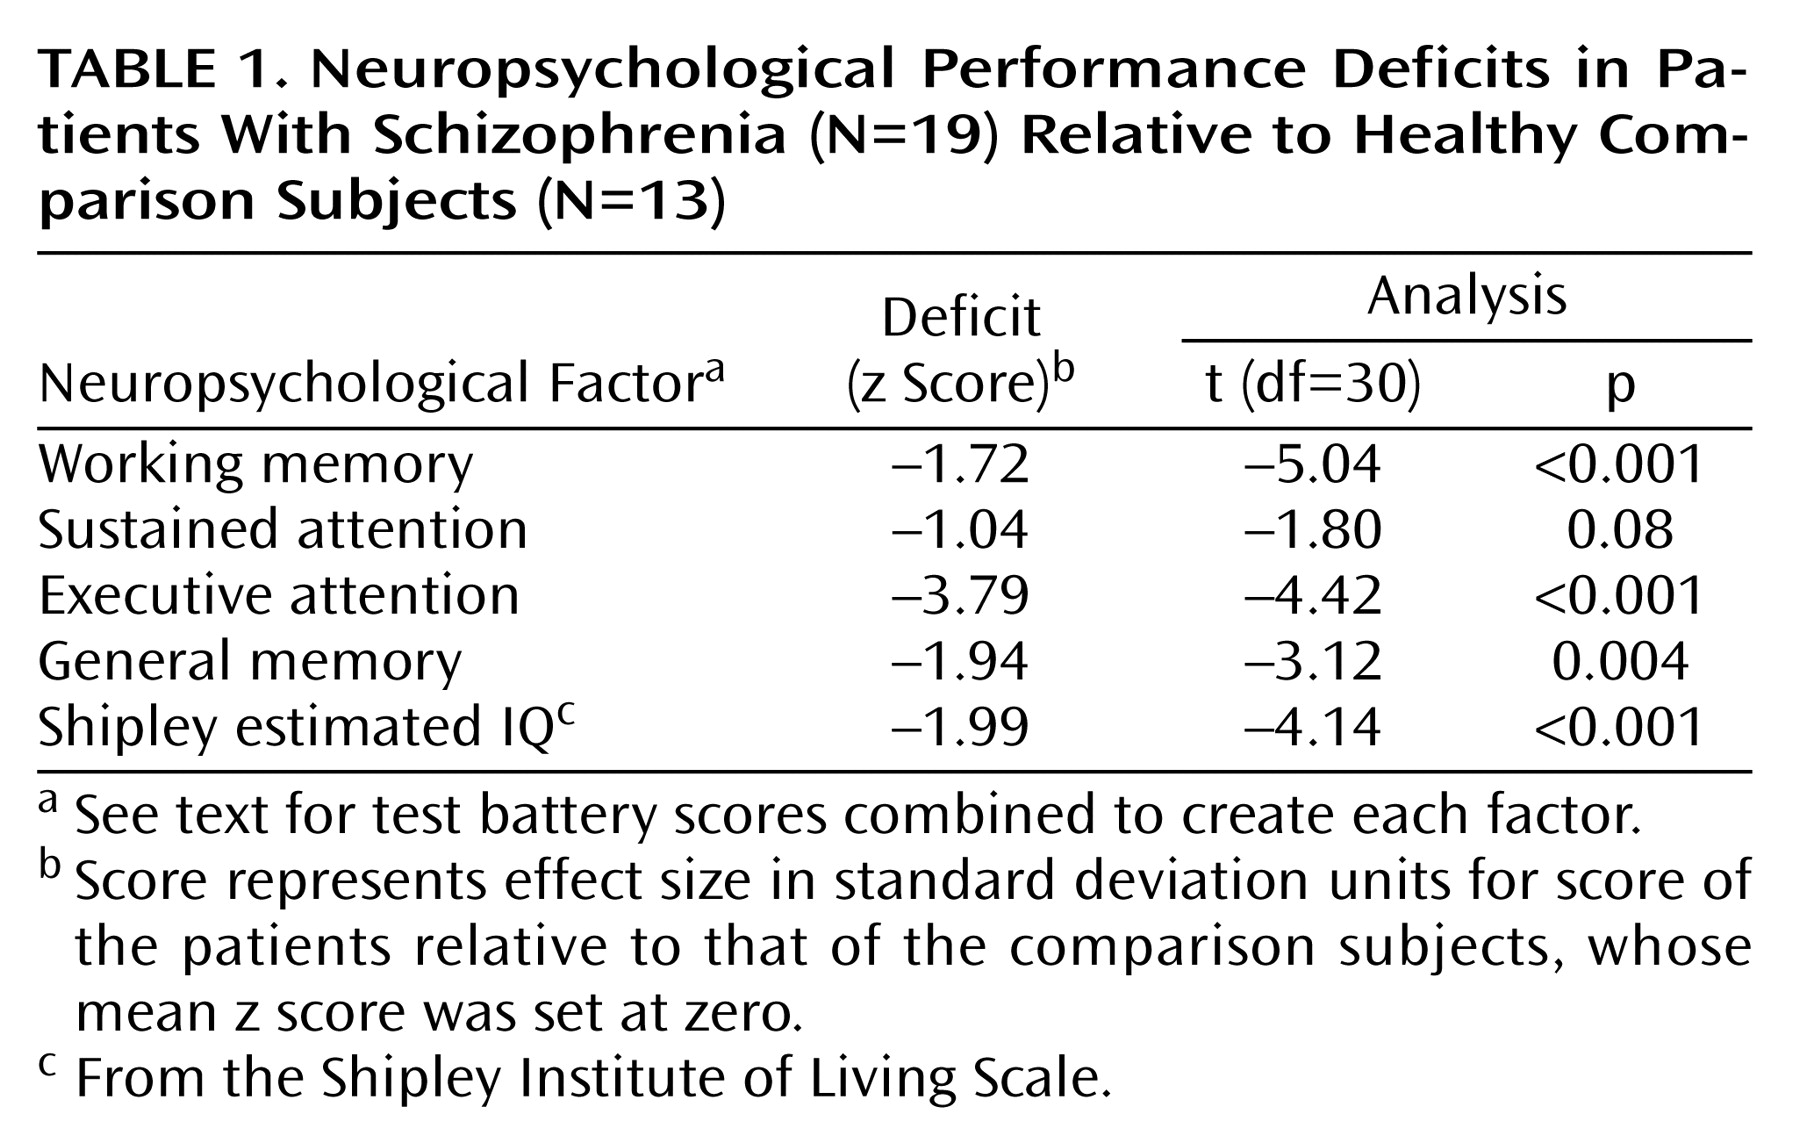
Across all neuropsychological factors, patients demonstrated lower factor scores (
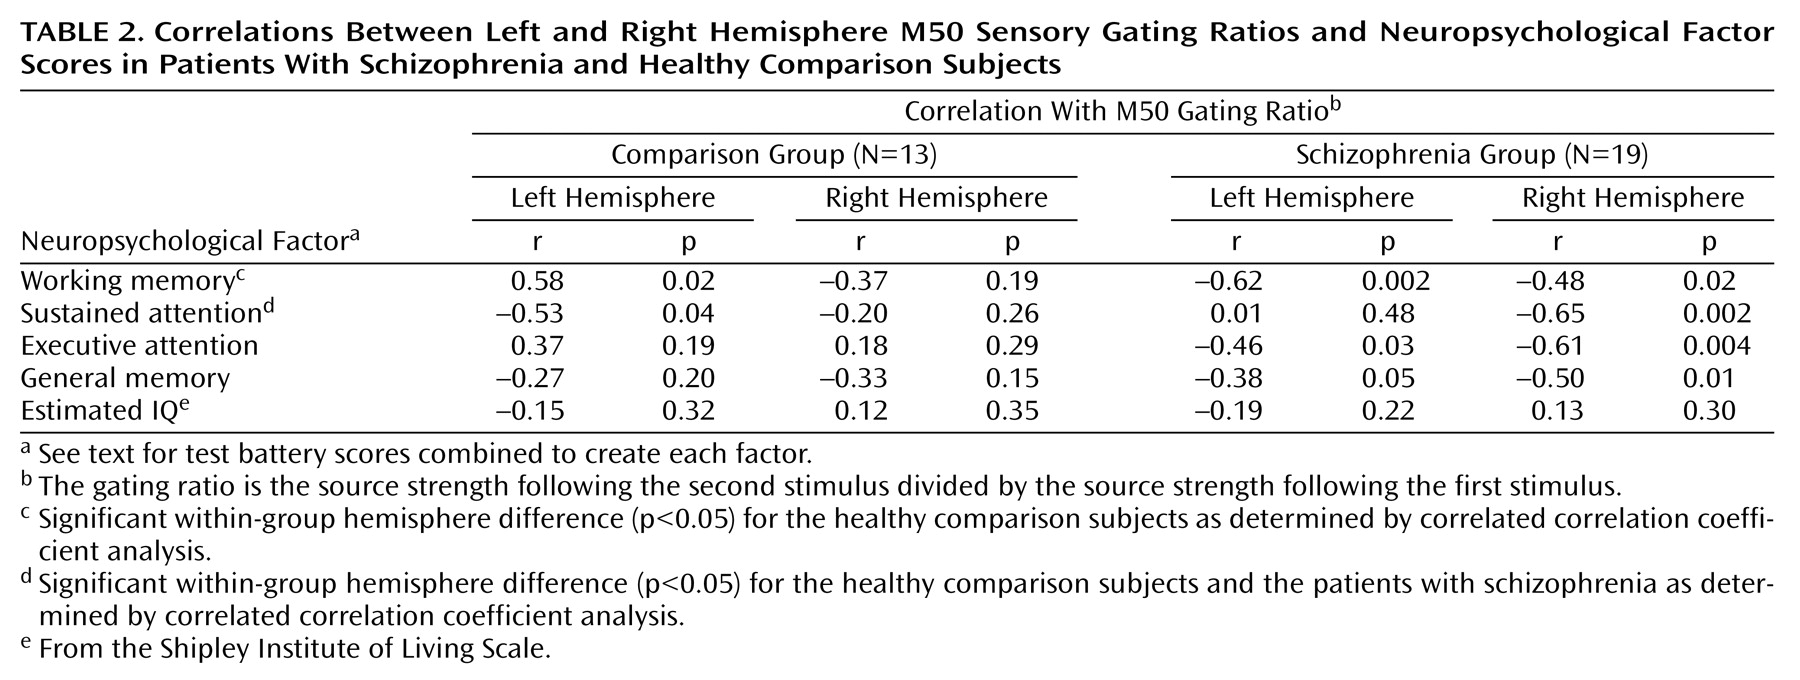
Table 1). Because group differences on neuropsychological tests may reflect qualitatively different brain functioning, correlations between neuropsychological and neurophysiological variables were examined separately for each group.
Shapiro-Wilk tests indicated that the distribution of scores was normal for all neuropsychological factors and M50 gating ratios within each subject group. No correlations between M50 S1 and S2 amplitudes and neuropsychological factor scores approached significance, nor did any EEG measures (S1 and S2 amplitudes, S1 and S2 latencies, or sensory gating ratios) correlate with neuropsychological factor scores.
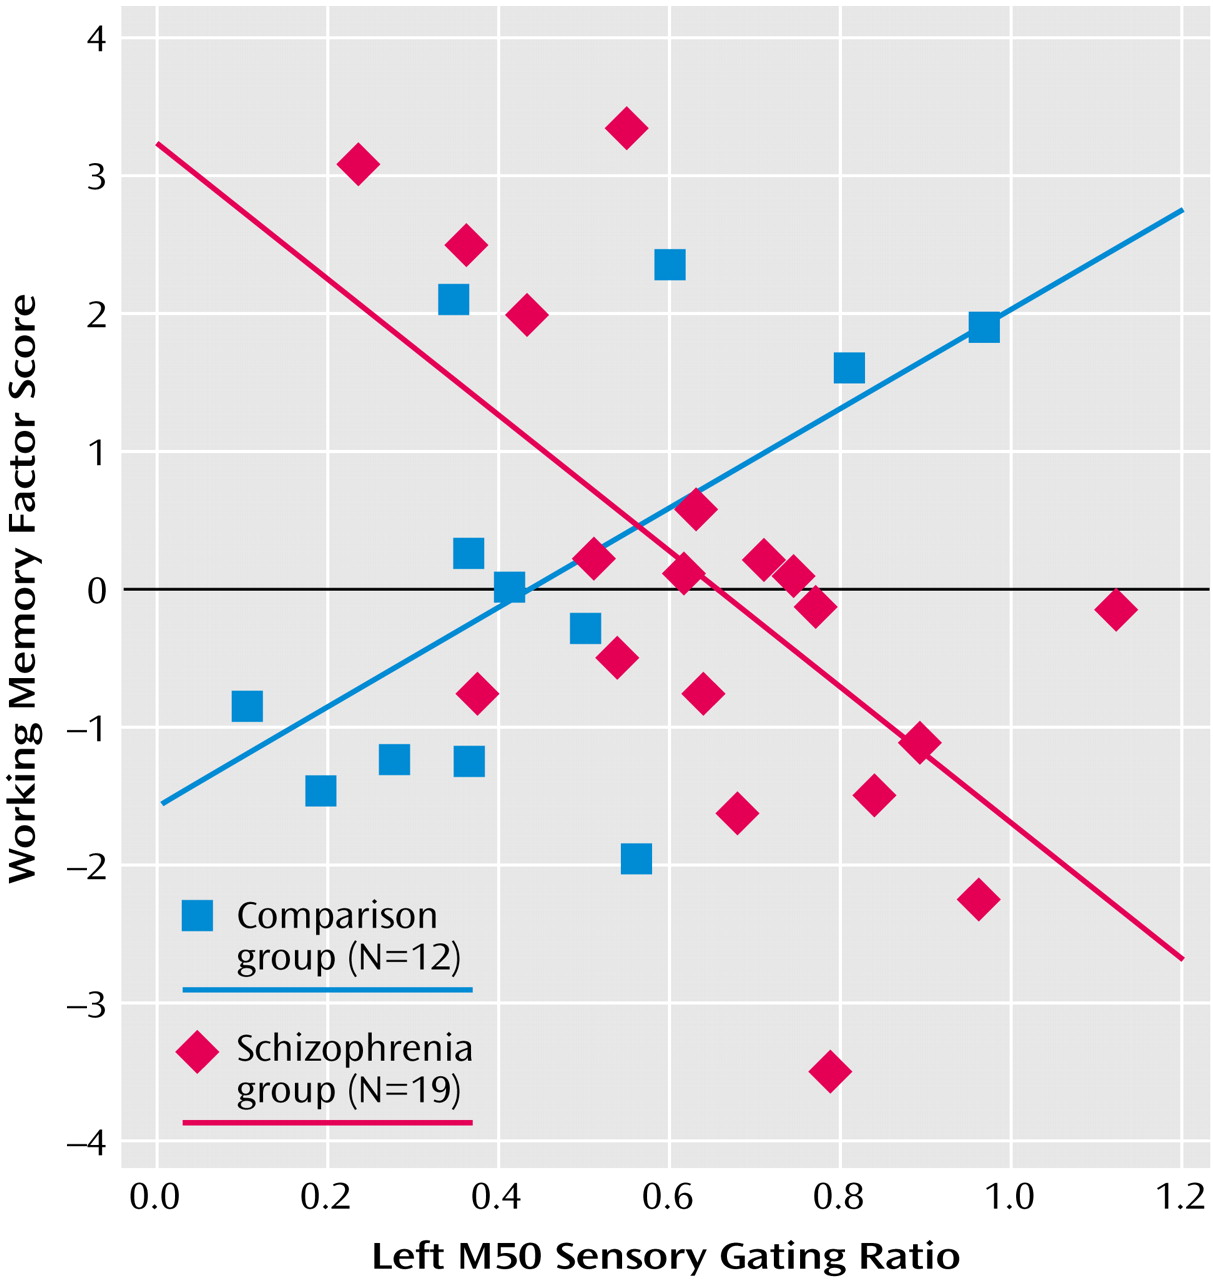
Table 2 compares neuropsychological factor score correlations with left- and right-hemisphere M50 gating ratios. In comparison subjects, the sustained attention factor score correlated negatively with the left but not right M50 sensory gating ratio, whereas the working memory factor correlated positively with the left-hemisphere but not right-hemisphere M50 gating. Patients showed the opposite laterality pattern, with sustained attention correlating negatively with right hemisphere M50 gating. Executive attention, working memory, and general memory factor scores correlated with both left and right M50 sensory gating ratios in the patients with schizophrenia.
Figure 6 shows a sample comparison of the differences between correlations between groups.
Discussion
Simultaneous recording of EEG and MEG during a paired-click paradigm allowed evaluation of MEG as a means of assessing gating deficits in schizophrenia and examination of possible hemispheric lateralization of gating and of gating deficits. Relationships between sensory gating measures and neuropsychological performance were also investigated in order to explore the functional significance of gating deficits. Comparison subjects had smaller P50 sensory gating ratios than did patients, replicating a large body of research (e.g., references
1,
4,
6,
7,
9,
11–14). M50 sources localizing to the superior temporal gyrus showed gating ratios similar to the EEG-assessed P50 gating ratio. It is important to note that MEG indicated that this group difference was confined to the left hemisphere. This specificity was obtained without group differences in M50 source latency, dipole location, or current orientation, suggesting that these potential confounds were not a factor.
For comparison subjects, P50 ratio correlated with left but not right M50 ratio. In contrast, for patients, neither left nor right M50 ratio correlated with P50 ratio. This pattern further suggests that the gating deficit in schizophrenia reflects an abnormality specifically in left superior temporal gyrus function. In a detailed examination of the P50/M50 S1 generator in which a subset of the subjects recruited here was used, we found that in the comparison subjects the left- and right-hemisphere superior temporal gyrus sources of M50 together contributed 97% of the variance in P50 assessed at Cz
(23). In contrast, in patients the M50 superior temporal gyrus sources accounted for only 87% of the P50 variance. It is possible that some of the lost variance in the patient group is accounted for by neural activity invisible to MEG sensors or by a non-superior-temporal-gyrus source that is more active in patients. In any case, this result considered together with the current findings suggests a functional pathology in left-hemisphere processing of S1, presumably antecedent to the failure of inhibition of S2 in patients.
In the comparison group, correlations were found between left but not right M50 sensory gating ratios and behavioral measures of sustained attention and working memory. Some investigators hypothesize that “downstream” processes involving executive functions are not able to function effectively in the presence of poor perceptual inhibition (higher sensory gating ratios) because frontal systems are overwhelmed by redundant sensory information. Present correlational analyses allow some speculation about possible connections between these regions. Left M50 gating was negatively correlated with the sustained attention factor and positively with working memory. That is, “better” gating predicted better downstream performance on tests of sustained attention but poorer performance on tests requiring more complex executive functioning. This finding undermines one-dimensional hypotheses regarding downstream effects. Furthermore, it raises a question about assumptions regarding clinical value judgments about the role of sensory gating. It may be that for some cognitive functions, successful performance requires enhanced sensory gating, whereas others are fostered by reduced gating. A second possible interpretation regards the modality of sensory processing for the various neuropsychological tests. The sustained attention factor (negatively correlated with M50 gating) was derived primarily from Continuous Performance Test subscores that rely on visual sustained attention. Digit Span backward and the Auditory Consonant Trigrams, the primary component scores of the working memory factor, rely on auditory information.
Although it is not presently clear what factors drive the correlations observed in the comparison group, it is clear that this pattern of relationships does not hold in patients with schizophrenia. First, the sustained attention score correlated with right rather than left M50 sensory gating, a pattern opposite to that of comparison subjects. All other neuropsychological factor scores were correlated with bilateral M50 gating ratios.
The correlations between auditory sensory gating assessed on superior temporal gyrus and measures of working memory and attention—cognitive abilities found to primarily rely on frontal brain areas—suggest the action of a frontotemporal network. In primate studies, the prefrontal cortex has been shown to have extensive connections with the superior temporal gyrus
(70,
71). Knight and colleagues
(72) showed atypical auditory sensory gating in patients with lateralized lesions to the dorsolateral prefrontal cortex but no effect on sensory gating in patients with orbitofrontal lesions. They proposed that the frontal control of temporal lobe function was hemisphere-specific on the basis of the laterality of the dorsolateral prefrontal cortex lesion. Present data are consistent with this hypothesis to the extent that the sustained attention and working memory tests reflect dorsolateral prefrontal cortex function in the comparison subjects. Crow and colleagues
(73,
74) have suggested that the deficit in schizophrenia is based primarily on pathology of the left hemisphere. Others (e.g., reference
75) have suggested more specifically that the source of the deficit is a frontotemporal disconnection. Still others have argued that inefficient information processing results from atypical lateralization of modular cognitive functions in schizophrenia (e.g., reference
76). Present results support the view that a frontotemporal disconnection specific to the left hemisphere accounts for lack of typical (reversed or reduced) lateralized functional relationships in patients with schizophrenia.
There were no correlations between neuropsychological factor scores and any EEG variables, including S1 and S2 amplitude and sensory gating ratio. M50 ratio scores produced several correlations with neuropsychological performance measures, but no relationships were found with M50 S1 or S2 source strengths in either hemisphere. These differences between EEG and MEG are likely due to the fact that while P50 amplitude reflects activity from multiple brain regions, including both left- and right-hemisphere superior temporal gyrus activity, M50 measures reflect activity from focal sources, allowing a more direct comparison of focal brain activity and neuropsychological measures. In addition, the presence of correlations between neuropsychological measures and M50 gating ratios and the absence of similar correlations with M50 source strengths support the use of the ratio approach to assessing sensory gating.
Conclusions and Caveats
It is likely that EEG and MEG each provide unique information in auditory sensory gating studies. Although EEG-assessed sensory gating has proven valuable in differentiating patients with schizophrenia from comparison subjects, the hemispheric specificity of the gating deficit was unknown, and P50 gating has not been consistently related to cognitive deficits found in schizophrenia. Principal results of the present study were that 1) M50 superior temporal gyrus sources demonstrated gating ratios similar to that of P50; 2) patients showed a P50 sensory gating deficit; and 3) left-hemisphere, but not right-hemisphere, M50 gating ratio correlated with P50, differentiated patients and comparison subjects, and correlated differently with neuropsychological measures of attention and working memory in patients and comparison subjects.
Although the correlations reported here between neuropsychological factors and gating ratios were computed with small groups and should be interpreted with caution, the fact that MEG-assessed auditory sensory gating shows hemisphere-specific relationships with neuropsychological measures attests to the promise of this neuroimaging method for isolating cognitively meaningful brain activity. Further, these results suggest hypotheses for future research examining both the mechanisms and the functional consequences of gating dysfunction.
