Medial temporal lobe structures (the hippocampus and amygdala) have been consistently implicated in the etiopathology of schizophrenia
(1). Neuropathological studies of the entorhinal cortex to date are limited by the subjectivity in discerning the qualitative nature of pathology because the entorhinal cortex normally exhibits cytoarchitectural heterogeneity
(2). Some studies reported no difference between subjects with schizophrenia and healthy subjects
(3,
4), but others have reported differences in entorhinal neuronal density
(5,
6), number
(7), and size
(8), as well as differences in positioning of pre-alpha cell clusters
(3,
7) between subjects with schizophrenia and healthy subjects. Because of the conflicting nature of these neuropathological reports, we need to examine in vivo morphological changes using magnetic resonance imaging (MRI).
Associating psychotic symptoms with specific structures helps elucidate the neurobiology of psychiatric disorders in which these symptoms occur. For example, auditory hallucinations have been correlated with a smaller left anterior superior temporal gyrus
(9); this finding is supported by the functional imaging studies that suggest abnormalities in detecting inner speech
(10). Such studies on the strategically situated entorhinal cortex are sparse. The entorhinal cortex acts as a relay station between the prefrontal cortex and hippocampus, functioning as a component of the novelty detection circuit
(11) comprising the prefrontal cortex, hippocampus, parahippocampus, and cingulate. The entorhinal cortex functions as a multilevel buffer
(12), holding “real sensory” information while the hippocampus compares it with internal representations to detect “familiarity” versus “novelty”
(13,
14). The entorhinal cortex is involved in processing episodic
(15), autobiographical
(16), and recognition
(17) memory and in associative learning
(18). Entorhinal cortex pathology could affect these functions and has been hypothesized to be involved in the etiopathology of symptoms of schizophrenia
(12,
13).
A few in vivo MRI studies have examined the entorhinal cortex in schizophrenia. One study
(19), which used 5-mm slices in a mixed group of patients with early-course and chronic schizophrenia, reported no abnormality. Another study
(20), which examined neuroleptic-naive patients experiencing their first episode of schizophrenia, reported smaller entorhinal cortex in the patients with no correlation to symptoms. Another study
(21) reported smaller entorhinal cortex in patients with schizophrenia but not in patients with bipolar disorder compared with healthy subjects, suggesting some specificity for a smaller entorhinal cortex in schizophrenia. Studies of previously untreated patients are important because of the potential effects of antipsychotics and illness chronicity on regional brain volumes
(22,
23).
Method
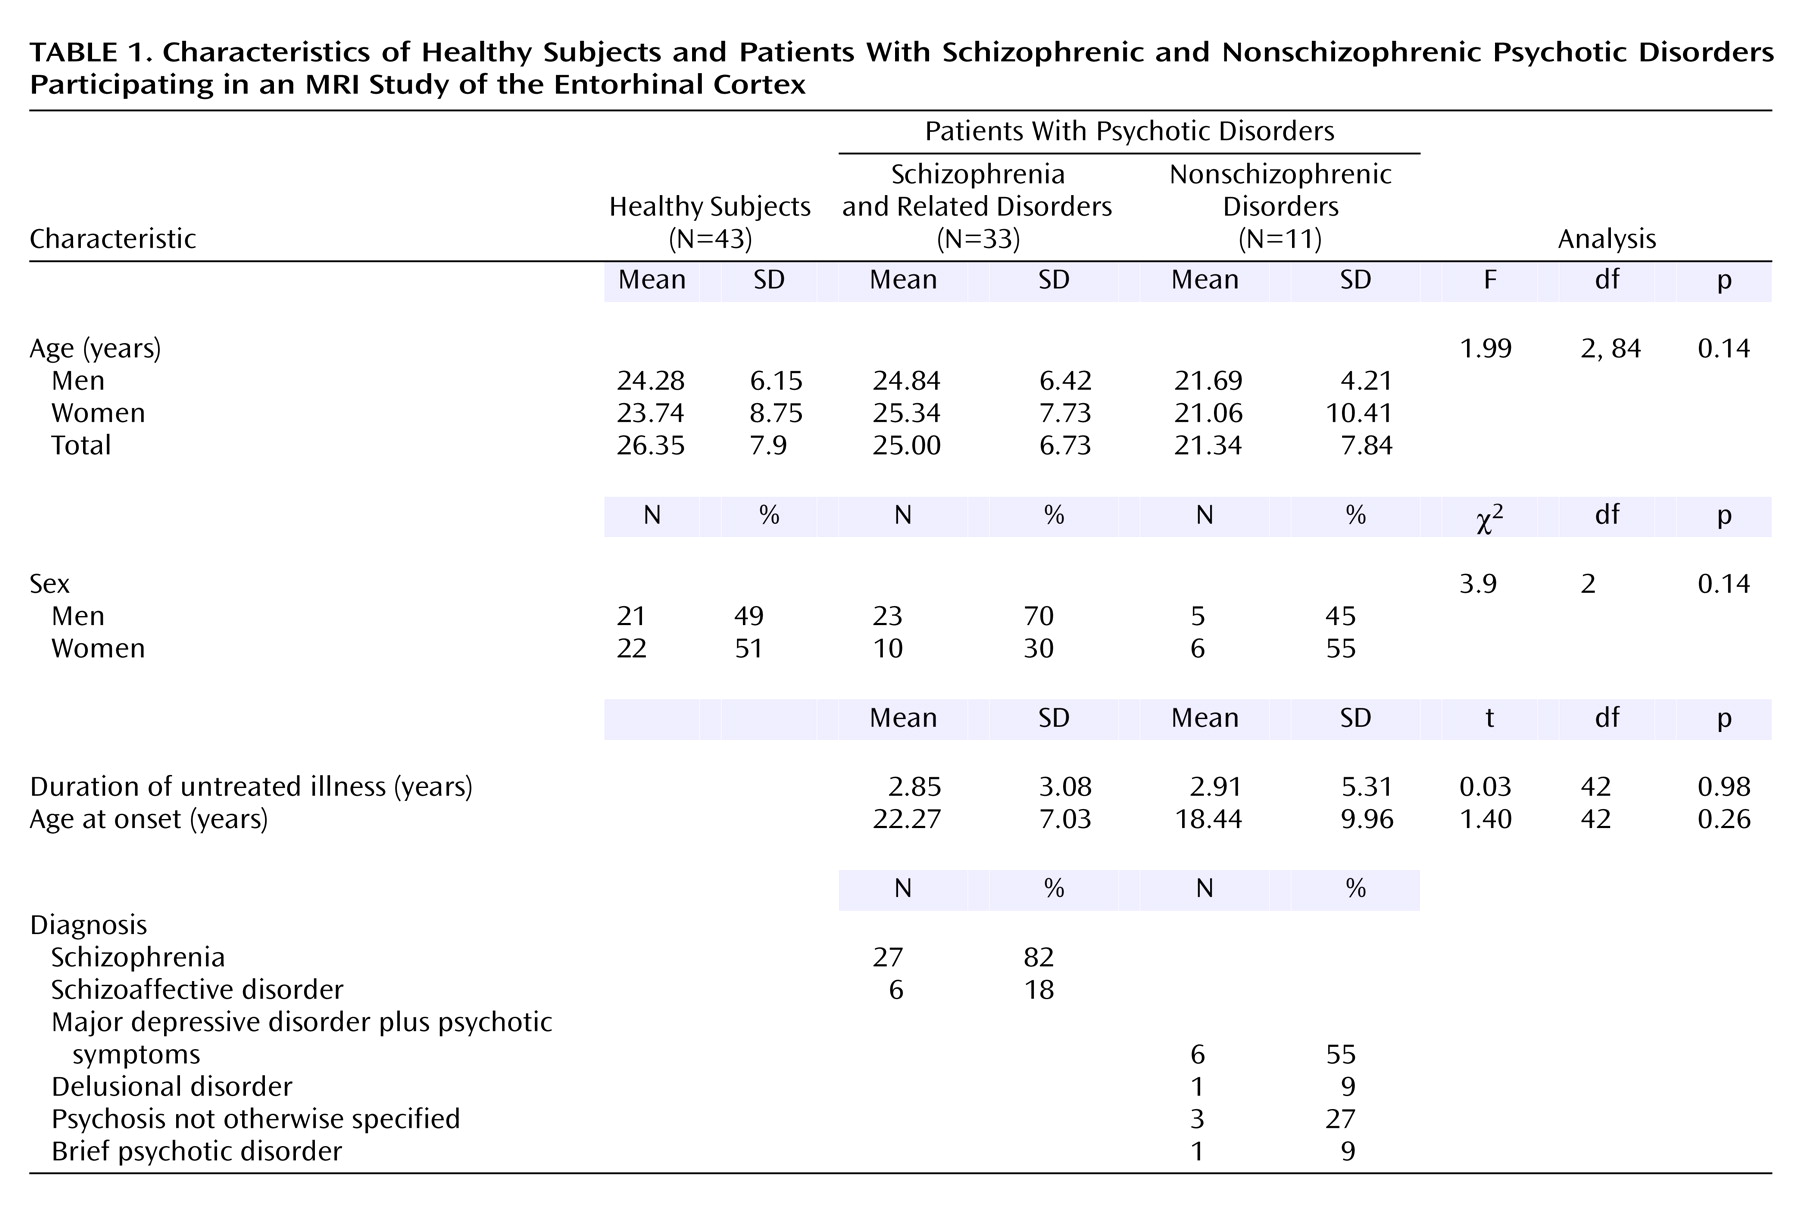
A series of 44 consecutive neuroleptic-naive patients experiencing their first episode of DSM-IV psychotic disorder were recruited from inpatient and outpatient facilities of the Western Psychiatric Institute and Clinic in Pittsburgh. Thirty-three of the patients had schizophrenia or related disorders and 11 had nonschizophrenic psychotic disorders (
Table 1). Healthy comparison subjects (N=43) were recruited through local advertisements. After fully explaining the experimental procedures, written informed consent was obtained from both the patients and the healthy subjects. The Institutional Review Board of the University of Pittsburgh approved the study. The DSM-IV diagnoses were derived following a consensus conference involving senior diagnosticians using all data from medical records.
All diagnoses were confirmed after patients were followed up for at least 6 months. None of the subjects had a history of substance use disorder within the past month, and none had serious medical or neurological illness. All subjects had an IQ of at least 75 and were scored on the Scale for the Assessment of Positive Symptoms (SAPS)
(24) and the Scale for the Assessment of Negative Symptoms (SANS)
(25) for symptom severity.
MRI scans were acquired by using a GE 1.5-T whole body scanner (GE Medical Systems, Milwaukee); the parameters are described elsewhere
(26). Images with motion/inhomogeneity artifacts were not included for the volumetric measurement of the entorhinal cortex. Intracranial volume was measured by using a previously described method
(26) and had an interrater reliability (intraclass correlation coefficient [ICC]) of 0.88. Manual tracing of the entorhinal cortex was performed on images realigned along the anterior commissure-posterior commissure line on coronal, sagittal, and axial planes on BRAINS2 software
(27). In a set of 10 randomly selected scans, ICC=0.87 (right entorhinal cortex) and ICC=0.85 (left entorhinal cortex) for interrater reliability and ICC=0.99 (right entorhinal cortex) and ICC=0.94 (left entorhinal cortex) for test-retest reliability. The investigators were blind to the clinical data while measuring the entorhinal cortex volume and intracranial volume.
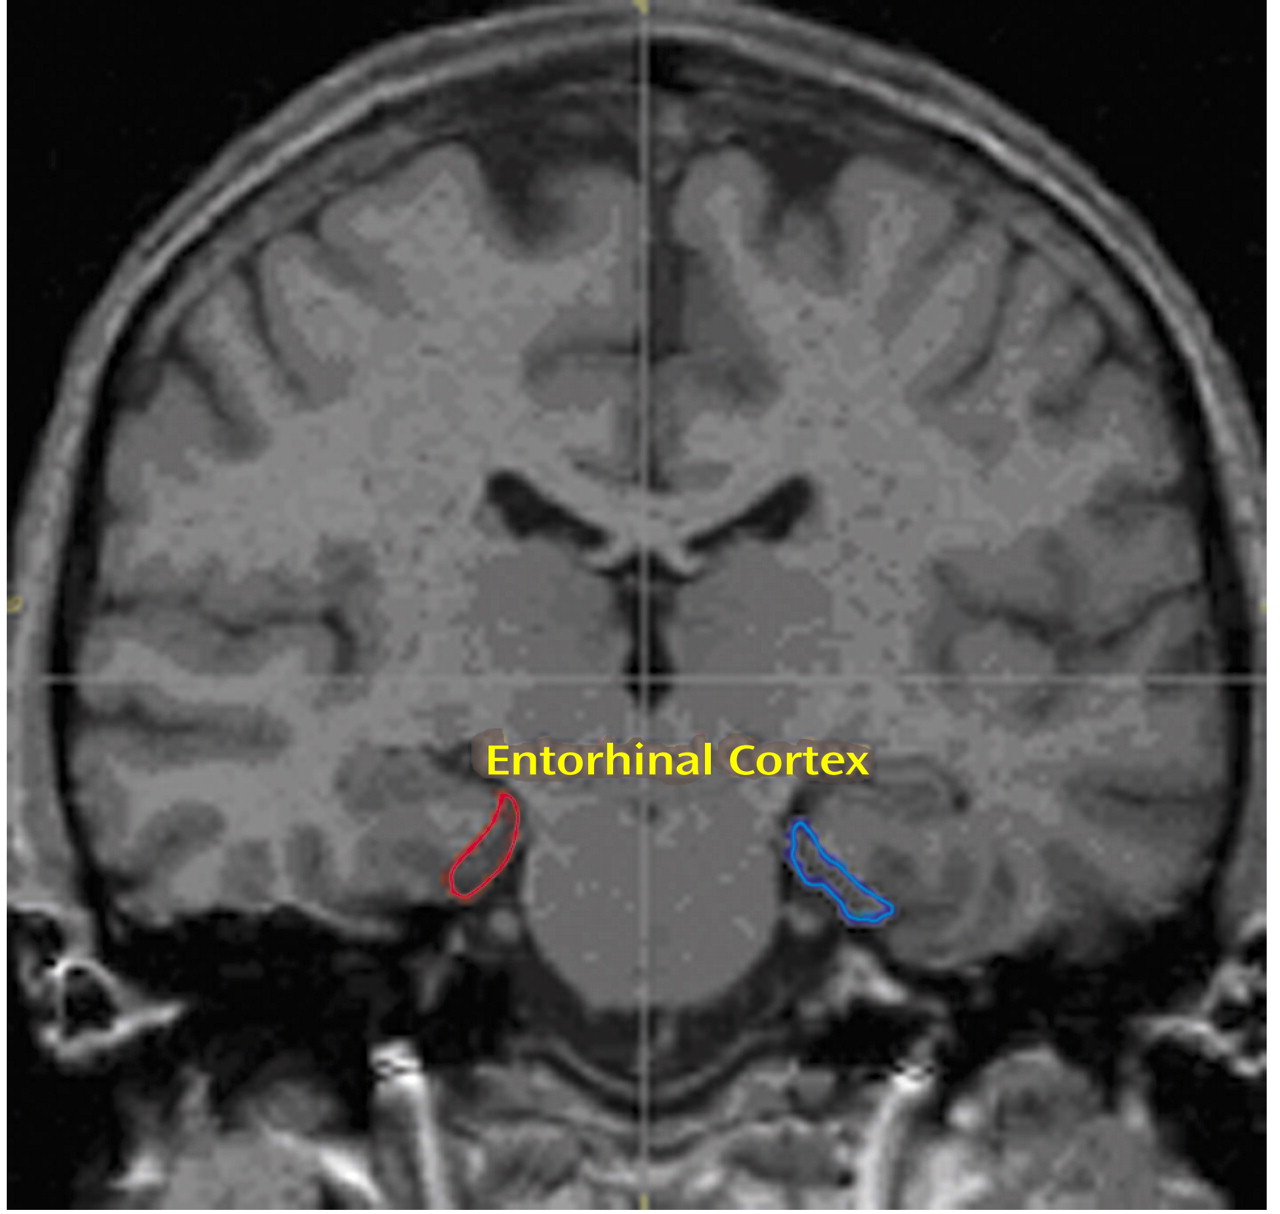
The entorhinal cortex was traced by using a previously published method
(28) that was validated by detailed correlations with the cytoarchitecture and gross anatomy of the entorhinal cortex. Briefly, the structure was defined anteriorly at the appearance of the frontotemporal stem and inferolaterally by extending the line along the gray-white junction until its intersection with the medial bank of the collateral sulcus. Superomedially, we used the sulcus semiannularis rostrally and the uncal cleft caudally; wherever these structures were poorly defined, we used the intersection of the line along the gray-white junction with the cortical surface (
Figure 1).
The transition of the hippocampal head into the body that coincides with the lateral geniculate body, used elsewhere
(28) as the posterior limit of entorhinal cortex, was poorly defined in many of our scans. For this reason, we modified the method to include an average of two slices posteriorly to end the tracing at one slice anterior to the first appearance of the superior colliculus.
To validate the entorhinal cortex tracings, seven randomly selected scans were referenced to the Talairach brain
(29) by using BRAINS2
(27). We randomly picked three points inside the tracings and three to four points at least 3 mm outside the tracings every fourth slice. Outside the entorhinal cortex, one point each was picked laterally, inferolaterally, and inferiorly. No points were picked medially because they would lie outside the brain tissue. In addition, two to three points were picked at least 3 mm beyond the anterior and posterior extents of the entorhinal cortex. The Talairach Daemon database was set to determine the gray matter locations within a 3-mm range of the stereotactic coordinates. The coordinates that corresponded to Brodmann’s areas 28 and 34
(30) were taken as the entorhinal cortex. The sensitivity for including the entorhinal cortex was 77.1%; specificity was 75.76%.
The entorhinal cortex volumes were adjusted for intracranial volume by including the ratio ([entorhinal cortex/intracranial volume]*100) as the dependent measure. Analysis of variance (ANOVA) was used to find differences among groups in the entorhinal cortex volume, followed by post hoc pairwise comparisons using Fisher’s least significant difference test.
The following variables were not normally distributed (Shapiro-Wilks test): age (p=0.006), age at onset (p=0.02), duration of untreated illness (p<0.0001), hallucination score (p=0.001) and delusion score (p=0.000001) on the SAPS, and negative symptoms score on the SANS (p=0.04). For this reason, we computed Spearman’s r to examine the correlation between the SAPS and SANS scores and entorhinal cortex volumes.
Results
Table 1 gives the demographic, clinical, and diagnostic characteristics of the subjects. We first compared the entorhinal cortex volumes across all three groups (patients with schizophrenic and nonschizophrenic psychotic disorders and healthy subjects) and then compared all patients with healthy subjects.
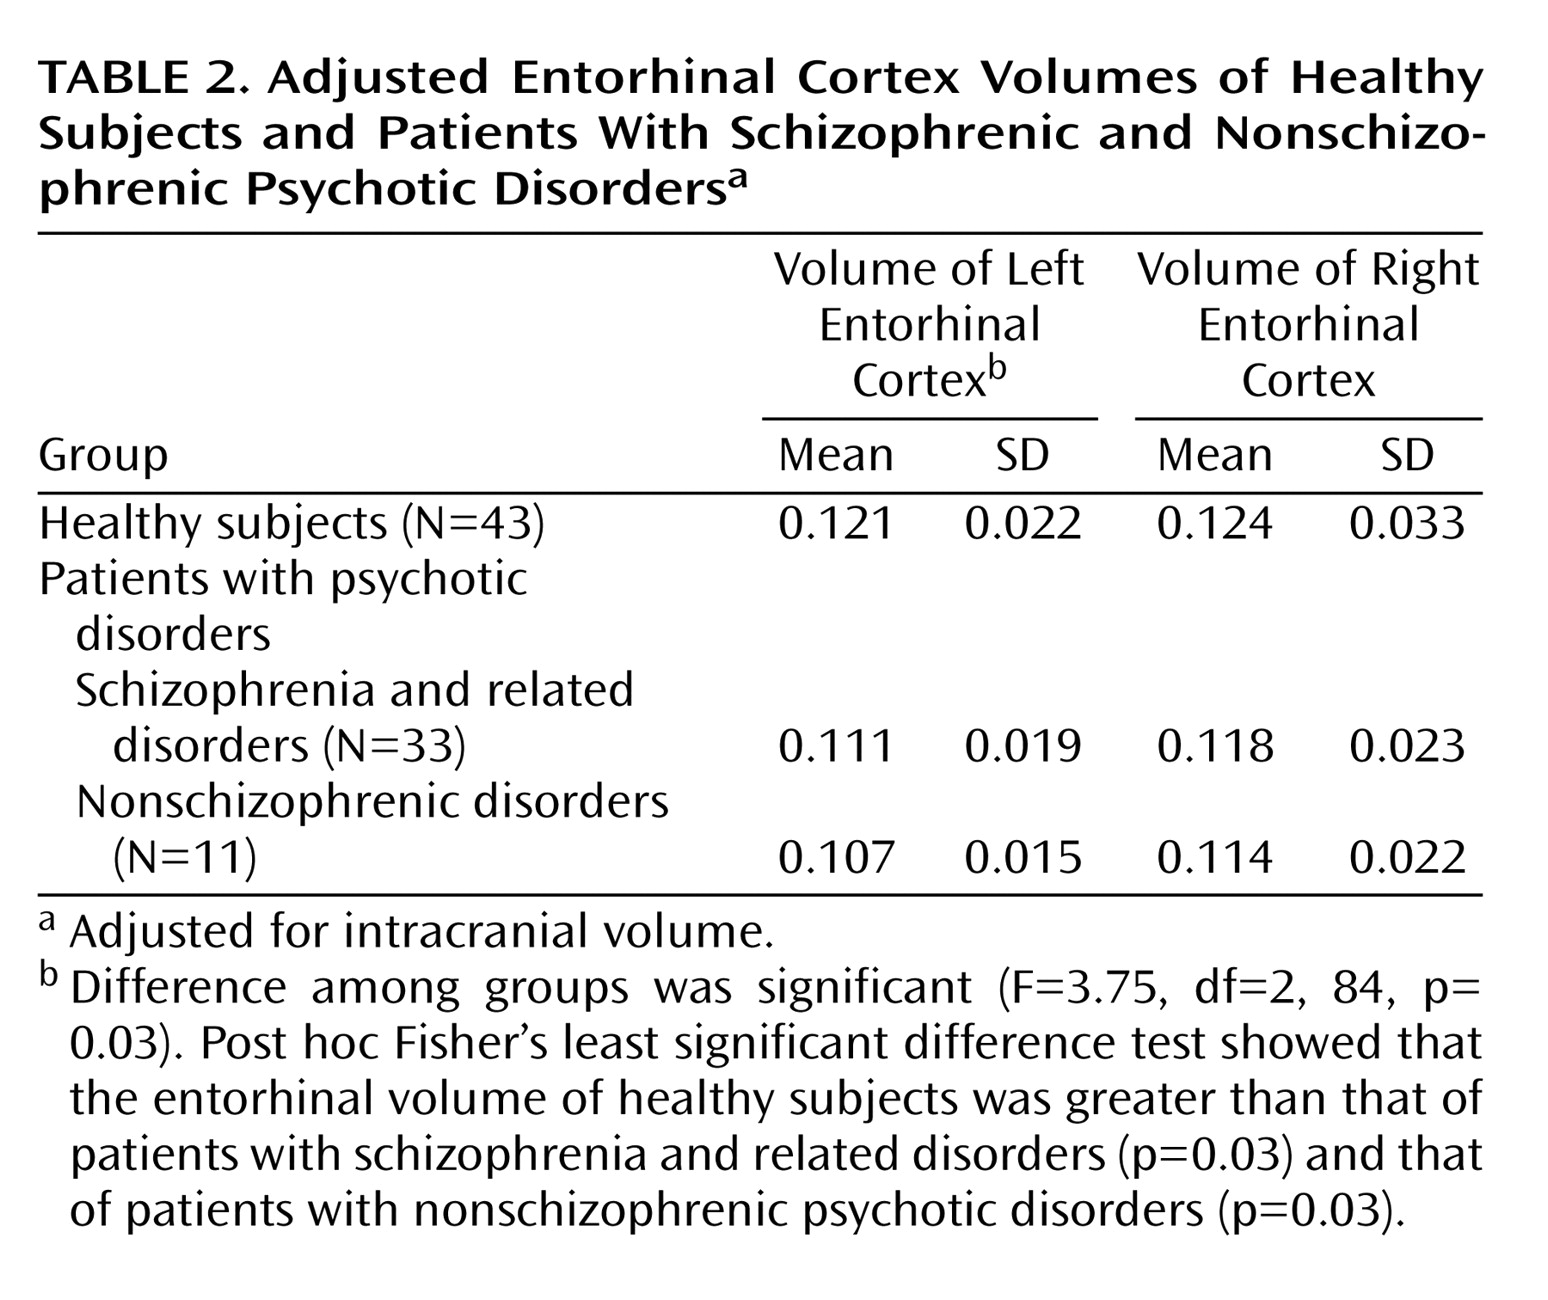
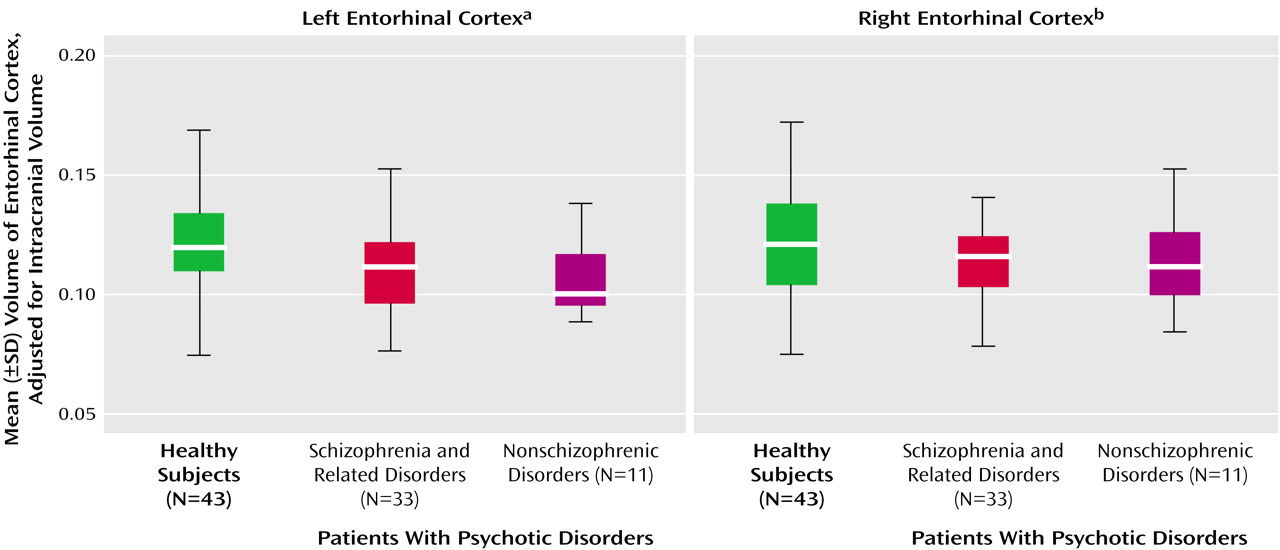
The difference among the three groups (patients with schizophrenic and nonschizophrenic psychotic disorders and healthy subjects) in adjusted left entorhinal cortex volume was significant, but the difference among groups in the right entorhinal cortex was not (
Table 1 and
Figure 2). Post hoc Fisher’s least significant difference tests revealed significantly smaller left entorhinal cortex in the patients with schizophrenic (–8.3%) and nonschizophrenic (–11.6%) psychotic disorders groups than in healthy subjects (
Table 2). The right entorhinal cortex volume was smaller by 4.8% in the patients with schizophrenic disorders and 8.1% in the patients with nonschizophrenic psychotic disorders, but the difference was not statistically significant. The patients with schizophrenic and nonschizophrenic psychotic disorders did not differ from each other in left (F=0.47, df=1, 42, p=0.5) or right (F=0.17, df=1, 42, p=0.68) entorhinal cortex volumes.
The left entorhinal cortex was smaller by 9.5% in the combined group of patients with psychotic disorders than in the healthy subjects (F=7.16, df=1, 85, p=0.009), and the right entorhinal cortex was smaller by 6.1% (F=1.59, df=1, 85, p=0.21).
In the group of patients with schizophrenic disorders, the entorhinal cortex volumes positively correlated with SAPS delusion scores (rs=0.50, N=33, p=0.004, for the right entorhinal cortex; rs=0.40, N=33, p=0.03, for the left entorhinal cortex), whereas negative symptoms and hallucinations did not. In the patients with nonschizophrenic psychotic disorders, the entorhinal cortex volumes did not correlate with any psychotic symptoms.
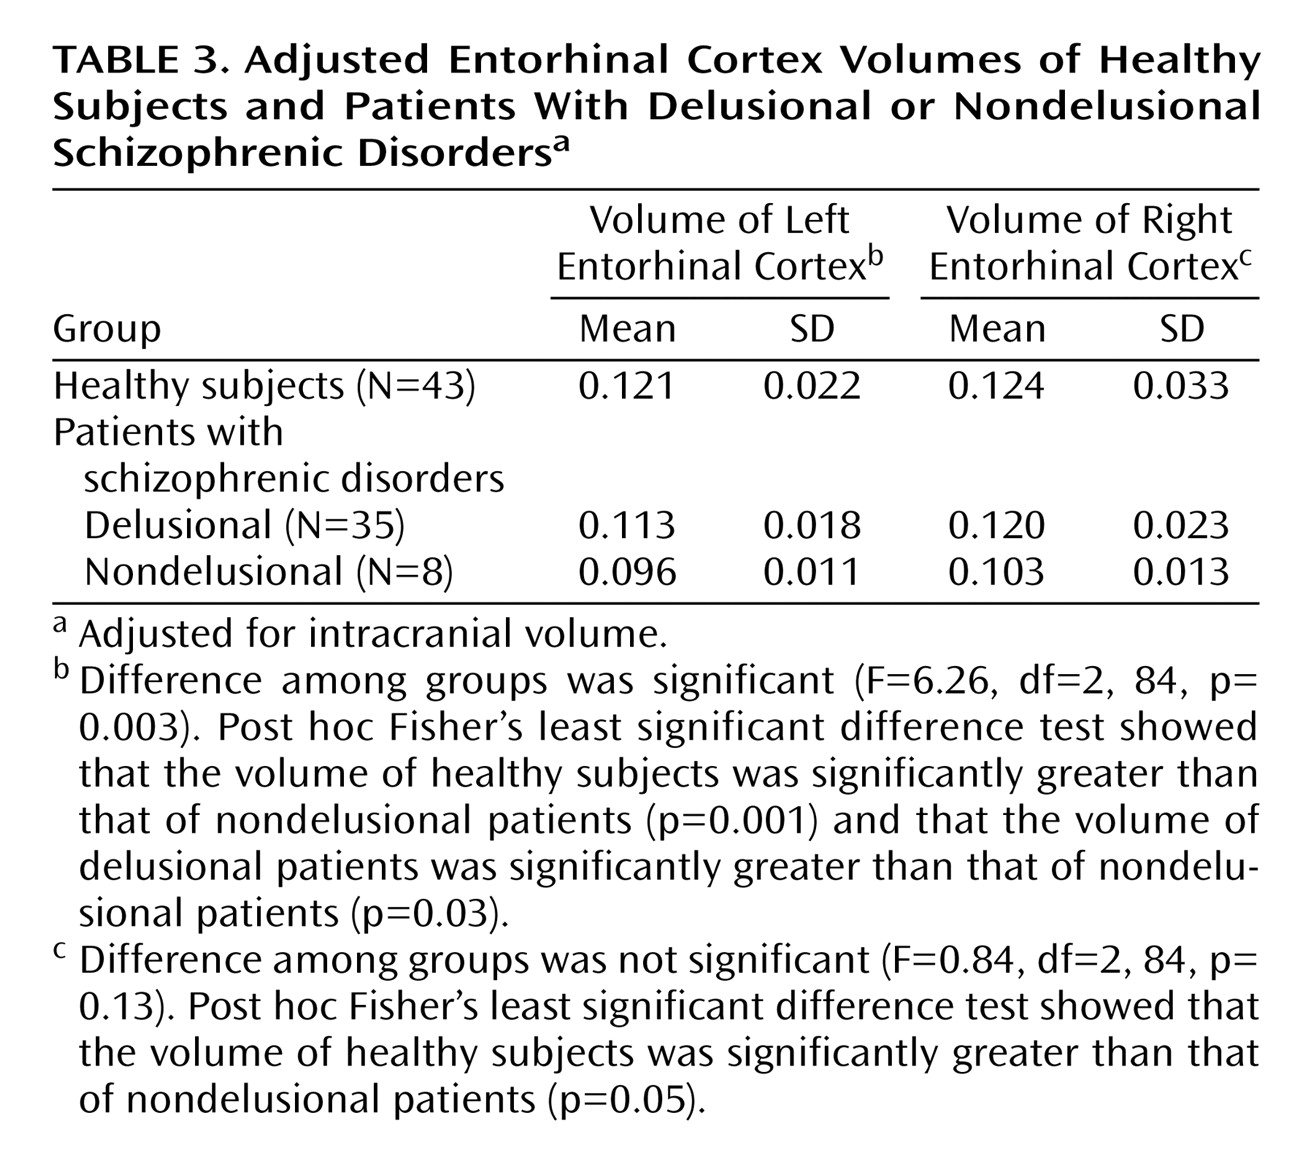
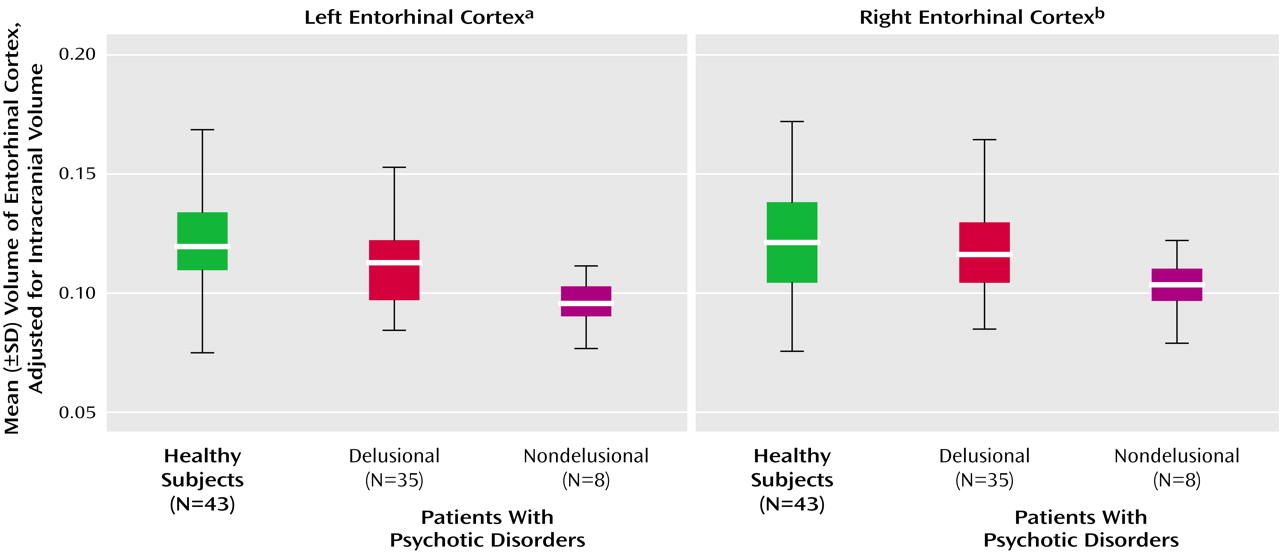
When we pooled all patients with psychotic disorders, the entorhinal cortex volumes positively correlated with SAPS total positive symptom scores (rs=0.33, N=44, p=0.04, for the left entorhinal cortex; rs=0.38, N=43, p=0.02, for the right entorhinal cortex), specifically with the delusion subscale (rs=0.42, N=44, p=0.005, for the left entorhinal cortex; rs=0.46, N=44, p=0.002, for the right entorhinal cortex), but not with SAPS hallucination scores. Psychotic patients were divided into those who were not delusional on the basis of their SAPS delusion scores (score of 0–2=nondelusional; score of 3–5=delusional). There was a significant difference among the nondelusional (N=8), delusional (N=35), and healthy subjects in left entorhinal cortex volume. (Delusion score was missing for one patient.)
Post hoc Fisher’s least significant difference tests revealed that the left entorhinal cortex was significantly smaller in nondelusional patients than delusional patients (–15%) and healthy subjects (–20.7%) and nonsignificantly smaller in delusional patients (–6.6%) than healthy subjects. The right entorhinal cortex was significantly smaller (–16.9%) in nondelusional patients than healthy subjects but not smaller than that of delusional patients (
Table 3 and
Figure 3). Entorhinal cortex volumes in patients with delusional or nondelusional psychotic disorders did not correlate with negative symptoms (r
s=0.26, N=43, n.s., for the left entorhinal cortex; r
s=0.06, N=43, n.s., for the right entorhinal cortex).
Discussion
The main finding of our study was that patients with schizophrenic and nonschizophrenic psychotic disorders had significantly smaller entorhinal cortex volumes than healthy subjects. This observation in the neuroleptic-naive patients experiencing their first episode of psychotic disorder suggests that the entorhinal cortex reductions may not be secondary to illness chronicity or neuroleptic exposure, supporting our first hypothesis. Our finding concurs with postmortem studies reporting a smaller entorhinal cortex in schizophrenia
(7) and may reflect changes in the entorhinal neuronal number, distribution, or size. Interestingly, microtubule-associated protein 2—a cytoskeletal protein that determines neuronal size—has been reported to be smaller
(31) in the same areas of entorhinal cortex where smaller neurons are found in patients with schizophrenia. Microtubule-associated protein 2 has been implicated in the dendritic outgrowth
(32) and in activity-dependent alterations in synaptic connectivity
(33). Thus, reduced volume of the entorhinal cortex could reflect cytoarchitectural and cytoskeletal abnormalities with implications for cellular connectivity and signal transmission.
Entorhinal cortex pathology may adversely affect processing of critical cognitive functions implicated in schizophrenia; such deficits may be further augmented by downstream structures. Unimodal and multimodal inputs are funneled through the entorhinal cortex for integration of motivational, affective, and attentional components
(34). The excitatory entorhinal cortex efferents to the dentate gyrus of the hippocampus form part of the “trisynaptic circuit” that is proposed to be dysfunctional in schizophrenia
(35). The other two synapses of this trisynaptic circuit are formed by the excitatory mossy fibers from the dentate gyrus to the CA3 region of the hippocampus and excitatory Schaffer collaterals projecting from the CA3 to CA1 region of the hippocampus. Cascading excitation in the trisynaptic circuit and the cytoarchitecture in the hippocampus—fewer interneurons relative to pyramidal cells
(36) and greater packing density of efferents in the hippocampus
(37) than in the prefrontal cortex—tend to amplify inputs from the entorhinal cortex, amygdala, septum, and hypothalamus. Impaired γ-aminobutyric-acid-ergic function in the hippocampus
(35) could further enhance the glutamatergic excitatory activity in the trisynaptic circuit, which is projected back to the entorhinal cortex and amygdala. Thus, inputs from an abnormal entorhinal cortex may get amplified in the hippocampus, which could result in the information processing deficits seen in schizophrenia.
Contrary to our hypothesis that the severity of psychotic symptoms would be negatively correlated with entorhinal cortex volumes, we found that entorhinal cortex volumes were
positively correlated with delusions. The possible mechanisms underlying this unexpected finding merit discussion. Deficits in episodic
(38), specific autobiographical
(39), and recognition
(40) memories in schizophrenia have been associated with positive and negative symptoms
(41,
42). Specifically, delusional subjects have been reported to recall more threatening propositions
(43), fewer specific memories to positive cues, and more categorical memories
(44) than healthy and nondelusional subjects
(41). The entorhinal cortex is reported to have a major role in recognition
(17,
45), episodic memory
(15), and autobiographical memory
(16). Hypoglutamatergic and hyperdopaminergic states in schizophrenia
(46) have been reported to selectively inhibit perforant path input to the CA1
(47), driving the hippocampal system to focus on the CA3/dentate gyrus
(12), where old memory states are represented that are irrelevant to the “real sensory” information held in the entorhinal cortex. This could lead to errors in checking predictions based on internal representations against external reality, which may result in false conclusions
(12). Hence, an overgeneral retrieval style, specific recall of negative or threatening events, and errors in checking such memories against external reality could be responsible for the formation of delusions.
A relatively larger entorhinal cortex in delusional than in nondelusional patients is perhaps required for the retrieval of such memory, which could then “crystallize” as delusions through further processing downstream. A relatively smaller entorhinal cortex in nondelusional subjects may be unable to retrieve such memory efficiently, which may lead to an inability to form delusions while manifesting other features of schizophrenia.
The published literature on correlations between delusions and cognitive functions is conflicting
(48). One prevailing view is that delusions rely on more subtle functional disconnection in neural circuits involving frontal, temporal, and other brain regions
(49). A study of event-related potentials suggested altered memory integration and disturbances in qualitative rather than quantitative aspects of memory to be correlated with delusion severity
(48). Consistent with this view is a positron emission tomography study comparing regional cerebral blood flow in delusional and nondelusional patients with schizophrenia; perfusion in the hippocampus-parahippocampus region was enhanced in delusional but decreased in nondelusional patients
(50).
Previous studies suggest that some key brain structures are relatively well preserved in delusional subjects. In patients with paranoid schizophrenia, substantially greater bifrontal and bicaudate diameters have been observed
(51), suggesting relative preservation of the prefrontal cortex and caudate nucleus. In addition, paranoid patients committed fewer perseverative errors on the Wisconsin Card Sorting Test than nonparanoid patients
(52), a finding that supports the concept of better prefrontal cortex functioning. Among the medial temporal lobe structures in our data, the hippocampus did not show any differences between patients and healthy subjects or between delusional and nondelusional patients. The amygdala showed a trend to be smaller in patients with schizophrenic disorders and significantly larger in patients with nonschizophrenic psychotic disorders than in healthy subjects, but no differences were found between patients who were or were not delusional (our unpublished work). We observed a smaller parahippocampal gyrus (which feeds unimodal and multimodal information to the entorhinal cortex) in delusional patients than in nondelusional patients
(53) and a positive correlation of orbitofrontal cortex volume with severity of delusions
(54). From the neuroanatomical perspective, taking the data together, we could infer that the parahippocampal abnormality “corrupts” the signal that is fed to the entorhinal cortex, where this corrupted information is maintained as a real-sensory template for the hippocampus to compare with internal representations. Neurochemical abnormalities mentioned here could amplify these errors, which could crystallize as delusions; heightened emotional valence may then be attached through orbitofrontal cortex pathology
(55).
This study is one of the few structural MRI studies specifically examining the entorhinal cortex in a relatively large group of neuroleptic-naive patients experiencing their first episode of schizophrenia or related disorders. We used high-resolution MRI images and an anatomically and cytoarchitecturally validated method of delineating the entorhinal cortex with high interrater and test-retest reliabilities. However, our tracings were not perfect approximations of what might be cytoarcitectonically defined as the entorhinal cortex. Stereotactic coordinates of MRI normalized to a reference brain such as the Talairach brain are probabilistic indicators of anatomical
(56) and functional
(57) locations; they provide only rough approximations of Brodmann’s areas that are based on light microscopic cytoarchitecture. In addition, even sulcal landmarks are not generally valid indicators of brain function
(57). We have attempted a combination of both to achieve the maximum validity to define the entorhinal cortex. The entorhinal cortex volume measured in this study agrees well with the volumes in previously published studies
(28,
58). To our knowledge, this is the first study reporting a correlation between entorhinal cortex volume and positive symptoms, particularly delusions.
In summary, entorhinal cortex volume reductions are seen early in the course of psychotic disorders, may not be specific to schizophrenia, and could be seen in other psychotic disorders as well. The entorhinal cortex volume correlated positively with positive symptoms and delusions. Further, the observed alterations in the entorhinal cortex may not be anatomically specific but could be part of a network abnormality involving other brain structures. The role of the entorhinal cortex and related brain structures in the pathogenesis of schizophrenia needs to be further elucidated by the use of functional and neurochemical imaging studies.
