Although family, twin, and adoption studies have provided strong evidence that genetic variation plays a major role in the etiology of bipolar disorder, susceptibility genes have proven difficult to identify definitively. Mode-of-inheritance studies have suggested that multiple genes are likely to be involved in the etiology of bipolar disorder
(1), which is consistent with the results of more than 20 genome-wide linkage scans
(2) . If the effect of any single gene is generally modest for bipolar disorder, can we identify the clinical features that tag more genetically homogeneous subtypes, facilitating susceptibility gene identification? Clinical subtyping has been an effective method in determining the etiology of other illnesses, such as Alzheimer’s disease and breast cancer, in which families with early onset illness led researchers to the identification of disease genes
(3,
4) .
Several clinical features have been shown to increase evidence of genetic linkage to chromosomal regions or association with gene variants. Comorbid panic disorder
(5) and bipolar II disorder
(6) appear to enhance linkage to distinct regions on chromosome 18q. In two datasets, psychotic features showed linkage to chromosome 13q
(7,
8), and early age at onset showed linkage to chromosome 21q22 in two cohorts
(9) . It has been reported that mania at onset enhances linkage to chromosome 16p
(10), and a linkage to chromosome 2 was shown to be associated with attempted suicide in bipolar disorder
(11) . Psychotic features, mood-incongruent psychotic features, and persecutory delusions in bipolar disorder have strengthened evidence suggesting that there is a genetic association with DTNBP1 (dysbindin), NRG1 (neuregulin), and DAOA (G72), respectively
(12 –
14) . These early successes suggest that clinical phenomenology can help to define more genetically homogenous forms of bipolar disorder.
The choice of features studied in bipolar disorder genetics has been guided largely by clinical experience. Features that show familial aggregation may be particularly promising
(15), and most of the features, as mentioned previously, that enhance linkage or association signals are indeed familial. However, only a minority of the myriad clinical features in bipolar disorder have been studied.
The study of clinical features has been limited by the time-consuming process of gathering and assembling relevant clinical data in cohorts of sufficient size. Large-scale genetics efforts have yielded the human genome sequence and, more recently, the HapMap, which is a reference cataloguing what is common in human sequence variation. The authors of the HapMap paper called for comparable large-scale efforts in the phenotypic arena
(16) . A similar concept, the “Human Phenome Project,” was advanced by Freimer and Sabatti
(17) . Freimer and Sabatti advocated an international effort to create phenomic databases, comprehensive assemblages of systematically collected phenotypic information, to aid in the identification of disease genes. In this vein, the Autism Phenome Project has implemented prospective compilation of comprehensive phenotypic data in order to parse genetic heterogeneity in autism
(18), and an Epilepsy Phenome-Genome Project is planning similar work (http://65.175.48.5/epgp/index.htm). To our knowledge, no comparable databases for bipolar disorder yet exist.
To address this issue, we have combined retrospective clinical data from two large family cohorts, collected over 20 years, for bipolar disorder genetic linkage studies. In the process, we cleaned and integrated 284,788 datapoints from 1,453 subjects in the University of Chicago, Johns Hopkins, and the National Institute of Mental Health (NIMH) Intramural Program (CHIP) Collaboration cohort and 2,974,796 datapoints from 4,268 subjects in the NIMH Genetics Initiative Bipolar Disorder Collaborative project cohort. The final result, which we named the Bipolar Disorder Phenome Database, offers substantial power to define novel clinical subtypes of bipolar disorder, test for familial aggregation, and carry out genetic linkage and association studies that use specific clinical features as covariates or as primary phenotypes.
Method
Description of Original Data
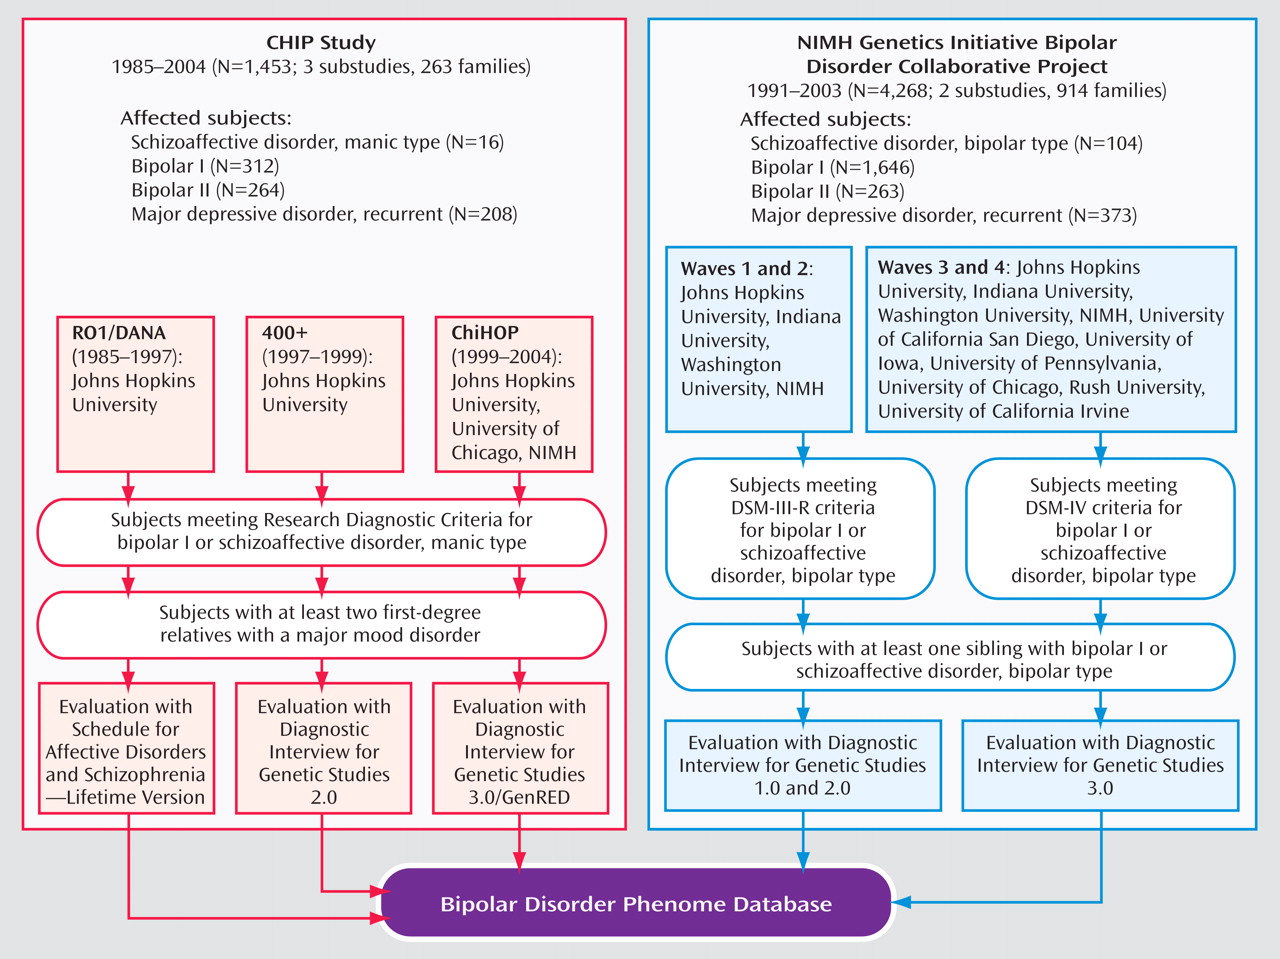
The CHIP cohort was derived from three clinical data collections: two conducted at Johns Hopkins (one from 1985 to 1997 [“DANA”] and one from 1997 to 1999 [“400+”]) and a third conducted at the Johns Hopkins, University of Chicago, and NIMH Intramural Program (from 1999 to 2004 [“ChiHop”]). Ascertainment required a bipolar I disorder proband and two first-degree relatives with at least one of the following major mood disorders: schizoaffective, manic; bipolar I disorder; bipolar II disorder, with recurrent major depression; or recurrent major depressive disorder
(19) . The NIMH Genetics Initiative cohort was ascertained in two phases, from 1991 to 2003. The first phase (“G4” or “Waves 1 and 2”) was carried out at four centers. The second phase (“G9” or “Waves 3 and 4”) was conducted by these same four centers and at five additional centers (for additional information about the NIMH Genetics Initiative Bipolar Disorder project, see the data supplement that accompanies the online version of this article). Ascertainment required a bipolar I disorder proband and a sibling with bipolar I disorder or schizoaffective disorder, bipolar type
(20) .
Figure 1 is an overview of the studies and substudies. Informed consent was obtained from subjects after each study was fully explained.
Interviews were conducted using the Schedule for Affective Disorders and Schizophrenia-Lifetime Version
(21) or the Diagnostic Interview for Genetic Studies. Four versions of the Diagnostic Interview for Genetic Studies were used, including versions 1.0, 2.0, 3.0, and 3.0 GenRED
(22) . Diagnoses were made based on interview, medical records, and family informant data, using a best-estimate procedure and employing the Research Diagnostic Criteria or DSM-III-R or -IV combined with the Research Diagnostic Criteria. The DSM/Research Diagnostic Criteria combinations were used in the NIMH studies in order to preserve the Research Diagnostic Criteria guidelines for bipolar II disorder that were eliminated from DSM-III-R and changed substantially in DSM-IV.
We included all subjects that were entered into the clinical databases for these projects, which included some subjects or families that were ultimately deemed ineligible for the genetic studies because of failure to meet ascertainment criteria or to provide blood samples.
Consolidation of Interviews
Because blood samples were collected in five subprojects with various instruments over a 20-year period, a major task was to assemble a uniform clinical database.
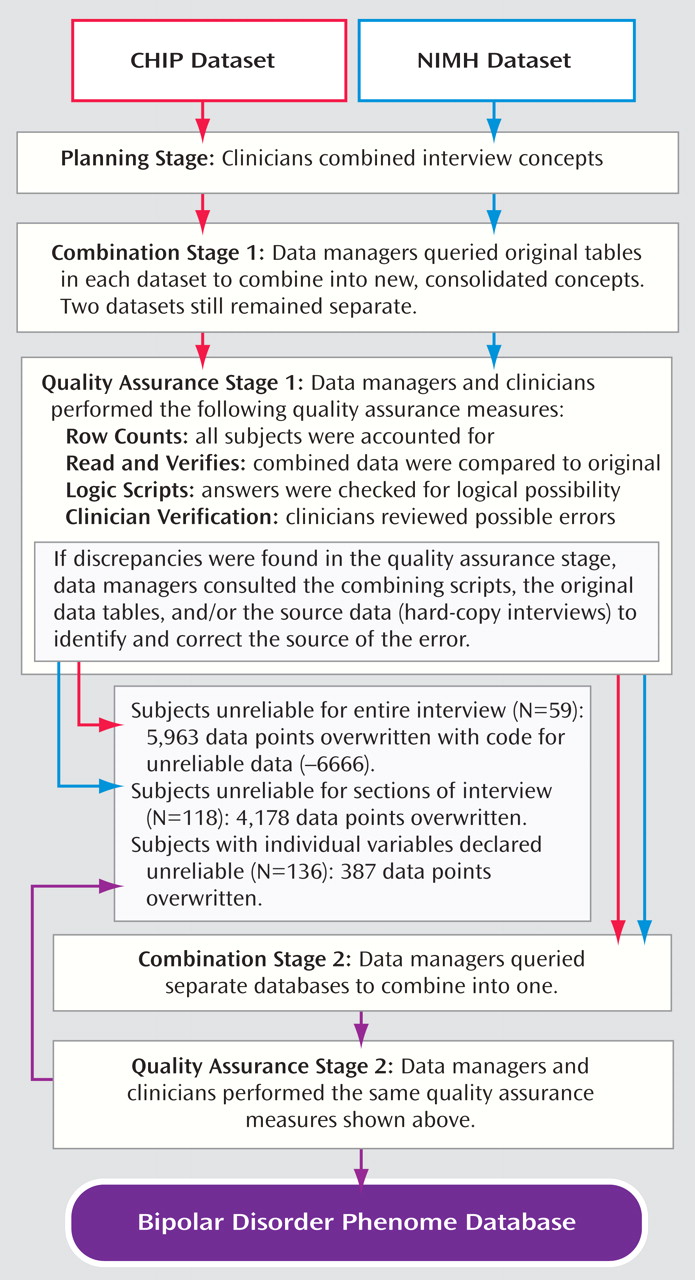
Figure 2 shows an overview of the process through which the data were checked and combined. Research clinicians (Drs. Kassem, Lopez, McMahon, MacKinnon, Potash, and Schulze) reviewed the items from the Schedule for Affective Disorders and Schizophrenia-Lifetime Version and the four versions of the Diagnostic Interview for Genetic Studies to determine where interviews differed and which questions could be reasonably combined. Wherever the wording or context of questions was inconsistent across interviews, an effort was made to extract data that were consistent with both interviews; wherever this was impossible, datapoints were excluded. The objective was to achieve a broad combination that maximized the capture of information while retaining consistency. The Schedule for Affective Disorders and Schizophrenia-Lifetime Version was the limiting factor, since it collected the least detailed information. Because one of the CHIP substudies used the Schedule for Affective Disorders and Schizophrenia-Lifetime Version, while NIMH studies did not, CHIP-only and NIMH-only datasets were created separately to maximize data retention (see the supplemental table, which accompanies the online version of this article). These are available as separate modules of the database.
The following components were combined for both cohorts: best-estimate diagnoses, pedigree information, demographics, mania, depression, hypomania, alcohol use, psychosis, suicidality, and anxiety. For the NIMH group, we also included medical history, psychiatric overview, drugs of abuse, eating disorders, and antisocial personality disorder. We adopted a rule that >75% of items had to be identical across instruments in order for data to be considered indicative of a shared construct that could be included in the final database.
The Diagnostic Interview for Genetic Studies and Schedule for Affective Disorders and Schizophrenia-Lifetime Version interviews were most similar for the depression and mania sections; while the Diagnostic Interview for Genetic Studies had more detail, both assessed the same core features. The one significant structural difference was in the assessment of hypomania. In the Schedule for Affective Disorders and Schizophrenia-Lifetime Version and early versions of the Diagnostic Interview for Genetic Studies, hypomania was discussed after the mania and depression sections. In later Diagnostic Interview for Genetic Studies versions, the assessment of hypomania was folded into the section on mania.
The sections on psychosis and alcohol and substance use disorders were rather dissimilar. For psychosis, the difference was in the level of detail gathered. The Schedule for Affective Disorders and Schizophrenia-Lifetime Version asks only about the presence of hallucinations or delusions—the two are not distinguished. By contrast, the Diagnostic Interview for Genetic Studies has separate questions about each, and an extensive section on details of psychotic experiences. For alcohol use disorders, the difference between interviews derived from a change in diagnostic criteria. The Schedule for Affective Disorders and Schizophrenia-Lifetime Version assesses Research Diagnostic Criteria for alcoholism, while the Diagnostic Interview for Genetic Studies assesses DSM alcohol abuse and dependence. The sections on substance use disorder were so dissimilar that only best-estimate diagnoses could be matched (Research Diagnostic Criteria for drug use disorder to DSM criteria for substance abuse).
We attempted to make the item response scales uniform after the combinable sections were identified. For example, in some instances clinicians had to recode 5-point scales in one instrument in order to match a 4-point scale in the same question in another instrument. This involved both algorithms and clinician judgments. Data managers reviewed the responses to each item and sent potential errors back to the clinicians who determined when problematic data should be considered “unknown.”
Data Cleaning and Combining
We ensured that all interviewed subjects were present in each table by performing row counts. Best-estimate diagnosis and pedigree tables were exceptions, since the former also contained diagnoses based on medical records and family histories for a few individuals, and the latter contained data on subjects who did not participate but whose information was necessary to connect relatives in the pedigree. Random subsets of 30 to 50 subjects were chosen for verification against the original data. Data managers then ran scripts to identify potentially illogical answers. Data managers and physicians reviewed the output to check for unsuitable and unlikely answers. Data managers investigated discrepancies by reviewing the scripts and the original tables. Discrepancies that could not be resolved in this manner were removed.
During the quality assurance process, the collaborators performed preliminary analyses on beta-test versions of the files and identified potential discrepancies or limitations. Some subjects were in the database twice because of two interviews; these duplicates were dropped. Some families had two probands assigned; the proband ascertained earliest was designated the “new proband.” Some subjects were diagnosed with a major mood disorder at low confidence. These diagnoses were changed to “other,” and a “high confidence best-estimate” field was created to reflect the new standard.
Once the phenome data were curated and verified in both datasets, the CHIP and NIMH data were merged into one, creating a single, seamless database. This database was then passed through quality assurance steps similar to those described previously in this article.
Data Analysis
Counts and percentages were tabulated by diagnosis for each categorical variable using the statistical software STATA. For continuous variables, means and medians were calculated to account for outliers. Chi square and analysis of variance (ANOVA) statistics were used to test for differences in clinical features between diagnostic groups. The generalized estimating equation was used to assess whether the presence of a feature in a proband predicted its presence in the first-degree relatives of that proband
(23) . The generalized estimating equation allows for an analysis of clustered data using logistic regression but also taking into account potential correlation between observations when multiple members of the same family are considered.
Heritability of quantitative variables was assessed with QTDT
(24) . QTDT uses a variance-components approach to estimate the proportion of variance attributable to genetic factors. Since the pedigree sizes were limited, we contrasted a model that incorporated environmental variance to one that incorporated environmental and genetic variance, with no term for shared familial variance, generating a likelihood ratio chi square statistic with one degree of freedom. Heritability was estimated as the genetic divided by the total variance. Since the goal of analyses at this stage was purely descriptive, p values are reported without correction for multiple testing.
We used formulas described by Risch
(25) to estimate the power to detect linkage using clinical covariates, at both significant (logarithm of the odds ratio [LOD]=3.6) and suggestive (LOD=2.2) thresholds
(26), assuming an information content of 0.7 for the microsatellite genome scan and 0.9 for the single nucleotide polymorphism genome scan. We assessed the power of family based association tests using PBAT software
(27) under the following assumptions: a multiplicative genetic model, an alpha significance of p<0.01, and a marker in perfect linkage disequilibrium with the risk allele. Power for case-control studies was assessed using the Genetic Power Calculator
(28) . We used the same parameters as above, assuming equal numbers of case and comparison subjects.
Results
The CHIP dataset originally contained 1,510 subjects. After vetting, 57 subjects were dropped because of unreliable, inconsistent, or largely missing data. The final CHIP Phenome Database includes 1,453 subjects (800 affected) in 263 families and 196 variables with 284,788 datapoints.
The original tables from the NIMH cohort contained 4,449 subjects, and 181 subjects were dropped. Low confidence diagnoses of major mood disorder were present for 881 subjects; these were deemed “other” rather than “affected” in the database. The final NIMH Phenome Database includes 4,268 subjects (2,386 affected) in 914 families and 697 variables with 2,974,796 datapoints.
The combined Bipolar Disorder Phenome Database consists of 5,721 subjects (3,186 affected) in 1,177 families, 197 variables, and 1,127,037 datapoints. In the combined cohort, 25,878 (2.3%) datapoints are unknown, missing, or unreliable; 215,487 (7.2%) datapoints in the NIMH group; and 3,264 (1.1%) datapoints in the CHIP group. The diagnostic breakdown is illustrated in
Figure 1 .
To indicate the value of subjects for genetic studies, columns were added in the pedigree table of the database. These included whether the family had ≥1 subject with bipolar I disorder and whether DNA samples were available. A total of 5,118 subjects (3,070 affected) from 977 families met both criteria.
Clinical Picture
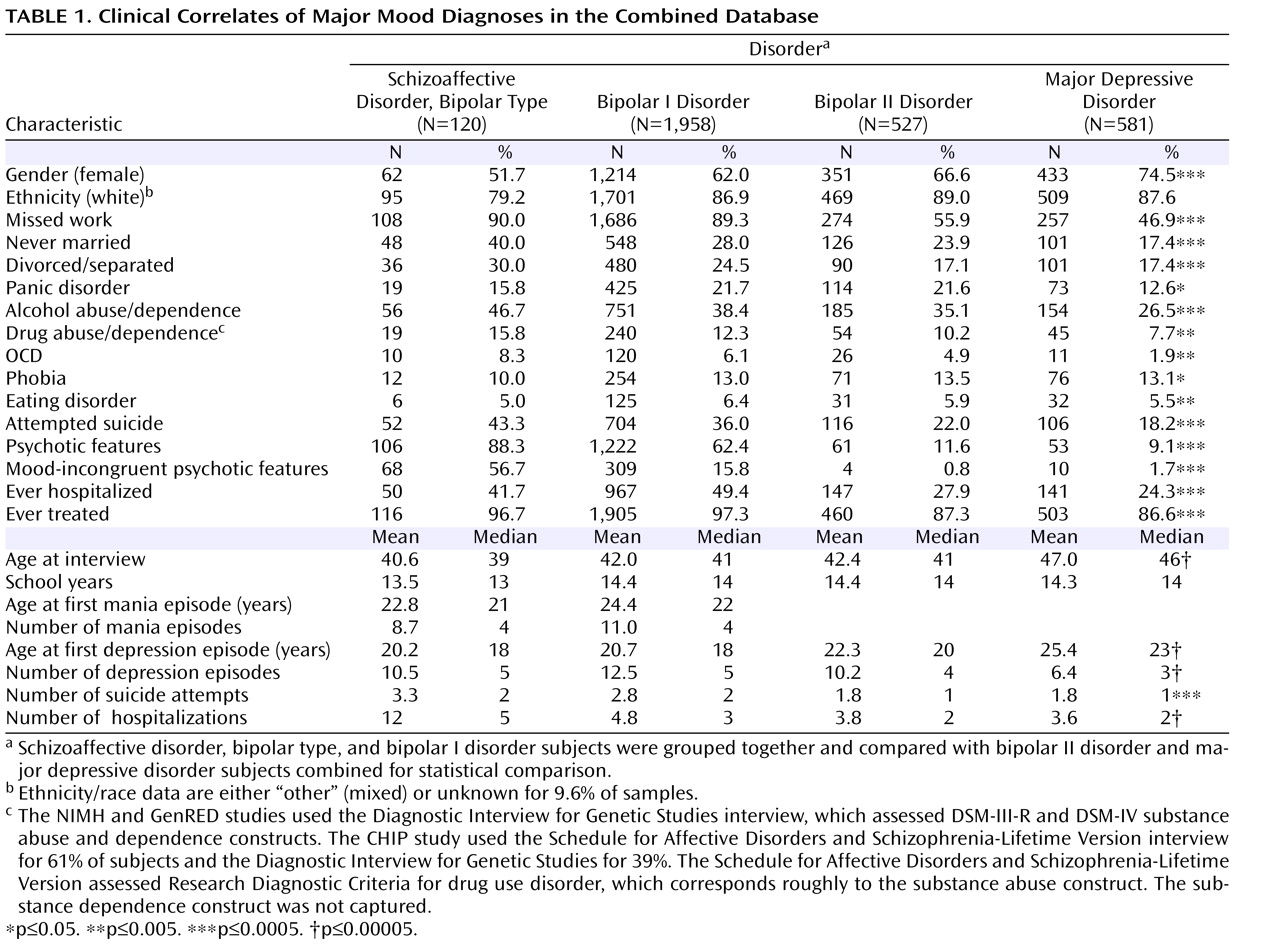
Among the subjects interviewed, 120 had schizoaffective disorder, bipolar type, 1,958 had bipolar I disorder, 527 had bipolar II disorder, and 581 had major depressive disorder.
Table 1 shows the demographics, core illness features, and additional illness features associated with these diagnostic categories. The cohort was majority female and predominantly European American.
Subjects suffering from bipolar disorder in this sample had to contend with serious, often disabling illness. Most had missed work because of illness, and more than one-half of bipolar I disorder or schizoaffective disorder, bipolar type, subjects were divorced, separated, or never married. Comorbidity is the rule, especially alcohol and substance use disorders and panic disorder. Typically, bipolar disorder had already begun to manifest by the late teens, and most individuals with the disorder had been treated or hospitalized for it. Suicide attempts and psychotic features are common among these individuals.
Subjects with schizoaffective disorder, bipolar type, and bipolar I disorder had a more severe illness course than those with bipolar II disorder and major depressive disorder. For example, subjects with schizoaffective disorder, bipolar type, and bipolar I disorder had higher rates of missed work (86.3% versus 47.9%, p≤0.0005), attempted suicide (36.4% versus 20.0%, p≤0.0005), and hospitalization (48.9% versus 26.0%, p≤0.0005).
Familial Aggregation
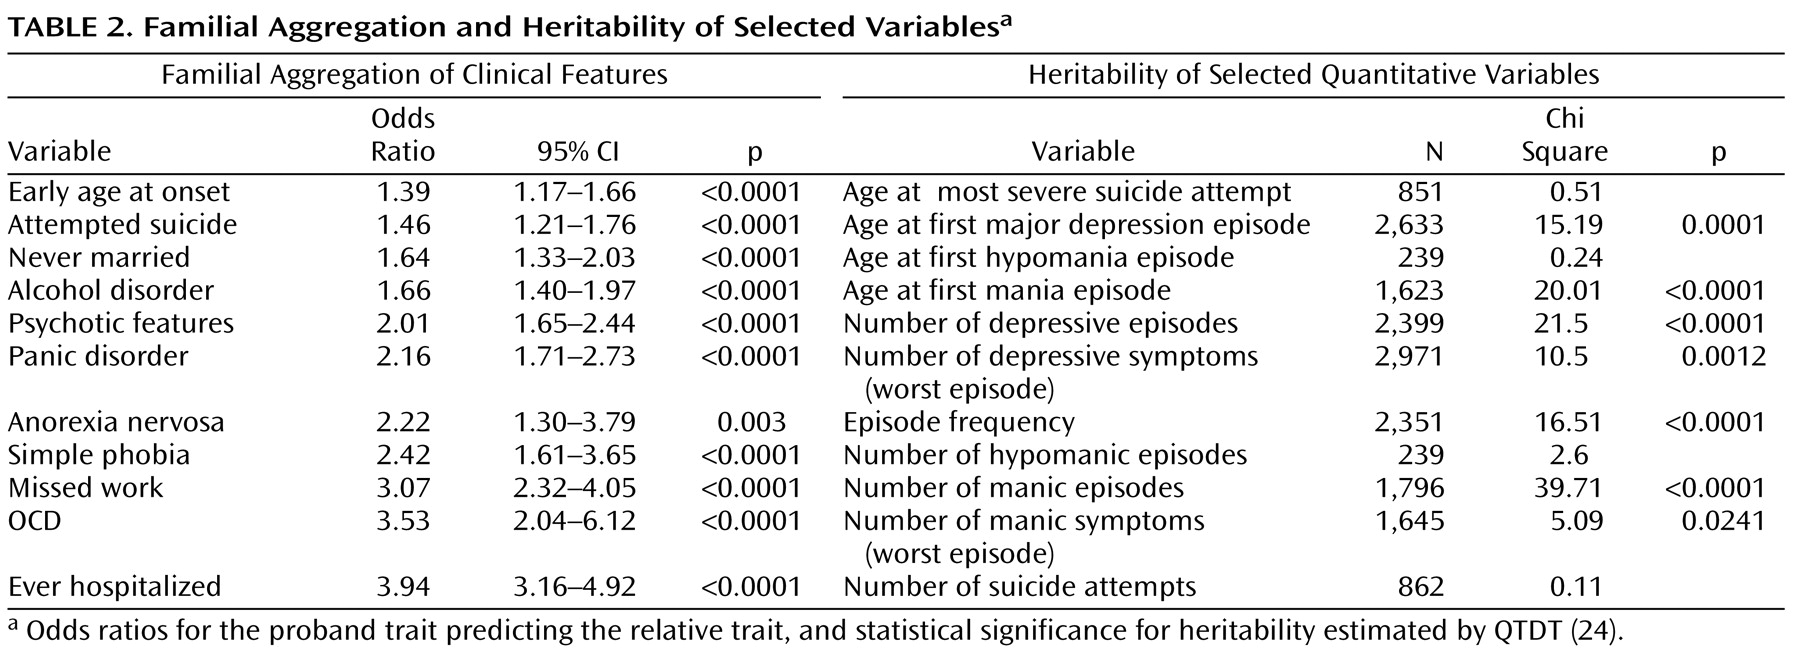
We used a proband-predictive model to assess familial aggregation of 13 selected clinical variables in the combined dataset.
Table 2 shows the odds ratios (OR) for the occurrence of the trait in relatives if the proband reported the same trait. By this metric, the most strongly familial traits were history of psychiatric hospitalization (OR=3.94, SE=0.45, z=12.12, p<0.0001), comorbid obsessive-compulsive disorder (OCD) (OR=3.53, SE=0.99, z=4.51, p<0.0001), and absences from work because of mood disorder (OR=3.07, SE=0.44, z=7.88, p<0.0001). However, all variables measured showed statistically significant familial aggregation in this large cohort.
Heritability
Some quantitative variables were much more heritable than others (
Table 2 ). In particular, age at first mania, number of manic episodes, and episode frequency
(29) are highly heritable, suggesting that these variables may be especially useful as covariates in genetic linkage and association studies.
Power for Genetic Studies
If the bipolar disorder phenotype is composed of multiple subphenotypes with distinct genetic causes, then any particular genetic variant might contribute to causation of one or several subphenotypes, but not all. If this is the case, studying subphenotypes of the disorder might be more informative than studying the phenotype of the disorder as a whole. While subtyping reduces cohort size, it might increase genetic homogeneity within the subgroup and thereby increase the recurrence-risk ratio in the case of linkage or genotype relative risk in the case of association. Thus, stratification based on covariates could increase the power to detect a signal if it provides a sufficient increase in genetic homogeneity. We assessed the power to detect genetic linkage and association using selected variables from the Bipolar Disorder Phenome Database, including psychotic features, attempted suicide, early age at onset, panic disorder, phobia, and alcohol abuse/dependence.
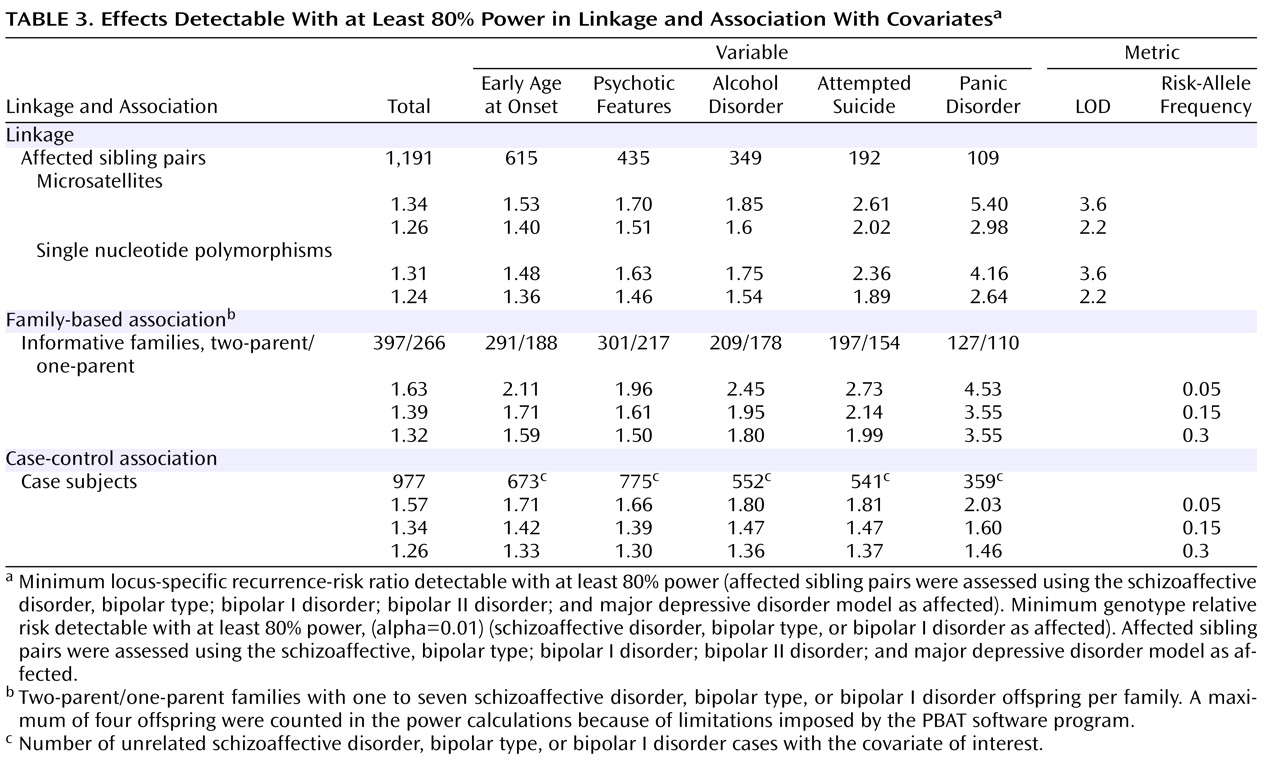
For linkage studies, we restricted analyses to families who met the original study criteria. These 807 families (1,191 independent-affected sibling pairs) were vetted for inheritance errors, unlikely recombinations, and the presence of identical twins. We depicted power under two scenarios. One scenario assumed markers that were spaced an average of 9 cM apart. We calculated the increase in recurrence-risk ratio in a covariate-defined subgroup that was necessary to maintain an 80% power to detect linkage at LOD thresholds of 3.6 and 2.2 when the size of the subgroup was defined by the frequency of the covariate (
Table 3 ). The early age at onset covariate provided the most power, since a recurrence-risk ratio of 1.40 can be detected by linkage at the suggestive threshold. Comorbid panic disorder, which provided the most modest power, can detect a ratio of 2.98. The second scenario assumed a finer linkage map, with single nucleotide polymorphisms (spacing, 0.64 cM). Using the single nucleotide polymorphism scan, the power to detect linkage was somewhat enhanced.
We estimated the power to detect genetic association using both family-based and case-control designs. For the latter, we have 977 unrelated bipolar I disorder (or schizoaffective disorder, bipolar type) probands with available DNA samples. We employed the same set of covariates as for linkage.
Table 3 shows the genotype relative risk detectable with ≥80% power, given varying frequencies of the disease-related allele. The minimum detectable genotype relative risk for psychotic features ranged from 1.30–1.66, while the minimum detectable risk for comorbid panic disorder was 1.46–2.03. For family-based association studies, we have 663 informative families, including 397 two-parent families and 266 single-parent families, each with one to seven bipolar I disorder offspring. This cohort conferred less power across most scenarios, shown in
Table 3, to detect association by family-based methods.
Discussion
The Bipolar Disorder Phenome Database is designed to complement the large bodies of genetic data that are generated through the Human Genome Project, The International HapMap Consortium, the Genetic Analysis Information Network, and similar efforts. The objective of the database is to accelerate the discovery of genes that contribute to bipolar disorder, a common and often disabling disease. One key to making data valuable to the community is to provide public access. The Bipolar Disorder Phenome is now publicly available on mirror sites at Johns Hopkins (http://bioinformoodjcs.jhmi.edu/phenome/) and at NIMH (http://mapgenetics.nimh.nih.gov). The original CHIP tables can be obtained there as well. DNA blood samples matching the NIMH component of the database can be obtained from the NIMH Center for Genetic Studies (http://nimhgenetics.org/) as well as the original NIMH clinical data.
Value could be added to the Bipolar Disorder Phenome Database by incorporating data from additional studies. Integration could be accomplished easily with studies using the same instruments (Schedule for Affective Disorders and Schizophrenia-Lifetime Version and Diagnostic Interview for Genetic Studies). This integration might be particularly valuable for cohorts in which genetic data have already been combined. It is also worth considering combining these clinical data with physiological data from brain imaging, hypothalamic-pituitary-adrenal axis, evoked potential, and neuropsychological studies. To our knowledge, large-scale studies of this type have not been performed on patients with bipolar disorder, although they are underway in autism research
(18) . Some subjects in the database have already undergone endophenotypic assessments at various centers.
Further steps that could be added to the existing dataset include data reduction through techniques such as factor analysis. These factors could then be tested for familiality, and the factor scores could be used as phenotypes for genetic study. This has been performed, for example, with linkage for alcohol dependence
(30) and bipolar disorder
(31) and with association for schizophrenia
(32) and OCD
(33) . The bipolar disorder study
(32) used part of the NIMH Genetics Initiative cohort and assessed depression and irritable mania factors as phenotypes in linkage. Little evidence for linkage was detected, although the cohort was only one-sixth the size of the cohort presently contained in the Bipolar Disorder Phenome Database.
Several limitations to the present study should be considered. First, the variables included were collected retrospectively and were subject to recall bias. Second, reliability and validity of individual items were not directly addressed. Low reliability would have reduced the estimates of familiality and heritability. However, diagnostic reliability and reliability of selected items were assessed for both the Schedule for Affective Disorders and Schizophrenia-Lifetime Version and Diagnostic Interview for Genetic Studies and was found to be fair to good
(34 –
37) . Third, the estimates of heritability presented cannot resolve the effects of shared genes and shared familial environment, since these are confounded in the nuclear families that make up the bulk of the database. Furthermore, the tools that are currently available do not allow an assessment of the heritability of dichotomous measures in family cohorts
(38) . Finally, even in this very large database, the power to detect small genotype relative risks through association is ample only with common disease alleles that are in very high linkage disequilibrium with marker alleles.
This is a phenomenological database. However, we have not yet attempted to incorporate data from potential endophenotypes, as valuable as they may be
(39) . Rather, the signs and symptoms encompassed by the Bipolar Disorder Phenome Database are meant to describe, in the fullest detail possible, the clinical picture of bipolar disorder. Phenomenology is naturally limited by the examiner’s ability to elicit, and the participant’s willingness to report, the contents of the conscious mind
(40) . On the other hand, phenomenology gives us the most immediate report of the subjective experience of mental illness and the most direct glimpse into the mind of the sufferer. Using the Bipolar Disorder Phenome Database, researchers, for the first time, can explore the connections between phenomenology and genetics in a cohort that is adequately powered to detect even modest effects.
