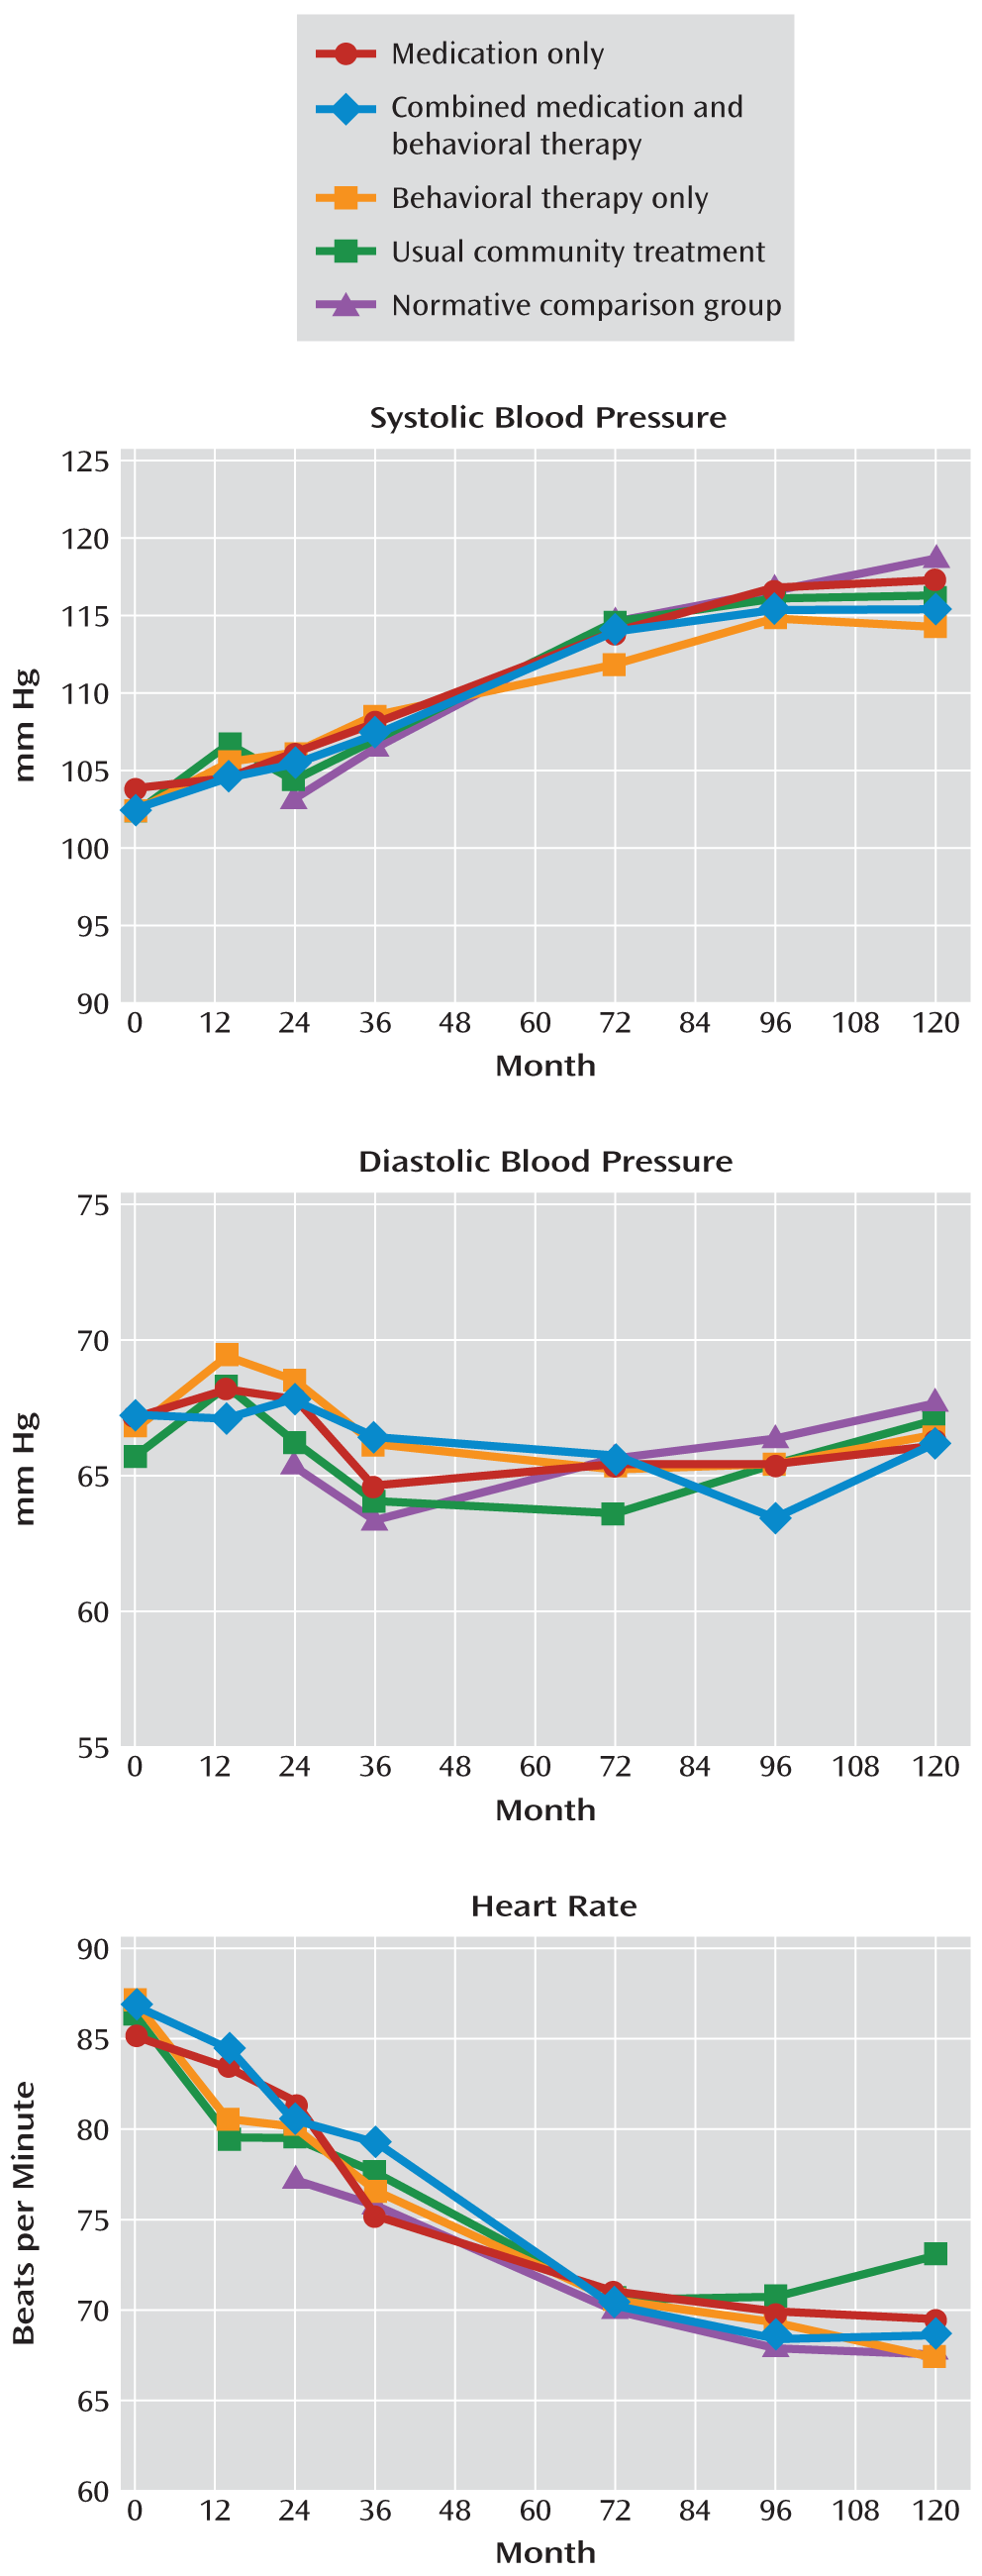
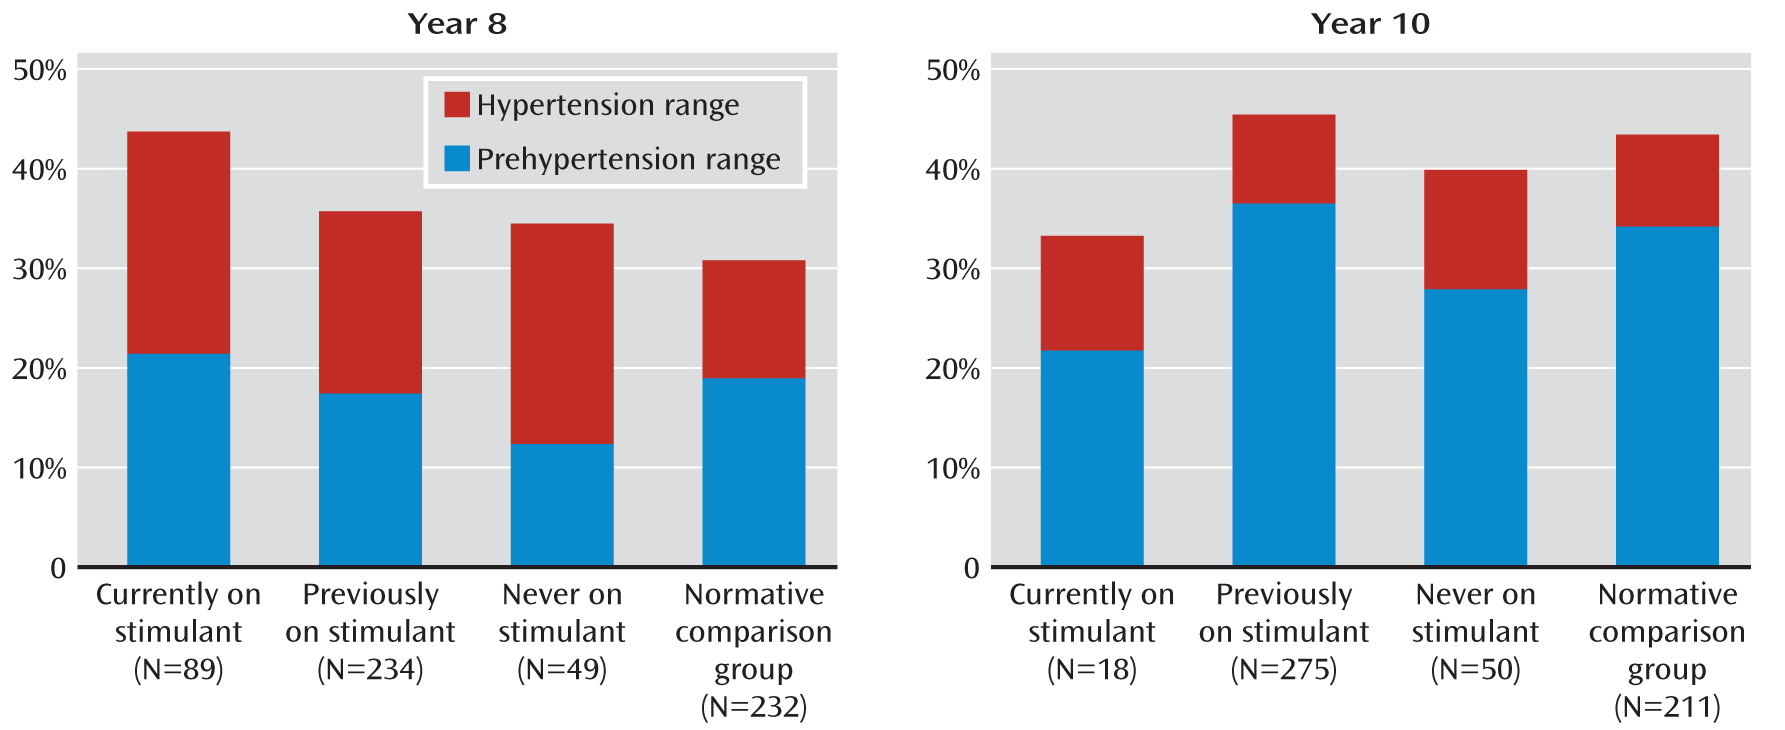
Study Design and Participants
The data we analyzed were collected as part of the MTA, a publicly funded multisite randomized controlled trial that compared the effectiveness of different treatment interventions for children with ADHD. The design, methods, and main clinical outcomes of the MTA have been reported in detail (
14–
18). A total of 579 children 7–9 years of age (mean=8.5 years; 80% male, 61% white, 20% African American, and 8% Hispanic) with a DSM-IV diagnosis of combined type ADHD were randomly assigned to 14 months of treatment with stimulant medication (7 days a week, with no interruptions for summer holidays), behavioral therapy, a combination of medication and behavioral therapy, or usual community treatment. To be enrolled in the study, children had to be medically healthy, without evidence of cardiovascular disease by history or physical examination. After the 14-month controlled trial, all patients received naturalistic community treatment and were assessed at specified time points (2, 3, 6, 8, and 10 years after randomization). Intent-to-treat analyses based on treatment group identified statistically significant differential treatment effects on ADHD symptoms at the end of the controlled study and up to 10 months afterward (year 2), but not at subsequent assessments (
15,
18,
19).
Starting with year 2, a local normative comparison group was added to the follow-up study. This group consisted of 289 children who were randomly selected from the same schools and grades and in the same sex proportion as the MTA patients and the same entry criteria except for ADHD diagnosis (but ADHD was not a reason for exclusion). Their blood pressure and heart rate were assessed in the same manner as in the MTA patients.
The data were collected between 1994 and 2006 at the following clinical sites: University of California, Berkley/University of California, San Francisco; Duke University Medical Center; University of California, Irvine; Long Island Jewish Medical Center and New York University; McGill University/Montreal Children's Hospital; University of Pittsburgh; and Columbia University/New York State Psychiatric Institute and Mount Sinai Medical Center, New York.
Data Analysis
The database was centrally managed and quality-assured at the National Institute of Mental Health, Bethesda, Md. Statistical analyses were conducted at the Center for Health Statistics, University of Illinois at Chicago.
Blood pressure data were analyzed both as absolute values and after classification into the categories of normal, prehypertension, hypertension stage 1, and hypertension stage 2, according to age-, sex-, and height-adjusted percentiles from U.S. population norms for children and adolescents through age 17 (
21). Height percentiles were computed according to the 2002 U.S. Centers for Disease Control and Prevention population norms (
22). Blood pressure status was classified as normal if both systolic and diastolic blood pressure were below the 90th percentile; prehypertension if the systolic or diastolic blood pressure was at or above the 90th percentile but below the 95th percentile; hypertension stage 1 if the systolic or diastolic blood pressure was at or above the 95th percentile but below the 99th percentile; and hypertension stage 2 if the systolic or diastolic blood pressure was at or above the 99th percentile (
21).
For participants older than age 17, adult criteria for blood pressure were used, according to which normal is a systolic blood pressure <120 mm Hg and a diastolic blood pressure <80 mm Hg; prehypertension is a systolic blood pressure of 120–139 mm Hg or a diastolic blood pressure of 80–89 mm Hg; hypertension stage 1 is a systolic blood pressure of 140–159 mm Hg or a diastolic blood pressure of 90–99 mm Hg; and hypertension stage 2 is a systolic blood pressure ≥160 mm Hg or a diastolic blood pressure ≥100 mm Hg (
23).
The heart rate data were analyzed as absolute values and after categorization into normal or tachycardia based on population norms through age 18 (
24). Tachycardia was defined as a heart rate above the 95th percentile, based on age and sex. For example, at age 16, the cutoff was 100 bpm for girls and 95 bpm for boys.
For the intent-to-treat analyses, linear regression models were applied to the blood pressure and heart rate data, testing for treatment effects from the randomly assigned treatment conditions. In addition, multinomial logistic regression models (under the assumption of proportional odds) were applied to the blood pressure data categorized into normal, prehypertension, hypertension stage 1, and hypertension stage 2, and to the heart rate data classified as normal or abnormal. All models included baseline values, site, and race (African American compared with non-African American, given the higher risk for hypertension among African Americans) as covariates and body mass index (BMI) and current medication dosage as time-varying covariates.
To further account for stimulant use beyond the controlled phase of the study, at each assessment point in the naturalistic follow-up, participants were classified as “never medicated,” “currently medicated,” or “previously medicated” (but not currently on medication), and analyses of blood pressure categories were conducted with these groups.
For analyses testing for possible associations between cumulative dose exposure and blood pressure or heart rate regardless of treatment assignment, multinomial logistic regression models were applied. For each participant, the cumulative dose of methylphenidate received up to each point of assessment was computed. Information about the dose was obtained by interviewing the participants and their parents. Amphetamine doses were multiplied by 2 for conversion into methylphenidate equivalents (
25). Overall cumulative exposure over the 10-year assessment period ranged from 0 to 328,976 mg, with the 25th percentile being 7,898 mg and the 75th percentile 43,460 mg. At each assessment point, based on the cumulative dose received thus far, each participant was assigned to one of four exposure categories: no medication (0 mg), low exposure (cumulative dose, 1–7,898 mg), medium exposure (cumulative dose, 7,899–43,460 mg), or high exposure (cumulative dose >43,460 mg). Analyses included baseline values, site, and race (African American compared with non-African American) as covariates and BMI and current medication dose as time-varying covariates.
A number of other sensitivity and complementary analyses were conducted:
1. A logistic regression model was fitted at each assessment point using the continuous cumulative stimulant dose variable after log transformation.
2. Similar multinomial logistic regression models were conducted after combining the four blood pressure categories into three (normal, prehypertension, and hypertension) or two categories (normal and prehypertension/hypertension).
3. Generalized estimating equation methods were used to fit a multinomial logistic regression model simultaneously to all repeated measurements.
4. The analyses described above were repeated using the average daily dose of stimulant medication received for at least 15 days during the 30 days preceding the assessment and categorized into no medication (0 mg/day), low doses (1–24 mg/day), medium doses (25–40 mg/day), or high doses (>40 mg/day), in lieu of the cumulative dose percentile method described above.
5. The possible effect of actual medication use on the same day of the assessment was examined in a multinomial logistic regression model with cumulative exposure and in a longitudinal analysis using a generalized estimating equation.
6. The effect of medication use on the same day of the assessment was examined in the models with average daily dose, described in item 4 above.
7. Stimulant exposure was defined based on the percentage of time spent on stimulant medication, as consistent with other analyses of this database that focused on clinical outcomes and physical growth (
17). Based on this approach, being medicated was defined as having been treated with a stimulant at least 50% of the days since the previous assessment point, and the patients were classified as always, sometimes, or never/seldom medicated based on the status at each assessment point. Blood pressure and heart rate data were reanalyzed using these categories of exposure and the normative comparison group by fitting mixed-effects models that included site, race, and time-varying BMI and stimulant use as covariates.
The relationship between heart rate and cumulative dose, average daily dose, or current medication use was examined based on multiple regression analyses adjusted for age, race (African American compared with others), study site, and baseline heart rate, using the same approach described for blood pressure. Logistic regression models were not used to analyze abnormally elevated heart rate because very few participants (<1.8%) had a heart rate above the upper normal range at each assessment point.
For all the analyses, the threshold for statistical significance was set at 0.05 (two-tailed), despite multiple tests, to prevent type II error.


