Full access
New Research
Published Online: 1 August 2012

Regional fMRI Hypoactivation and Altered Functional Connectivity During Emotion Processing in Nonmedicated Depressed Patients With Bipolar II Disorder

Abstract

Objective:

Although the amygdala and ventrolateral prefrontal cortex have been implicated in the pathophysiology of bipolar I disorder, the neural mechanisms underlying bipolar II disorder remain unknown. The authors examined neural activity in response to negative emotional faces during an emotion perception task that reliably activates emotion regulatory regions.

Method:

Twenty-one nonmedicated depressed bipolar II patients and 21 healthy comparison subjects underwent functional MRI (fMRI) while performing an emotional face-matching task. Within- and between-group whole-brain fMRI activation and seed-based connectivity analyses were conducted.

Results:

In depressed bipolar II patients, random-effects between-group fMRI analyses revealed a significant reduction in activation in several regions, including the left and right ventrolateral prefrontal cortices (Brodmann's area [BA] 47) and the right amygdala, a priori regions of interest. Additionally, bipolar patients exhibited significantly reduced negative functional connectivity between the right amygdala and the right orbitofrontal cortex (BA 10) as well as the right dorsolateral prefrontal cortex (BA 46) relative to healthy comparison subjects.

Conclusions:

These findings suggest that bipolar II depression is characterized by reduced regional orbitofrontal and limbic activation and altered connectivity in a fronto-temporal circuit implicated in working memory and emotional learning. While the amygdala hypoactivation observed in bipolar II depression is opposite to the direction seen in bipolar I mania and may therefore be state dependent, the observed orbitofrontal cortex hypoactivation is consistent with findings in bipolar I depression, mania, and euthymia, suggesting a physiologic trait marker of the disorder.
Bipolar II disorder is characterized by periods of depression and hypomania. While a depressive episode is not a requirement for diagnosis, the predominant mood state is depression, and bipolar II patients spend up to half their time in this mood state (1). Patients with bipolar II disorder may have greater depressive episode recurrence, equal or greater rates of disability, and a greater risk of suicidal behavior compared with those with bipolar I disorder or major depressive disorder (2). Despite its clinical significance, an understanding of the neurobiological underpinnings of bipolar II depression lags behind that of other psychiatric disorders.
The orbitofrontal cortex and the amygdala, brain regions that help form a corticolimbic network, have been implicated in the emotional dysregulation characteristic of bipolar disorder. The ventrolateral prefrontal cortex (Brodmann's area [BA] 47), a subregion of the orbitofrontal cortex, has been shown to play an inhibitory role over the amygdala in healthy subjects (3). A reduction in activation in this brain region may be related to the increase in amygdala activation observed in mania (4, 5). Functional neuroimaging studies of bipolar depression are notably limited. However, research conducted by our group has revealed that bipolar I patients with depression also exhibit hypoactivation in BA 47 (6), suggesting that the modulatory role of the ventrolateral prefrontal cortex may be more complex and not necessarily associated only with the manic mood state. To our knowledge, seven additional studies utilizing affective paradigms known to activate the amygdala have been conducted to examine depressed bipolar patients (713). The findings have been inconsistent, with some studies reporting increased amygdala responsivity in these patients compared with healthy comparison subjects (7, 8, 10, 13) or no significant between-group differences in amygdala activation (6, 9, 11, 12). Notably, the majority of these studies included predominantly depressed bipolar I patients who were receiving medication.
In the present study, using a well-validated facial emotion processing task that has been shown to engage the corticolimbic network (3, 14), we examined differences in blood-oxygen-level-dependent (BOLD) response in the amygdala and the ventrolateral prefrontal cortex in medication-free depressed bipolar II patients and healthy comparison subjects. We also compared functional connectivity patterns to determine whether corticolimbic network abnormalities were present in the bipolar II sample. Given meta-analytic research demonstrating a reduction in ventrolateral prefrontal cortex activation in bipolar I patients across all mood states (15) and greater structural abnormalities in BA 47 in bipolar II patients relative to bipolar I patients (16), we hypothesized that depressed bipolar II patients would exhibit reduced activation in BA 47 relative to healthy comparison subjects as well as differences in amygdala response while processing angry or fearful faces. We also hypothesized that these depressed bipolar patients would demonstrate reduced negative functional connectivity in amygdala and ventrolateral prefrontal cortex circuitry. Finally, while activation in the amygdala and the prefrontal cortex was our primary focus, we conducted whole-brain analyses to identify other brain regions showing modulation during affective face processing and to determine whether regional brain activation was associated with clinical measures.

Method

Participants

Participants provided written informed consent in accordance with the institutional review boards of the University of California, Los Angeles (UCLA). Individuals with bipolar II disorder who were currently depressed and not receiving medication were recruited through the UCLA Mood Disorders Clinic and through local advertising. Healthy comparison subjects were recruited via advertisements in local newspapers and campus flyers. Healthy subjects were excluded if they had a current or past psychiatric diagnosis (including a history of substance abuse). Details regarding diagnostic assessment and additional inclusion/exclusion criteria are presented in the data supplement accompanying the online edition of this article.
Twenty-one currently depressed individuals (10 of them women) with bipolar II disorder according to Structured Clinical Interview for DSM-IV criteria were enrolled and scanned, and 21 gender-matched healthy comparison subjects of similar age were taken from a larger control data set. For both groups, MRI data acquisition spanned a period of approximately 5 years. On the day of the scan session, the severity of both hypomania and depression in bipolar patients was assessed using the Young Mania Rating Scale (17) and the 21-item Hamilton Depression Rating Scale (HAM-D) (18). A seven-item extension of the HAM-D was used to assess atypical depressive symptoms common in bipolar depression (19). At the time of the scan, none of the participants were receiving psychotropic medication. Seven bipolar patients were naive to psychotropic drugs, and the remaining 14 had been medication free for an average of 3.1 years (SD=5.1; range: 17 days–20 years) prior to scanning. (One patient had been taking 0.5 mg of a benzodiazepine until 17 days prior to the scan session.)

Experimental Stimuli and Paradigm

We used a face-matching paradigm that has been shown to reliably activate the amygdala in healthy populations (3) as well as in bipolar I patients in studies conducted by our research group (46). The task is described in detail in the online data supplement.

Whole-Brain fMRI Analysis

Details of the image acquisition parameters and behavioral data analysis are presented in the online data supplement. Functional images were excluded for movement >1 voxel peak-to-peak over 117 images. The functional MRI (fMRI) data were analyzed using fMRI Expert Analysis Tool (FEAT), version 5.98, which is part of FSL 4.1.9 (Oxford Center for Functional MRI of the Brain [FMRIB] Software Library, [www.fmrib.ox.ac.uk/fsl]). Structural images were skull stripped using the FMRIB Software Library Brain Extraction Tool and used for intrasubject registration. Motion correction was performed using MCFLIRT (Motion Correction using FMRIB's Linear Image Registration Tool). The six rigid body movement parameters were also included as regressors in the model. Images were smoothed using a Gaussian kernel (5 mm full width at half maximum). All volumes underwent grand-mean intensity normalization by a single multiplicative factor as well as high-pass temporal filtering using a Gaussian-weighted least-squares straight line fitting (sigma=37.5 seconds). Time-series statistical analysis was conducted using FMRIB's Improved Linear Model with local autocorrelation correction. Using a seven-parameter affine registration, functional images were registered to high-resolution structural images using FLIRT (FMRIB's Linear Image Registration Tool) and then aligned to the Montreal Neurological Institute (MNI)-152 atlas with a 12-parameter affine registration.
Higher-level statistical analyses for within- and between-group analyses were carried out using stages 1 and 2 of FLAME (FMRIB's Local Analysis of Mixed Effects) (20). The match emotions blocks were contrasted against the match forms blocks within groups to obtain a statistical map for each participant. To obtain within- and between-group results, z-statistic images were thresholded using clusters determined by a z value >2.0 and a cluster-corrected threshold p value <0.05 (21), corrected for whole-brain multiple comparisons using Gaussian random field theory.

Functional Connectivity Analysis

Data were analyzed using FSL and AFNI (Analysis of Functional NeuroImages [22]). Functional images were skull stripped using the AFNI program with the 3dSkullStrip and 3dAutomask commands. Functional images were motion corrected to the average functional volume using MCFLIRT with a normalized correlation ratio cost function and sinc interpolation (23). Next, the images were spatially smoothed (5 mm full width at half maximum) and temporally high-pass filtered (t>0.01 Hz), and nuisance covariates were regressed out. Nuisance covariates included the six rigid body motion parameters, average white matter, CSF, and global signal time series. The white matter and CSF time series reflected the signal from subject-specific regions of interest created using FAST (FSL's Automatic Segmentation Tool). The residuals from this analysis were normalized, scaled, and aligned to the MNI average of 152 brains (12 degrees of freedom affine transformation) after registration to high-resolution coplanar images (six degrees of freedom affine transformation) using FLIRT. In line with prior analyses of whole-brain functional connectivity utilizing a face processing paradigm (24), we employed a seed-based approach whereby the time series from the right amygdala (Harvard-Oxford Probabilistic Atlas, thresholded at 25% probability) was extracted for each participant. Using FEAT, we regressed the average amygdala time series with the times series for each brain voxel. This generated whole-brain correlation maps for each participant, which were transformed to a normal distribution using Fisher's r-to-z transformation and then combined and compared between groups using the ordinary least-squares method.
All within- and between-group connectivity maps were thresholded at z>2.0 and corrected for multiple comparisons at the cluster level (p<0.05) using Gaussian random field theory. For between-group comparisons of connectivity maps, healthy comparison > bipolar for negative connectivity was the same as bipolar > comparison for positive connectivity. Therefore, in order to identify and interpret four potential types of group differences (comparison > bipolar for regions of negative connectivity, comparison > bipolar for regions of positive connectivity, bipolar > comparison for regions of negative connectivity, and bipolar > comparison for regions of positive connectivity), we masked the group difference maps by the respective comparison and bipolar within-group negative and positive connectivity maps.

Exploratory Analyses of Clinical Variables and BOLD Response

The methods for our exploratory analyses of the association between bipolar II disorder characteristics and activation in our a priori regions of the amygdala and ventrolateral prefrontal cortex are described in the online data supplement.

Results

Participant Data

There were no significant differences between the patient and comparison groups on age, gender distribution, and ethnicity (Table 1). Additionally, the patient and comparison groups did not differ significantly in either absolute or relative motion. There was no significant correlation between medication-free duration and age at illness onset, duration of illness, duration of current episode, and current depression severity. Eleven patients had either current or past comorbid psychiatric disorders (Table 1).
TABLE 1. Demographic and Clinical Characteristics and Behavioral Performance Among Depressed Bipolar II Patients and Healthy Comparison Subjects During the Facial Affect Processing Taska
CharacteristicDepressed Bipolar II Group (N=21)Healthy Comparison Group (N=21)Between-Group Differences
 N%N%pb
Female1047.61047.61.00
Race 
  Caucasian1676.21361.90.10
  African American419.029.5 
  Asian14.8628.6 
Current comorbidity 
  Posttraumatic stress disorder29.5   
  Anorexia nervosa14.8   
  Panic disorder with agoraphobia14.8   
  Social phobia14.8   
Past comorbidity     
  Social phobia14.8   
  Substance use disorders733.3   
 MeanSDMeanSDp
Age at scanning (years)38.412.241.110.90.45
Inventory of Depressive Symptomatology–Clinician Rated score36.48.7   
Hamilton Depression Rating Scale (HAM-D) 
  21-item score19.93.8   
  28-item score26.75.2   
Young Mania Rating Scale score2.92.2   
Age at illness onset (years)17.89.0   
Duration of bipolar illness (years)21.511.9   
Duration of current depressive episode (weeks)16.722.5   
Lifetime number of major depressive episodes7.1c4.6c   
Lifetime number of hypomanic episodes5.2d6.1d   
Number of depressive episodes in past 12 months2.61.5   
Number of hypomanic episodes in past 12 months3.13.3   
Lifetime number of hospitalizations for depression0.40.8   
Accuracy (%) 
  Match emotions84.29.787.117.40.34
  Identify emotions83.78.882.910.31.00
  Match forms (control)98.02.794.712.21.00
Reaction time (seconds) 
  Match emotions2.290.492.090.500.36
  Identify emotions2.090.392.190.490.59
  Match forms (control)1.070.201.130.230.29
a
Behavioral data were missing for one depressed bipolar II patient and one healthy comparison subject. Hamilton Depression Rating Scale and Young Mania Rating Scale scores were not available for one patient. The duration of depressive episode indicated the time depressed prior to scanning and was unknown for one patient, and the lifetime number of depressive and hypomanic episodes was unknown for one patient.
b
All p values indicate two-tailed statistical significance levels.
c
The range of lifetime depressive episodes for depressed bipolar II patients was 2–15; an additional 13 patients had a number of lifetime episodes that was scored as “too many to count.”
d
The range of lifetime hypomanic episodes for depressed bipolar II patients was 1–20; an additional 11 patients had a number of lifetime episodes that was scored as “too many to count.”

Behavioral Data

No significant between-group differences were observed for response times or accuracy during performance on the match emotions, identify emotions, and match forms (control) conditions (Table 1).

Within-Group Analyses

Within-group regional patterns of activation (z>2.0, p<0.05, corrected) in the match emotions versus match forms contrast are summarized in the online data supplement. The left and right amygdalae and ventrolateral prefrontal cortices, a priori regions of interest, were robustly activated in both healthy comparison subjects and bipolar patients during performance on the face-matching paradigm (Figure 1).
FIGURE 1. Within- and Between-Group Activation Patterns in Specific Axial Slices in Healthy Comparison Subjects and Depressed Bipolar II Patients During a Face-Matching Paradigm (“Match Emotions” vs. “Match Forms” Contrast)a
a Both healthy comparison subjects and depressed bipolar II patients exhibited extensive activation in typical emotion and facial processing regions, including a priori regions (the left and right amygdalae [green circles] and the left and right ventrolateral prefrontal cortices [BA 47] [yellow circles]). Relative to healthy comparison subjects, depressed bipolar II patients exhibited significant hypoactivation in several regions, including a priori regions (left and right BA 47 and the right amygdala).

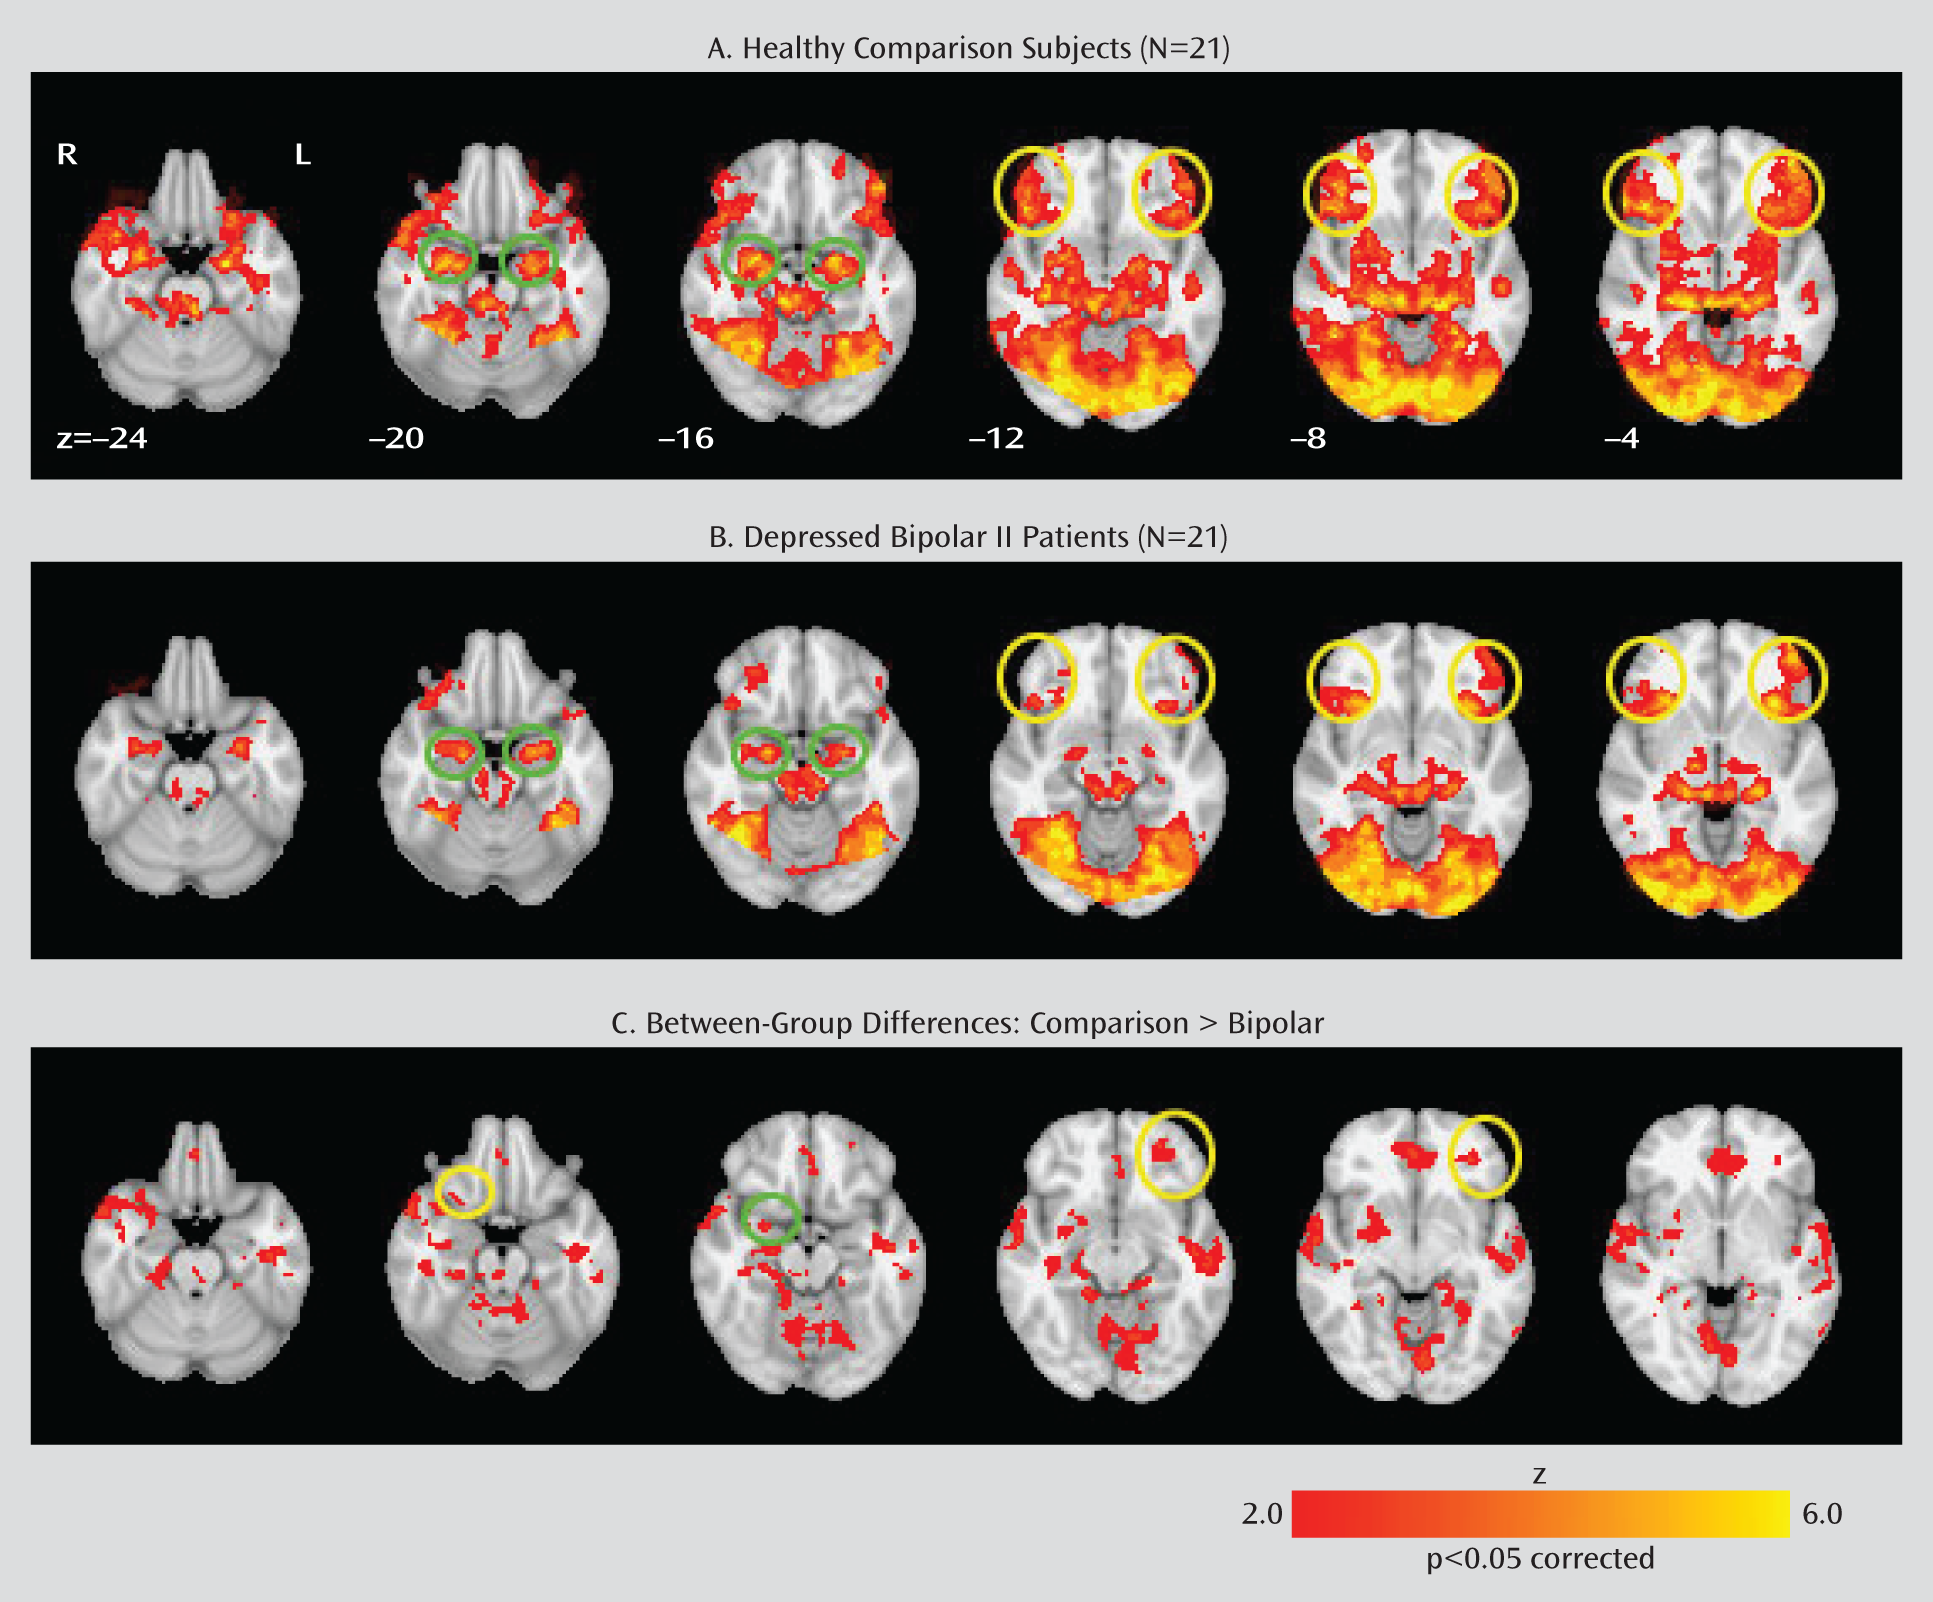
Between-Group Analyses

Random-effects analyses (comparison > bipolar) revealed significant between-group differences in the match emotions versus match forms contrast (z>2.0, p<0.05, corrected), as shown in Table 2. Relative to bipolar patients, healthy comparison subjects showed significantly greater activation in the left and right inferior frontal gyri (BA 47) and the right amygdala, also a priori regions of interest (Figure 1). Other regions in which significantly greater activation was observed in comparison subjects relative to bipolar patients were limbic and striatal regions (the left and right insula, left and right frontal gyri [BA 11], left and right anterior cingulate cortices [BA 24/32], right putamen, left and right hippocampi, middle temporal gyrus, and superior temporal gyrus), as well as the left and right supramarginal gyri, left inferior parietal lobule, and left precentral gyrus (Table 2). Conversely, bipolar patients did not exhibit significantly greater activation in any brain regions relative to comparison subjects.
TABLE 2. Between-Group Differences (Healthy Comparison > Depressed Bipolar II) in Regional Functional Activation for the “Match Emotions” Versus “Match Forms” Contrasta
RegionBrodmann's AreaMontreal Neurological Institute Coordinates (x, y, z)bz Score (Maximum)
Frontal lobe 
  Left inferior frontal gyrus47–32, 40, –83.20
  Right inferior frontal gyrus4726, 16, –202.57
  Left medial frontal gyrus11–2, 42, –163.29
  Left middle frontal gyrus11–26, 48, –122.90
  Left precentral gyrus6–42, 0, 403.40
  Left insula 38, –12, 63.33
  Right insula –36, –14, 162.27
Cingulate gyrus 
  Left dorsal anterior cingulate32–2, 44, –82.74
  Right dorsal anterior cingulate322, 44, –83.17
  Right ventral anterior cingulate24–2, 30, 182.74
Subcortical regions 
  Right amygdala 26, –2, –162.42
  Left hippocampus –36, –14, –162.26
  Right hippocampus 34, –20, –122.66
  Right putamen 26, 8, –82.77
Temporal lobe 
  Left middle temporal gyrus21–56, –22, –123.48
  Right middle temporal gyrus2160, –10, –103.67
  Left superior temporal gyrus2260, –40, 203.29
  Right superior temporal gyrus2264, –38, 143.63
  Right superior temporal gyrus3952, –58, 222.92
Parietal lobe 
  Left inferior parietal lobule40–52, –52, 403.64
  Left supramarginal gyrus39–50, –54, 323.24
  Right supramarginal gyrus4060, –52, 242.60
Occipital lobe 
  Left lingual gyrus18–4, –82, –83.53
a
Anatomical labels and Brodmann's areas, where appropriate, were assigned according to Talairach and Tournoux brain atlas registration after nonlinear coordinate conversion (www.bioimagesuite.org).
b
The data indicate coordinates of peak voxels significant at z>2.0 and p<0.05, corrected for multiple comparisons across whole-brain using Gaussian random field theory.

Within-Group Connectivity Analyses

The within-group connectivity findings are summarized in Table 3 (see also the online data supplement).
TABLE 3. Within- and Between-Group Functional Connectivity Using the Right Amygdala Seed in Healthy Comparison Subjects and Depressed Bipolar II Patientsa
  Healthy Comparison GroupDepressed Bipolar II GroupComparison > Bipolar IIBipolar II > Comparison
Right AmygdalaBAMNI Coordinates (x, y, z) PeakMaximum z ScoreMNI Coordinates (x, y, z) PeakMaximum z ScoreMNI Coordinates (x, y, z) PeakMaximum z ScoreMNI Coordinates (x, y, z) PeakMaximum z Score
Negative connectivity 
Left middle frontal gyrus46–36, 40, 184.50–44, 40, 143.05    
Right middle frontal gyrus4640, 46, 145.5240, 36, 282.7440, 46, 144.20  
Left middle frontal gyrus10–24, 54, 84.81–26, 45, –34.07    
Right middle frontal gyrus1034, 52, –64.15  34, 66, 83.72  
Right middle frontal gyrus828, 20, 523.3128, 26, 463.40    
Left superior frontal gyrus10–20, 52, 163.75–28, 68, 03.31    
Right superior frontal gyrus1030, 56, 143.64  28, 68, 43.18  
Left ventral anterior cingulate cortex24–2, 28, 202.85–2, 38, –43.92    
Right ventral anterior cingulate cortex246, 36, 183.294, 38, 43.79    
Left dorsal anterior cingulate cortex32–8, 40, 202.19–2, 38, 304.66    
Right dorsal anterior cingulate cortex326, 36, 203.312, 42, 183.63    
Left inferior parietal lobule40–40, –58, 446.25–40, –56, 425.19    
Right inferior parietal lobule4044, –58, 52,5.5752, –66, 424.7154, –44, 523.78  
Right superior parietal lobule736, –70, 524.0534, –72, 543.1026, –68, 482.69  
Left precuneus7–6, –66, 464.25–12, –66, 464.86    
Right precuneus78, –74, 404.732, –78, 524.70    
Left cuneus18/19–8, –76, 205.26–12, –76, 343.77    
Right cuneus18/198, –72, 145.268, –74, 324.67    
Positive connectivity 
Left inferior frontal gyrus47–28, 15, –152.99–18, 14, –223.06  –22, 16, –222.12
Left insula –42, –4, –83.23–42, –6, –83.88  –34, 2, 103.17
Right precentral gyrus4  60, 2, 63.13  52, –2, 122.72
Right postcentral gyrus43  56, –12, 143.23  56, –10, 143.55
Right superior temporal3842, 20, –266.1640, 18, –266.69    
Right superior temporal2250, –10, –42.4762, –2, 43.04  66, –4, 42.97
Left putamen –24, 2, –63.28–26, 4, –104.78  –30, –10, –23.01
Left amygdala –24, –6, –166.47–28, –2, –246.51  –28, –6, –202.04
Right amygdala 26, –4, –189.9522, –6, –1610.00    
Left hippocampus –24, –6, –186.38–28, –10, –187.18  –28, –8, –202.98
a
MNI=Montreal Neurological Institute; BA=Brodmann's area.

Between-Group Connectivity Analyses

Negative functional connectivity.

Relative to the comparison group, there were no regions showing significantly greater negative connectivity in the bipolar group. However, relative to the bipolar group, the comparison group exhibited significantly greater negative functional connectivity between the right amygdala and right BA 10, corresponding to the middle frontal gyrus and the superior frontal gyrus, as well as the right dorsolateral prefrontal cortex (BA 46) (Table 3, Figure 2). Comparison subjects also exhibited significantly greater negative connectivity in the right inferior and superior parietal lobules. There were no significant group differences in negative connectivity between the right amygdala and either the left or right BA 47. (As a follow-up to this analysis, we also examined between-group connectivity using a left amygdala seed and similarly found no significant group differences in negative connectivity in the ventrolateral prefrontal cortex [BA 47].)
FIGURE 2. Right Amygdala Connectivity in Healthy Comparison Subjects and Depressed Bipolar II Patientsa
a Panel A depicts the right amygdala (used as a seed region), derived from the Harvard-Oxford Probabilistic Atlas (thresholded 25% probability), on the 1-mm Montreal Neurological Institute-152 T1-standard brain. Panels B and C present the within-group connectivity maps for the comparison and bipolar groups, and Panel D presents the direct between-group contrasts, all rendered on the Inflated PALS-B12 brain atlas using the Caret software package (Computerized Anatomical Reconstruction and Editing Toolkit; Van Essen Laboratory, Washington University School of Medicine, St. Louis). Maps are thresholded at z>2.0, with correction for multiple comparisons applied at the cluster level (p<0.05). Blue circles highlight areas of greater negative connectivity with the seed region in the comparison group, and red circles highlight areas of greater positive connectivity with the seed region in the bipolar group.

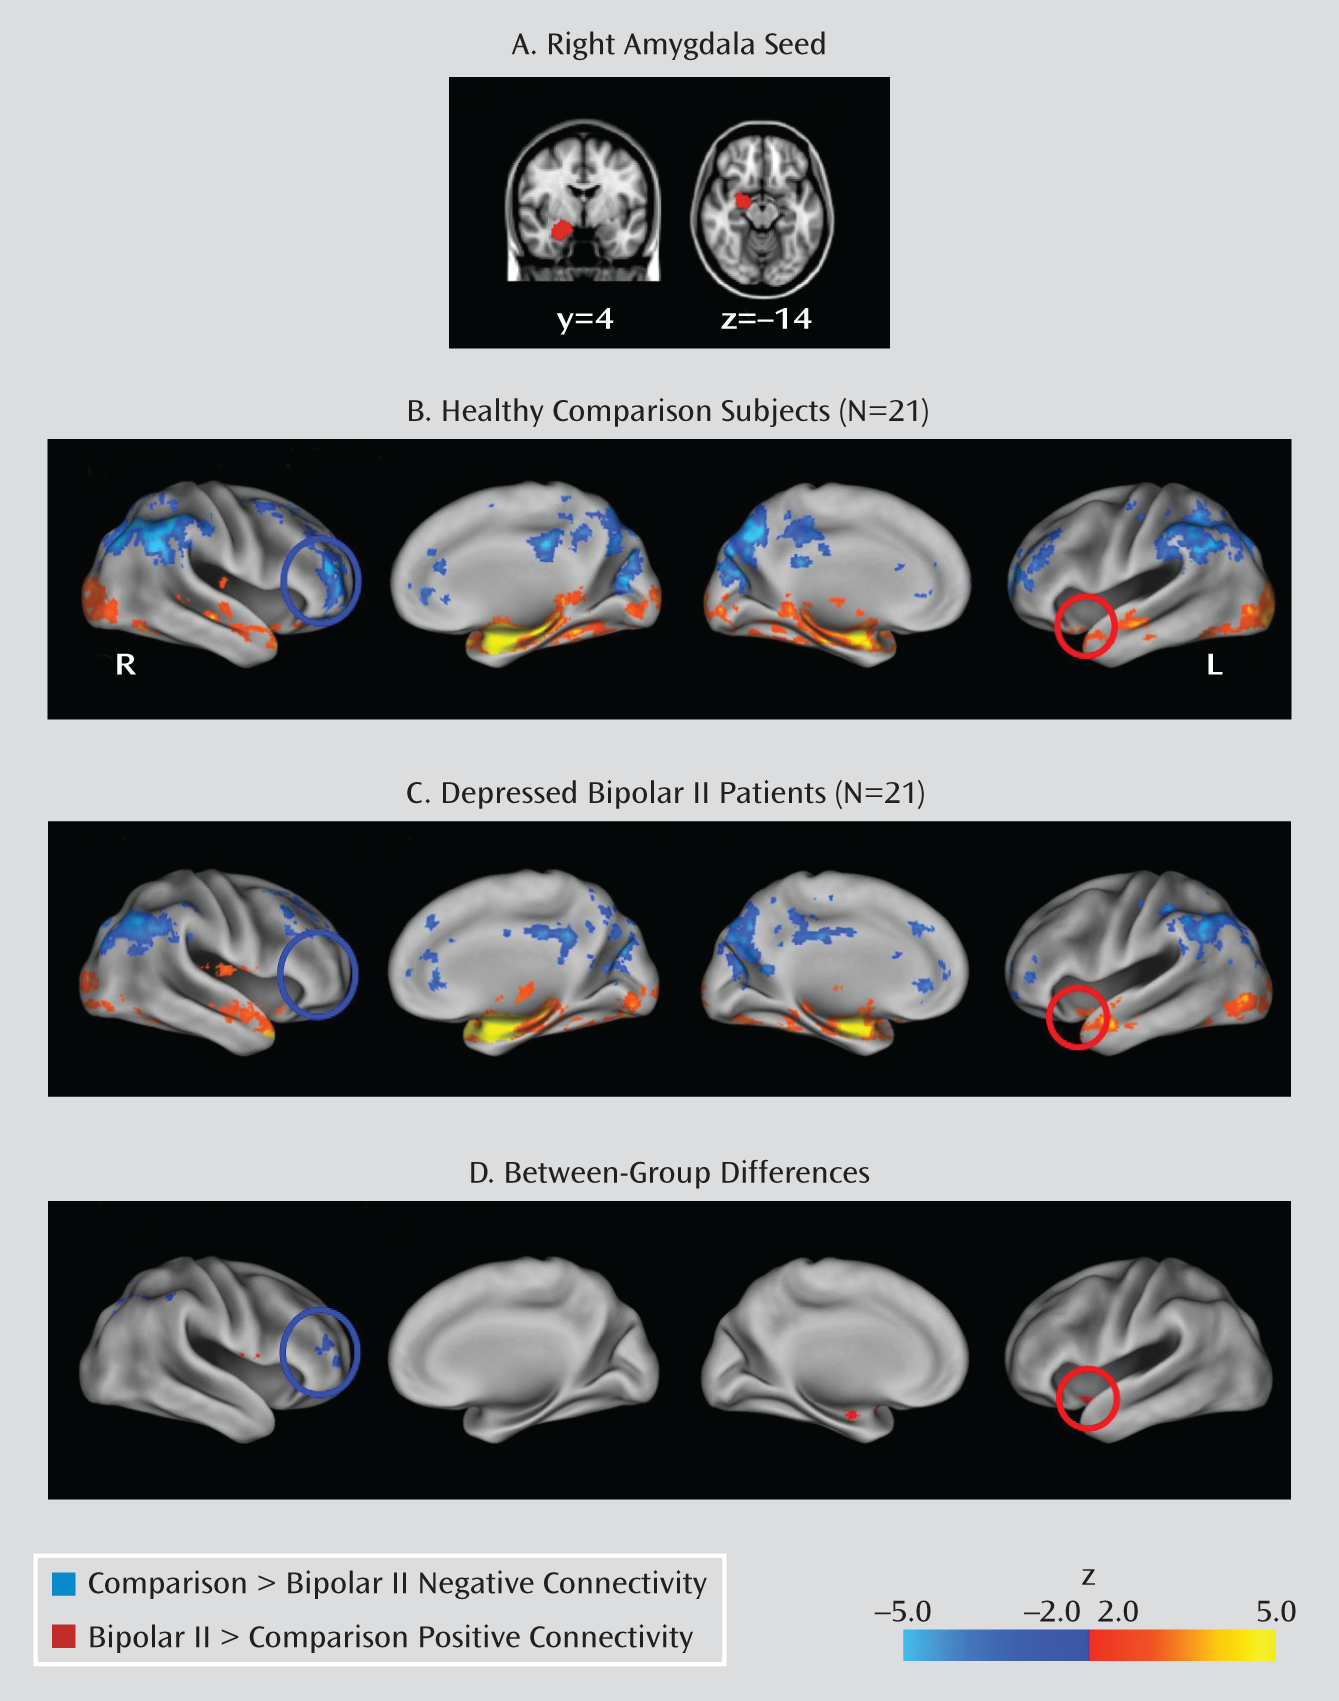
Positive functional connectivity.

Relative to healthy comparison subjects, bipolar patients exhibited significantly greater positive connectivity between the right amygdala and left BA 47, left insula (Table 3, Figure 2), right precentral gyrus, and right postcentral gyrus. The bipolar group also exhibited greater positive connectivity in the right superior temporal gyrus and left regions of the amygdala, hippocampus, and putamen. Relative to bipolar patients, healthy comparison subjects did not exhibit significantly stronger positive connectivity in any regions.

Exploratory Analyses Examining Relationships Between Clinical Variables and BOLD Response

There were no significant associations between illness duration, age at illness onset, and duration of current depressive episode or between current depression severity and activation in the left or right inferior frontal regions (BA 44, 45, and 47) or in the amygdala.

Discussion

Our results indicate that during performance on the face-matching fMRI activation task, both healthy comparison subjects and nonmedicated depressed bipolar II patients exhibited significant bilateral activation in the amygdala and ventrolateral prefrontal cortex (BA 47), regions that are important for emotion processing and regulation. However, relative to comparison subjects, bipolar patients exhibited a significant reduction in activation in the right amygdala and left and right BA 47. Additionally, we found that relative to comparison subjects, bipolar patients exhibited reduced negative connectivity between the right amygdala and frontal brain regions, including the right dorsolateral prefrontal cortex and right orbitofrontal cortex (BA 10). We also found that bipolar patients demonstrated stronger positive functional coupling than comparison subjects between the amygdala and the insula, hippocampus, superior temporal gyrus, putamen, and left BA 47.
Using this face-matching task, significant ventrolateral prefrontal cortex attenuation has been observed in depressed bipolar I patients (6), medicated euthymic bipolar I patients (25), and manic patients (4, 5). Our finding of ventrolateral prefrontal cortex attenuation in bipolar II depression converges with other assessments of orbitofrontal cortex and ventrolateral prefrontal cortex function in bipolar I patients during mania, depression, and even euthymia (11, 15, 26, 27), suggesting that this regional hypoactivation is independent of mood state. Hypoactivation in the ventrolateral prefrontal cortex may represent a physiologic trait marker of bipolar disorder that reflects the inability to regulate emotion that may then lead to hypomanic or depressed states. This deficit in ventrolateral prefrontal cortex function may underlie vulnerability to experiencing future mood episodes as a result of an impaired emotion regulatory network.
The decreased activation in the right amygdala that we observed is contralateral to that observed in manic patients (4, 5). Interestingly, euthymic bipolar I patients have demonstrated no significant differences in amygdala activation relative to comparison subjects while performing this same paradigm (25), suggesting that amygdala activation in bipolar disorder may be state dependent. Studies of bipolar I depression using affective face stimuli have reported either increased amygdala activation (7, 8, 10, 13) in bipolar I patients relative to comparison subjects or no significant between-group differences (6, 9, 11) in this region. Our observation of amygdala hypoactivation in bipolar II depression may reflect a potential difference between the subtypes of bipolar disorder. However, the nature of the perceptual face-matching task may contribute, in part, to decreased neural response in the right (but not left) amygdala, since studies of healthy subjects have shown that the right amygdala is often engaged during implicit processing tasks (28). Different rates of habituation for the amygdala may also contribute to an explanation for the hemispheric lateralization given that the right amygdala, compared with the left, responds to fearful faces more rapidly but displays a faster decrease in response over time (29). Moreover, while the left amygdala is associated with the processing of negative expression, the right amygdala appears to be more involved in face processing, regardless of emotional valence (30).
We observed neural hypoactivation in depressed bipolar II patients throughout a facial emotion processing network, including subcortical and occipito-temporal regions, such as the middle temporal gyrus and superior temporal gyrus, as well as the insula, anterior cingulate, putamen, inferior parietal lobule, and lingual gyrus. Affective face processing may rely on the interplay between initial perceptual processing by a core “face-responsive network,” including the fusiform gyrus and superior temporal sulcus, and the extended “affective network” (31, 32), comprised of temporal-limbic and prefrontal regions involved in emotion evaluation and modulation. Thus, reduced activation in regions pertinent to both networks may explain impairments found in individuals with bipolar II depression. Notably, we did not observe group differences in fusiform gyrus activation but found that depressed bipolar II patients exhibited reduced activity in the left and right superior temporal gyri/middle temporal gyri, regions involved in processing social cues (33, 34). Activity in the right superior temporal sulcus covaries with activation in the right amygdala during implicit processing of fearful facial expressions (35, 36).
Our functional connectivity findings did not reveal significantly reduced negative ventrolateral prefrontal cortex and amygdala coupling in bipolar II patients. However, we observed that bipolar patients, relative to comparison subjects, exhibited decreased negative functional amygdala connectivity with right prefrontal areas implicated in emotion regulation (BA 10 and 46) as well as with the right inferior and superior parietal lobules. Whereas BA 47 uses integrated sensory/emotional stimuli to modulate limbic output, the dorsolateral prefrontal cortex (BA 9/46), which is implicated in emotional learning and memory, integrates cognitive centers to modulate emotional reactivity (37). The fact that bipolar patients had reduced negative functional connectivity between the amygdala and BA 46 may indicate that they have impairment in adaptive cognitive strategies to offset negative reactions to emotional stimuli (e.g., fearful and angry faces, as in the study paradigm). The hemispheric lateralization of our findings warrants further exploration and replication.
While we did not expect to find group differences in connectivity between the amygdala and the inferior parietal lobule, this is a region that has been shown to respond to negatively valenced faces (3840). Moreover, lesions in the inferior parietal lobule have been associated with impaired recognition specifically of fear and sadness in faces (41). Prior research has demonstrated hypoactivation in the inferior parietal lobule in depressed bipolar I patients (7, 13), and our study extends these findings to patients with bipolar II depression. Despite the amygdala's preeminent role in social information processing, a recent study further demonstrated that in the absence of a functional amygdala, increased activity in the inferior parietal lobule may be an adaptive compensatory mechanism for its pathology (42). Notably, our connectivity results provide evidence for reduced negative coupling in the amygdala and inferior parietal lobule circuitry in depressed bipolar II patients relative to healthy comparison subjects, which may contribute, in part, to these patients' difficulties in fear and social signal processing.
In addition to the observed group differences in negative connectivity, we found that depressed bipolar II patients exhibited significantly greater positive connectivity between the right amygdala and left BA 47 relative to healthy subjects. This finding is consistent with results from functional connectivity studies of depressed bipolar I patients in which patients demonstrated significantly greater connectivity in the right amygdala and ventrolateral prefrontal cortex in response to sad faces than did healthy subjects (43). It has been proposed that increased positive connectivity in this fronto-limbic network in response to negative facial expressions may be a potential trait marker of bipolar I disorder (43); however, within-subject longitudinal studies are needed for bipolar II disorder. We observed increased positive connectivity in depressed bipolar II patients relative to healthy subjects between the amygdala and the insula, superior temporal gyrus, putamen, and hippocampus. Enhanced amygdala-insula functional coupling may mediate anxious anticipation of aversive events (44) and may be a mechanism of hypervigilance in anxiety disorders (45). Moreover, dispositional negative affectivity, which is marked by generalized hypervigilance, has been shown to predict the degree of activity in the amygdala and superior temporal gyrus in response to invisible fearful faces (36). In individuals with bipolar II depression, hypervigilance may also be associated with increased positive coupling between such limbic-paralimbic regions.
To our knowledge, only one other emotion-focused fMRI study of nonmedicated depressed bipolar II patients has been published (12), and the authors reported no significant between-group differences in amygdala or prefrontal cortex activation. Possible explanations for the discrepant findings may be their inclusion of only male participants and the use of neutral faces as the baseline contrast rather than the geometric forms used in our study. Neutral faces, in particular, have been shown to elicit greater baseline amygdala reactivity in individuals with bipolar I depression (10), which may result in less relative activation versus baseline differences. Similarly, the inconsistent amygdala activation results across published studies of bipolar I depression could be a result of studies combining patients in different mood states (8), conflating the type I and type II subtypes of bipolar disorder (13), using psychotropic medications, or employing task designs that use varied affective faces (7, 8, 10). Aside from carefully controlling for all of these variables, our study reduced task variability by our inclusion of only angry and fearful faces as targets, since these negative emotions more robustly activate the amygdala than positive emotions (39).
There are several limitations to this study. First, we did not exclude patients with a current or past axis I comorbidity, and four patients had a current or past anxiety disorder. However, since previous studies have generally reported increased amygdala activation in individuals with posttraumatic stress disorder, social phobia, and specific phobia (46) in response to emotional faces, our observation of a reduction in amygdala activation in bipolar II depression is opposite to the direction of the findings in most studies of anxiety disorders. It is therefore unlikely that the observed deficit in the amygdala may be attributed solely to a comorbid anxiety disorder rather than directly linked to bipolar II disorder itself. While the inclusion of bipolar II patients with comorbid DSM-IV diagnoses increases the generalizability of our results, studies including individuals without comorbidity should be conducted. Second, we did not include a group of bipolar II patients in other mood states and therefore did not examine whether brain connectivity or regional activation in response to emotional facial expressions differentiated the remitted, hypomanic, and depressed phases of bipolar II disorder.
Notwithstanding these limitations, our study fills an important knowledge gap regarding the patterns of abnormal neural activation and connectivity in fronto-limbic regions in nonmedicated depressed bipolar II patients. Future studies could evaluate how the neural mechanisms affected in bipolar II depression compare with those in major depressive disorder or bipolar I depression, which may help reveal a unique neural signature of each disorder. Finally, an increased understanding of emotional reactivity and processing in bipolar II depression and identification of neural predictors of treatment response may lead to pharmacological treatment interventions that reduce the morbidity and mortality associated with this disorder.

Acknowledgments

The authors thank Jeffrey Fischer, B.A., Ana R. Aquino, B.S., and the University of California, Los Angeles, Deutsch Mood Disorders fellows for conducting the diagnostic interviews and assessment. The authors also thank Jacquelyn Dang, B.S., for assistance with data entry; Catherine A. Sugar, Ph.D., for statistical consultation; and Christopher J. Patrick, Ph.D., and John Brooks III, M.D., Ph.D., for editorial support.

Footnotes

Received March 2, 2011; revisions received Sept. 12, 2011, and Feb. 19, 2012; accepted March 16, 2012.
The contents of this article are solely the responsibility of the authors and do not necessarily represent the official views of NIMH, the National Center for Research Resources, or NIH.

Supplementary Material

File (appi.ajp.2012.11030349.ds001.pdf)
Supplementary text

References

1.
Judd LL, Akiskal HS, Schettler PJ, Coryell W, Endicott J, Maser JD, Solomon DA, Leon AC, Keller MB: A prospective investigation of the natural history of the long-term weekly symptomatic status of bipolar II disorder. Arch Gen Psychiatry 2003; 60:261–269
2.
Vieta E, Suppes T: Bipolar II disorder: arguments for and against a distinct diagnostic entity. Bipolar Disord 2008; 10:163–178
3.
Hariri AR, Bookheimer SY, Mazziotta JC: Modulating emotional responses: effects of a neocortical network on the limbic system. Neuroreport 2000; 11:43–48
4.
Foland LC, Altshuler LL, Bookheimer SY, Eisenberger N, Townsend J, Thompson PM: Evidence for deficient modulation of amygdala response by prefrontal cortex in bipolar mania. Psychiatry Res 2008; 162:27–37
5.
Altshuler L, Bookheimer S, Proenza MA, Townsend J, Sabb F, Firestine A, Bartzokis G, Mintz J, Mazziotta J, Cohen MS: Increased amygdala activation during mania: a functional magnetic resonance imaging study. Am J Psychiatry 2005; 162:1211–1213
6.
Altshuler L, Bookheimer S, Townsend J, Proenza MA, Sabb F, Mintz J, Cohen MS: Regional brain changes in bipolar I depression: a functional magnetic resonance imaging study. Bipolar Disord 2008; 10:708–717
7.
Malhi GS, Lagopoulos J, Ward PB, Kumari V, Mitchell PB, Parker GB, Ivanovski B, Sachdev P: Cognitive generation of affect in bipolar depression: an fMRI study. Eur J Neurosci 2004; 19:741–754
8.
Lawrence NS, Williams AM, Surguladze S, Giampietro V, Brammer MJ, Andrew C, Frangou S, Ecker C, Phillips ML: Subcortical and ventral prefrontal cortical neural responses to facial expressions distinguish patients with bipolar disorder and major depression. Biol Psychiatry 2004; 55:578–587
9.
Chen CH, Lennox B, Jacob R, Calder A, Lupson V, Bisbrown-Chippendale R, Suckling J, Bullmore E: Explicit and implicit facial affect recognition in manic and depressed states of bipolar disorder: a functional magnetic resonance imaging study. Biol Psychiatry 2006; 59:31–39
10.
Almeida JR, Versace A, Hassel S, Kupfer DJ, Phillips ML: Elevated amygdala activity to sad facial expressions: a state marker of bipolar but not unipolar depression. Biol Psychiatry 2010; 67:414–421
11.
Van der Schot A, Kahn R, Ramsey N, Nolen W, Vink M: Trait and state dependent functional impairments in bipolar disorder. Psychiatry Res 2010; 184:135–142
12.
Marchand WR, Lee JN, Garn C, Thatcher J, Gale P, Kreitschitz S, Johnson S, Wood N: Aberrant emotional processing in posterior cortical midline structures in bipolar II depression. Prog Neuropsychopharmacol Biol Psychiatry 2011; 35:1729–1737
13.
Hulvershorn LA, Karne H, Gunn AD, Hartwick SL, Wang Y, Hummer TA, Anand A: Neural activation during facial emotion processing in unmedicated bipolar depression, euthymia, and mania. Biol Psychiatry 2011; 71:603–610
14.
Hariri AR, Drabant EM, Munoz KE, Kolachana BS, Mattay VS, Egan MF, Weinberger DR: A susceptibility gene for affective disorders and the response of the human amygdala. Arch Gen Psychiatry 2005; 62:146–152
15.
Chen CH, Suckling J, Lennox BR, Ooi C, Bullmore ET: A quantitative meta-analysis of fMRI studies in bipolar disorder. Bipolar Disord 2011; 13:1–15
16.
Liu JX, Chen YS, Hsieh JC, Su TP, Yeh TC, Chen LF: Differences in white matter abnormalities between bipolar I and II disorders. J Affect Disord 2010; 127:309–315
17.
Young RC, Biggs JT, Ziegler VE, Meyer DA: A rating scale for mania: reliability, validity and sensitivity. Br J Psychiatry 1978; 133:429–435
18.
Hamilton M: A rating scale for depression. J Neurol Neurosurg Psychiatry 1960; 23:56–62
19.
Benazzi F: Depression with DSM-IV atypical features: a marker for bipolar II disorder. Eur Arch Psychiatry Clin Neurosci 2000; 250:53–55
20.
Beckmann CF, Jenkinson M, Smith SM: General multilevel linear modeling for group analysis in fMRI. Neuroimage 2003; 20:1052–1063
21.
Worsley KJ: Statistical analysis of activation images, in Functional MRI: An Introduction to Methods. Edited by, Jezzard P, Matthews PM, Smith SM. New York, Oxford University Press, 2001, pp 251–270
22.
Cox RW: AFNI: Software for analysis and visualization of functional magnetic resonance neuroimages. Comput Biomed Res 1996; 29:162–173
23.
Jenkinson M, Bannister P, Brady M, Smith S: Improved optimization for the robust and accurate linear registration and motion correction of brain images. Neuroimage 2002; 17:825–841
24.
Rudie JD, Shehzad Z, Hernandez LM, Colich NL, Bookheimer SY, Iacoboni M, Dapretto M: Reduced functional integration and segregation of distributed neural systems underlying social and emotional information processing in autism spectrum disorders. Cereb Cortex 2012; 22:1025–1037
25.
Foland-Ross LC, Bookheimer SY, Lieberman MD, Sugar CA, Townsend JD, Fischer J, Torrisi S, Penfold C, Madsen SK, Thompson PM, Altshuler LL: Normal amygdala activation but deficient ventrolateral prefrontal activation in adults with bipolar disorder during euthymia. Neuroimage 2012; 59:738–744
26.
Blumberg HP, Leung HC, Skudlarski P, Lacadie CM, Fredericks CA, Harris BC, Charney DS, Gore JC, Krystal JH, Peterson BS: A functional magnetic resonance imaging study of bipolar disorder: state- and trait-related dysfunction in ventral prefrontal cortices. Arch Gen Psychiatry 2003; 60:601–609
27.
Elliott R, Ogilvie A, Rubinsztein JS, Calderon G, Dolan RJ, Sahakian BJ: Abnormal ventral frontal response during performance of an affective go/no go task in patients with mania. Biol Psychiatry 2004; 55:1163–1170
28.
Costafreda SG, Brammer MJ, David AS, Fu CH: Predictors of amygdala activation during the processing of emotional stimuli: a meta-analysis of 385 PET and fMRI studies. Brain Res Rev 2008; 58:57–70
29.
Phillips ML, Medford N, Young AW, Williams L, Williams SC, Bullmore ET, Gray JA, Brammer MJ: Time courses of left and right amygdalar responses to fearful facial expressions. Hum Brain Mapp 2001; 12:193–202
30.
Iidaka T, Omori M, Murata T, Kosaka H, Yonekura Y, Okada T, Sadato N: Neural interaction of the amygdala with the prefrontal and temporal cortices in the processing of facial expressions as revealed by fMRI. J Cogn Neurosci 2001; 13:1035–1047
31.
Bruce V, Young A: Understanding face recognition. Br J Psychol 1986; 77:305–327
32.
Haxby JV, Hoffman EA, Gobbini MI: The distributed human neural system for face perception. Trends Cogn Sci 2000; 4:223–233
33.
Allison T, Puce A, McCarthy G: Social perception from visual cues: role of the STS region. Trends Cogn Sci 2000; 4:267–278
34.
Kourtzi Z, Kanwisher N: Activation in human MT/MST by static images with implied motion. J Cogn Neurosci 2000; 12:48–55
35.
Jiang Y, He S: Cortical responses to invisible faces: dissociating subsystems for facial-information processing. Curr Biol 2006; 16:2023–2029
36.
Vizueta N, Patrick CJ, Jiang Y, Thomas KM, He S: Dispositional fear, negative affectivity, and neuroimaging response to visually suppressed emotional faces. Neuroimage 2012; 59:761–771
37.
Kim MJ, Loucks RA, Palmer AL, Brown AC, Solomon KM, Marchante AN, Whalen PJ: The structural and functional connectivity of the amygdala: from normal emotion to pathological anxiety. Behav Brain Res 2011; 223:403–410
38.
Lang PJ, Bradley MM, Fitzsimmons JR, Cuthbert BN, Scott JD, Moulder B, Nangia V: Emotional arousal and activation of the visual cortex: an fMRI analysis. Psychophysiology 1998; 35:199–210
39.
Fusar-Poli P, Placentino A, Carletti F, Landi P, Allen P, Surguladze S, Benedetti F, Abbamonte M, Gasparotti R, Barale F, Perez J, McGuire P, Politi P: Functional atlas of emotional faces processing: a voxel-based meta-analysis of 105 functional magnetic resonance imaging studies. J Psychiatry Neurosci 2009; 34:418–432
40.
Vytal K, Hamann S: Neuroimaging support for discrete neural correlates of basic emotions: a voxel-based meta-analysis. J Cogn Neurosci 2010; 22:2864–2885
41.
Adolphs R, Damasio H, Tranel D, Damasio AR: Cortical systems for the recognition of emotion in facial expressions. J Neurosci 1996; 16:7678–7687
42.
Becker B, Mihov Y, Scheele D, Kendrick KM, Feinstein JS, Matusch A, Aydin M, Reich H, Urbach H, Oros-Peusquens AM, Shah NJ, Kunz WS, Schlaepfer TE, Zilles K, Maier W, Hurlemann R: Fear processing and social networking in the absence of a functional amygdala. Biol Psychiatry (Epub ahead of print, Jan 2, 2012)
43.
Versace A, Thompson WK, Zhou D, Almeida JR, Hassel S, Klein CR, Kupfer DJ, Phillips ML: Abnormal left and right amygdala-orbitofrontal cortical functional connectivity to emotional faces: state versus trait vulnerability markers of depression in bipolar disorder. Biol Psychiatry 2010; 67:422–431
44.
Carlson JM, Greenberg T, Rubin D, Mujica-Parodi LR: Feeling anxious: anticipatory amygdalo-insular response predicts the feeling of anxious anticipation. Soc Cogn Affect Neurosci 2011; 6:74–81
45.
Rabinak CA, Angstadt M, Welsh RC, Kenndy AE, Lyubkin M, Martis B, Phan KL: Altered amygdala resting-state functional connectivity in post-traumatic stress disorder. Front Psychiatry 2011; 2:62
46.
Shin LM, Liberzon I: The neurocircuitry of fear, stress, and anxiety disorders. Neuropsychopharmacology 2010; 35:169–191

Information & Authors

Information

Published In

Go to American Journal of Psychiatry
American Journal of Psychiatry
Pages: 831 - 840
PubMed: 22773540

History

Received: 2 March 2011
Revision received: 12 September 2011
Revision received: 19 February 2012
Accepted: 16 March 2012
Published online: 1 August 2012
Published in print: August 2012

Authors

Affiliations

Nathalie Vizueta, Ph.D.
From the Semel Institute for Neuroscience and Human Behavior, the Department of Psychiatry and Biobehavioral Sciences, and the Ahmanson-Lovelace Brain Mapping Center and Neuroscience Interdepartmental Program, David Geffen School of Medicine, University of California, Los Angeles; and the Department of Psychiatry, VA Greater Los Angeles Healthcare System, West Los Angeles Healthcare Center, Los Angeles.
Jeffrey D. Rudie, Ph.D.
From the Semel Institute for Neuroscience and Human Behavior, the Department of Psychiatry and Biobehavioral Sciences, and the Ahmanson-Lovelace Brain Mapping Center and Neuroscience Interdepartmental Program, David Geffen School of Medicine, University of California, Los Angeles; and the Department of Psychiatry, VA Greater Los Angeles Healthcare System, West Los Angeles Healthcare Center, Los Angeles.
Jennifer D. Townsend, B.A.
From the Semel Institute for Neuroscience and Human Behavior, the Department of Psychiatry and Biobehavioral Sciences, and the Ahmanson-Lovelace Brain Mapping Center and Neuroscience Interdepartmental Program, David Geffen School of Medicine, University of California, Los Angeles; and the Department of Psychiatry, VA Greater Los Angeles Healthcare System, West Los Angeles Healthcare Center, Los Angeles.
Salvatore Torrisi, M.A.
From the Semel Institute for Neuroscience and Human Behavior, the Department of Psychiatry and Biobehavioral Sciences, and the Ahmanson-Lovelace Brain Mapping Center and Neuroscience Interdepartmental Program, David Geffen School of Medicine, University of California, Los Angeles; and the Department of Psychiatry, VA Greater Los Angeles Healthcare System, West Los Angeles Healthcare Center, Los Angeles.
Teena D. Moody, Ph.D.
From the Semel Institute for Neuroscience and Human Behavior, the Department of Psychiatry and Biobehavioral Sciences, and the Ahmanson-Lovelace Brain Mapping Center and Neuroscience Interdepartmental Program, David Geffen School of Medicine, University of California, Los Angeles; and the Department of Psychiatry, VA Greater Los Angeles Healthcare System, West Los Angeles Healthcare Center, Los Angeles.
Susan Y. Bookheimer, Ph.D.
From the Semel Institute for Neuroscience and Human Behavior, the Department of Psychiatry and Biobehavioral Sciences, and the Ahmanson-Lovelace Brain Mapping Center and Neuroscience Interdepartmental Program, David Geffen School of Medicine, University of California, Los Angeles; and the Department of Psychiatry, VA Greater Los Angeles Healthcare System, West Los Angeles Healthcare Center, Los Angeles.
Lori L. Altshuler, M.D.
From the Semel Institute for Neuroscience and Human Behavior, the Department of Psychiatry and Biobehavioral Sciences, and the Ahmanson-Lovelace Brain Mapping Center and Neuroscience Interdepartmental Program, David Geffen School of Medicine, University of California, Los Angeles; and the Department of Psychiatry, VA Greater Los Angeles Healthcare System, West Los Angeles Healthcare Center, Los Angeles.

Notes

Address correspondence to Dr. Vizueta ([email protected]).

Funding Information

Dr. Altshuler has served on the advisory boards or speakers bureaus of Forest Laboratories, Merck, and Sepracor and has served as a consultant to Eli Lilly. All other authors report no financial relationships with commercial interests.Supported by NIMH grants (K24 MH-01848, T32 MH-17140) and a fellowship from the University of California, Los Angeles, Integrative Study Center in Mood Disorders to Dr. Vizueta; by grants from the National Center for Research Resources (RR12169, RR13642, and RR00865); and by the Ahmanson Foundation, the Brain Mapping Medical Research Organization, the Brain Mapping Support Foundation, the Capital Group Companies Charitable Foundation, the Jennifer Jones-Simon Foundation, the Northstar Fund, the Pierson-Lovelace Foundation, the Robson Family, the Tamkin Foundation, and the William M. and Linda R. Dietel Philanthropic Fund at the Northern Piedmont Community Foundation.

Metrics & Citations

Metrics

Citations

Export Citations

If you have the appropriate software installed, you can download article citation data to the citation manager of your choice. Simply select your manager software from the list below and click Download.

For more information or tips please see 'Downloading to a citation manager' in the Help menu.

Format
Citation style
Style
Copy to clipboard

There are no citations for this item

View Options

View options

PDF/ePub

View PDF/ePub

Get Access

Login options

Already a subscriber? Access your subscription through your login credentials or your institution for full access to this article.

Personal login Institutional Login Open Athens login
Purchase Options

Purchase this article to access the full text.

PPV Articles - American Journal of Psychiatry

PPV Articles - American Journal of Psychiatry

Not a subscriber?

Subscribe Now / Learn More

PsychiatryOnline subscription options offer access to the DSM-5-TR® library, books, journals, CME, and patient resources. This all-in-one virtual library provides psychiatrists and mental health professionals with key resources for diagnosis, treatment, research, and professional development.

Need more help? PsychiatryOnline Customer Service may be reached by emailing [email protected] or by calling 800-368-5777 (in the U.S.) or 703-907-7322 (outside the U.S.).

Media

Figures

Other

Tables

Share

Share

Share article link

Share