Randomized Trial of an Electronic Personal Health Record for Patients With Serious Mental Illnesses
Abstract
Objective
Method
Results
Conclusions
Method
Overview
Intervention

Recruitment and Randomization
Outcome Assessment
Data Analysis
Results
Study Flow, Participant Characteristics, and Use of the Personal Health Record

| Characteristic | Study Arm | Analysis | |||
|---|---|---|---|---|---|
| Personal Health Record (N=85) | Usual Care (N=85) | ||||
| Mean | SD | Mean | SD | p | |
| Age (years) | 49.3 | 7.1 | 49.3 | 8.1 | 0.98 |
| Income (monthly [U.S. dollars]) | 554.8 | 379.4 | 607.9 | 448.6 | 0.41 |
| Number of medical comorbidities | 2.3 | 1.5 | 2.3 | 1.3 | 0.74 |
| N | % | N | % | p | |
| Male | 43 | 50.6 | 41 | 48.2 | 0.76 |
| Race/ethnicity | |||||
| White | 13 | 15.3 | 8 | 9.4 | 0.24 |
| Black | 68 | 80 | 74 | 87.1 | 0.21 |
| Hispanic | 0 | 0 | 2 | 2.4 | 0.15 |
| Single | 45 | 54.2 | 38 | 44.7 | 0.21 |
| Stable housing | 66 | 79.5 | 71 | 83.5 | 0.50 |
| Stable employment | 41 | 49.4 | 52 | 61.2 | 0.12 |
| Disability | 23 | 27.1 | 26 | 30.6 | 0.61 |
| Medical diagnosis | |||||
| Asthma | 19 | 22.4 | 21 | 24.7 | 0.72 |
| Osteoarthritis | 29 | 34.1 | 17 | 20 | 0.03 |
| Chronic obstructive pulmonary disease | 8 | 9.4 | 10 | 11.8 | 0.61 |
| Coronary artery disease | 10 | 11.8 | 8 | 9.4 | 0.61 |
| HIV | 2 | 2.4 | 7 | 8.2 | 0.08 |
| Hepatitis | 15 | 17.7 | 19 | 22.4 | 0.44 |
| Active tuberculosis | 3 | 3.5 | 2 | 2.4 | 0.65 |
| Cardiometabolic conditions | 58 | 68.2 | 60 | 70.6 | 0.74 |
| Diabetes | 20 | 23.5 | 22 | 25.9 | 0.72 |
| Hyperlipidemia | 36 | 42.4 | 28 | 32.9 | 0.21 |
| Hypertension | 55 | 64.7 | 57 | 67.1 | 0.75 |
| Mental diagnosis | |||||
| Schizophrenia | 21 | 24.7 | 26 | 30.6 | 0.39 |
| Bipolar disorder | 14 | 16.5 | 6 | 7.1 | 0.06 |
| Depression | 40 | 47.1 | 41 | 48.2 | 0.89 |
| Substance use disorder | 2 | 2.4 | 7 | 8.2 | 0.09 |
| Other mental illness | 4 | 4.7 | 1 | 1.2 | 0.17 |
Effects on Quality of Medical Care
| Variable | Study Arm | Analysis | |||||
|---|---|---|---|---|---|---|---|
| Personal Health Record | Usual Care | ||||||
| Mean | SD | Mean | SD | F | df | pa | |
| Quality of preventive services | |||||||
| Physical examination | 12.78 | 169 | 0.0005 | ||||
| Baseline | 0.53 | 0.18 | 0.55 | 0.14 | |||
| 12-Month interview | 0.55 | 0.13 | 0.46 | 0.21 | |||
| Screening | 5.76 | 169 | 0.02 | ||||
| Baseline | 0.29 | 0.13 | 0.33 | 0.16 | |||
| 12-Month interview | 0.21 | 0.16 | 0.18 | 0.15 | |||
| Vaccination | 20.13 | 169 | <0.0001 | ||||
| Baseline | 0.08 | 0.12 | 0.08 | 0.13 | |||
| 12-Month interview | 0.19 | 0.2 | 0.06 | 0.09 | |||
| Education | 153.82 | 168 | <0.0001 | ||||
| Baseline | 0.17 | 0.16 | 0.17 | 0.16 | |||
| 12-Month interview | 0.73 | 0.34 | 0.15 | 0.16 | |||
| Preventive care for women | 0.19 | 85 | 0.66 | ||||
| Baseline | 0.32 | 0.37 | 0.27 | 0.33 | |||
| 12-Month interview | 0.27 | 0.31 | 0.27 | 0.3 | |||
| Preventive care for men | 0.4 | 83 | 0.53 | ||||
| Baseline | 0.16 | 0.28 | 0.15 | 0.23 | |||
| 12-Month interview | 0.14 | 0.27 | 0.09 | 0.19 | |||
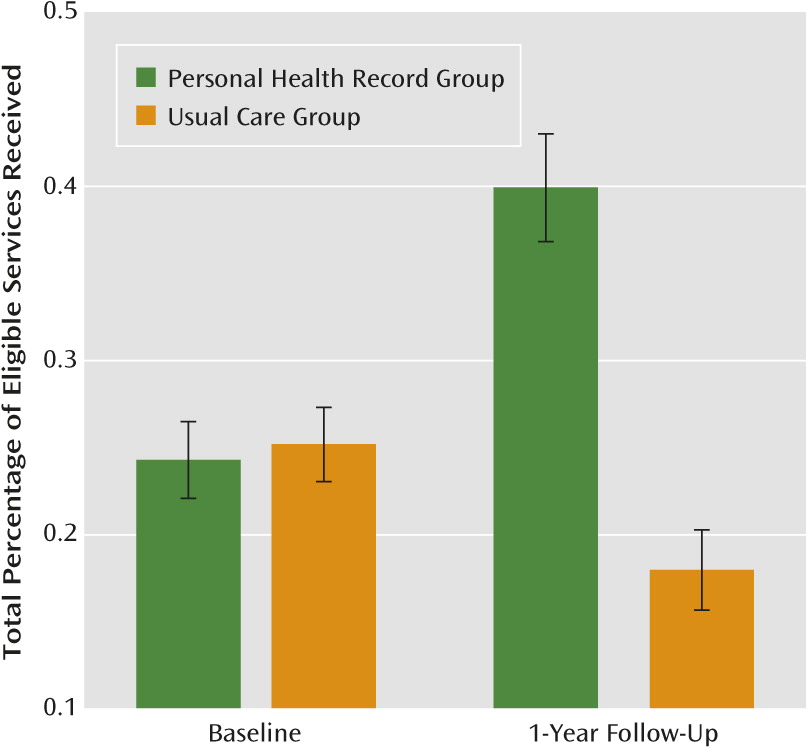
| Total percentage of eligible services receivedb | 99.35 | 169 | <0.0001 | ||||
| Baseline | 0.24 | 0.1 | 0.25 | 0.1 | |||
| 12-Month interview | 0.4 | 0.14 | 0.18 | 0.11 | |||
| Quality of cardiometabolic services | |||||||
| Hypertension | 9.98 | 169 | 0.002 | ||||
| Baseline | 0.73 | 0.24 | 0.78 | 0.2 | |||
| 12-Month interview | 0.78 | 0.19 | 0.7 | 0.3 | |||
| Hyperlipidemia | 0.04 | 34 | 0.85 | ||||
| Baseline | 0.87 | 0.34 | 0.92 | 0.28 | |||
| 12-Month interview | 0.71 | 0.46 | 0.86 | 0.35 | |||
| Diabetes | 3.02 | 36 | 0.09 | ||||
| Baseline | 0.42 | 0.25 | 0.58 | 0.25 | |||
| 12-Month interview | 0.54 | 0.22 | 0.51 | 0.27 | |||
| Total percentage of eligible services receivedb | 9.39 | 169 | 0.003 | ||||
| Baseline | 0.73 | 0.24 | 0.78 | 0.2 | |||
| 12-Month interview | 0.75 | 0.2 | 0.67 | 0.31 | |||

Effects on Secondary Outcomes
| Variable | Study Arm | Analysis | |||||
|---|---|---|---|---|---|---|---|
| Personal Health Record | Usual Care | ||||||
| N | % | N | % | F | df | pa | |
| Services use (dichotomous) | |||||||
| Inpatient mental health hospitalization | 1.03 | 168 | 0.16 | ||||
| Baseline | 1 | 1.2 | 1 | 1.2 | |||
| 12-Month interview | 0 | 0 | 2 | 2.4 | |||
| Emergency department mental health visit | 3.68 | 168 | 0.68 | ||||
| Baseline | 23 | 27.1 | 14 | 16.5 | |||
| 12-Month interview | 10 | 11.8 | 7 | 8.3 | |||
| Inpatient medical hospitalization | 3.01 | 168 | 0.68 | ||||
| Baseline | 3 | 3.5 | 4 | 4.7 | |||
| 12-Month interview | 10 | 11.8 | 12 | 14.3 | |||
| Emergency department medical visit | 3.6 | 168 | 0.85 | ||||
| Baseline | 50 | 58.8 | 41 | 48.2 | |||
| 12-Month interview | 39 | 45.9 | 38 | 45.2 | |||
| Mean | SD | Mean | SD | F | df | pa | |
| Services use (continuous) | |||||||
| Number of outpatient mental health visits | 2.65 | 168 | 0.11 | ||||
| Baseline | 12.1 | 8.1 | 11.4 | 8.1 | |||
| 12-Month interview | 21.5 | 23.8 | 15.4 | 21.9 | |||
| Number of outpatient medical visits | 73.36 | 168 | <0.0001 | ||||
| Baseline | 12.2 | 9.8 | 13.1 | 14.3 | |||
| 12-Month interview | 27.1 | 11.5 | 13.7 | 12.2 | |||
| Patient activation measure (100 possible score) | 0.02 | 138 | 0.90 | ||||
| Baseline | 56.1 | 14.3 | 55.6 | 14.4 | |||
| 12-Month interview | 58.9 | 12.5 | 59.2 | 15.7 | |||
| Medical Outcomes Study 36-Item Short-Form Health Survey composite indices | |||||||
| Physical component measure | 0.85 | 139 | 0.36 | ||||
| Baseline | 33.4 | 11.2 | 32.7 | 9.2 | |||
| 12-Month interview | 33.4 | 9.7 | 33.6 | 8.9 | |||
| Mental component measure | 0.64 | 139 | 0.42 | ||||
| Baseline | 33.4 | 10.9 | 33.8 | 11.1 | |||
| 12-Month interview | 34.6 | 10.9 | 36.2 | 11.3 | |||
Mediation Analysis
| Quality of Care | Prediction of Service Change Between Baseline and Follow-Up Interview | |||
|---|---|---|---|---|
| Without Adjustment for the Number of Outpatient Medical Visits | With Adjustment for the Number of Outpatient Medical Visits | |||
| Coefficienta | pb | Coefficienta | pb | |
| Preventive services | ||||
| Physical examination | 0.118 | 0.0005 | 0.021 | 0.58 |
| Screening | 0.071 | 0.02 | 0.037 | 0.30 |
| Vaccination | 0.128 | <0.0001 | 0.038 | 0.24 |
| Education | 0.587 | <0.0001 | 0.441 | <0.0001 |
| Preventive care for women | 0.043 | 0.66 | –0.065 | 0.58 |
| Preventive care for men | 0.038 | 0.53 | 0.060 | 0.42 |
| Total percentage of eligible services receivedc | 0.228 | <0.0001 | 0.140 | <0.0001 |
| Cardiometabolic services | ||||
| Hypertension | 0.129 | 0.002 | 0.074 | 0.12 |
| Hyperlipidemia | –0.033 | 0.85 | –0.194 | 0.28 |
| Diabetes | 0.152 | 0.09 | 0.119 | 0.29 |
| Total percentage of eligible services receivedc | 0.127 | 0.003 | 0.082 | 0.09 |
Discussion
References
Information & Authors
Information
Published In
History
Authors
Funding Information
Metrics & Citations
Metrics
Citations
Export Citations
If you have the appropriate software installed, you can download article citation data to the citation manager of your choice. Simply select your manager software from the list below and click Download.
For more information or tips please see 'Downloading to a citation manager' in the Help menu.
View Options
View options
PDF/EPUB
View PDF/EPUBLogin options
Already a subscriber? Access your subscription through your login credentials or your institution for full access to this article.
Personal login Institutional Login Open Athens loginNot a subscriber?
PsychiatryOnline subscription options offer access to the DSM-5-TR® library, books, journals, CME, and patient resources. This all-in-one virtual library provides psychiatrists and mental health professionals with key resources for diagnosis, treatment, research, and professional development.
Need more help? PsychiatryOnline Customer Service may be reached by emailing [email protected] or by calling 800-368-5777 (in the U.S.) or 703-907-7322 (outside the U.S.).

