Abstract

Objective:

Recent evidence suggests that symptoms of social impairment in autism spectrum disorder (ASD) form a spectrum that extends into the general population. However, it is unclear whether the neuroanatomy of ASD also shows a similar continuum in the general population. Therefore, the goal of the present study was to investigate the relationship between cortical morphology and autistic traits along a continuum in a large population-based sample of young children.

Method:

The study included 717 children, aged 6–10 years, who are participants in the Generation R Study, a large population-based cohort. Autistic traits were measured using the Social Responsiveness Scale when the children were approximately 6 years old. High-resolution MRI was obtained, and morphological measures of the cortex, including cortical thickness and gyrification, were quantified brain-wide.

Results:

Children with more autistic traits showed widespread areas of decreased gyrification. After excluding children with the highest autistic traits and confirmed ASD, the association remained present in a large cluster involving the left hemisphere temporal and precuneus regions. Comparable, but nonsignificant, effects when comparing a small sample of confirmed ASD case subjects with age- and gender-matched control subjects were observed.

Conclusions:

Differences in cortical morphology related to autistic traits along a continuum in a large population-based sample of school-aged children were found. Part of these differences remained after excluding the most severely affected children. These findings lend support to an extension of the neurobiology of autistic traits to the general population.
Autism spectrum disorder (ASD) is a severe neurodevelopmental disorder in which social problems are a key symptom. Studies have suggested that these social problems are part of a spectrum of quantitative traits that extend into the general population (1). If true, one would expect that the neuroanatomical aspects of ASD also lie on a continuum in the general population. The majority of studies to date exploring the underlying neuroanatomy of ASD children involve case-control designs using clinically diagnosed patients with ASD. While these studies are very beneficial to help elucidate the underlying neurobiology of ASD, they do not answer the question whether autistic traits, including subclinical traits, share similar neuroanatomic features.
The optimum approach to evaluate whether the neuroanatomy of ASD fits a continuum in the general population involves three steps. The first step is to show a relationship between autistic symptoms along a continuum and neuroanatomy in the population. The second step is to show that those with high levels of autistic traits or ASD exhibit the same neuroanatomical findings as those in the whole population. Finally, the third step is to assess whether the relationship between autistic symptoms and neuroanatomy remains after removing those with the highest level of autistic symptoms. While there have been a number of studies that have assessed one or two of the above steps, no study to our knowledge to date has combined all three components in the same study.
There have been no studies that have evaluated brain morphology of autistic traits in population-based samples. However, there are numerous studies evaluating the neuroanatomy of children with clinical ASD compared with comparison subjects (2), although these studies have yielded mixed findings (e.g., both thicker and thinner cortex, as well as increased or decreased surface complexity). Despite this variability, replicated results include thicker cortex in younger children (between 1.5–8 years old), supporting the hypothesis of early brain overgrowth. In some studies, thicker cortex was found in the frontal (3, 4) and temporal regions (4, 5), although no differences were reported in other studies (6). Studies in older children (≥12 years old) have found thinner temporal, parietal, and occipital cortices in individuals with ASD (79). More recently, studies of gyrification in children and adolescents with ASD have also yielded contradictory results, reporting higher gyrification in the bilateral posterior (10), left inferior (11), and right parietal cortices (12) but also lower gyrification in the right frontal cortex (13) or no difference in gyrification (14).
Two studies of ASD included subanalyses evaluating autistic symptoms in the control group. One found a negative correlation of autistic traits and local gyrification in the right superior temporal sulcus (10), whereas increased gyrification in the right parietal lobe associated with more autistic symptoms was reported in the other study (12). Only one study has evaluated a continuous measure of autistic traits in typically developing youths and found thinner cortex in the right superior temporal cortex (15).
Thus, the goal of the present study was to perform all three steps (listed above as the optimum approach) in the same study and to assess whether differences in cortical morphology are related to the variation in autistic symptoms observed in the general pediatric population. Based on previous literature, we have centered our analyses around two features of cortical morphology that have shown differences in clinical samples of children with ASD, namely gyrification and cortical thickness. In line with studies in school-aged children, we hypothesized that a higher load of autistic traits would reveal a thicker cortex, particularly in the frontal and temporal lobes, and less gyrification in the frontal regions. Furthermore, we hypothesized that these findings would be present 1) along a continuum in the entire cohort, 2) in children with the highest level of autistic symptoms, and 3) after excluding children with the highest level of autistic symptoms.
Finally, considering the well-established sex differences in the prevalence of ASD (1) and the sexual dimorphism in neurodevelopment (16), and since many studies evaluate only boys (17), we examined a priori whether autistic traits in boys and girls would reveal similar neuroanatomical correlates.

Method

Participants

This study is embedded in the Generation R Study, a population-based cohort study investigating children’s development from fetal life onward (18). The participants included 1,070 children ages 6 to 10 years who were scanned between September 2009 and July 2013 as part of a substudy (19).
A total of 214 children were excluded based on missing information on autistic traits, and 105 children were excluded because of poor image quality (see the data supplement accompanying the online version of this article). For 15 children, a gyrification output could not be constructed. Furthermore, for each sibling or twin pair, one sibling was excluded (N=17). Two children were excluded based on major incidental findings. Thus, the final study sample consisted of 717 6- to 10-year-old children (see Figure S1 in the online data supplement).
Informed consent and assent were obtained from parents and children, respectively, after a complete description of the study was provided. All procedures were approved by the Erasmus Medical Center Medical Ethics Committee.

Social Responsiveness Scale

Around age 6 years (range: 4.89–8.90 years [see Table 1]), the Social Responsiveness Scale was administered to obtain a measure of autistic traits (20). The Social Responsiveness Scale provides a valid quantitative measure of subclinical and clinical autistic traits (21). We utilized the 18-item short-form of the scale, which shows correlations ranging from 0.93 to 0.99 with the full scale in three different large studies (see the online data supplement). The authors of the scale recommend cutoffs for screening in population-based settings (consistent with weighted scores of 1.078 for boys and 1.000 for girls) (20).
TABLE 1. Child and Maternal Demographic Characteristics
CharacteristicN%MeanSDRange
Child     
Gender (boy)71752   
Ethnicity717    
 Dutch 74.3   
 Other Western 6.7   
 Non-Western 19.0   
Social Responsiveness Scale weighted total score717 0.270.290–3
Age (years) at Social Responsiveness Scale assessment717 6.170.474.89–8.90
Age (years) at MRI scan717 7.971.006.12–10.70
Child Behavior Checklist score704    
 Attention problems subscale  1.982.050–9
Nonverbal IQ663 102.8614.4250–142
Handedness (right-handed)71690.2   
Maternal     
Education level698    
 High 58.6   
 Medium 30.2   
 Low 11.2   
Monthly household income680    
 High 80.7   
 Medium 14.3   
 Low 4.7   
Alcohol use during pregnancya652    
 Never 34.2   
 Until pregnancy was known 15.0   
 Continued 50.8   
Smoking during pregnancyb695    
 Never 77.4   
 Until pregnancy was known 6.0   
 Continued 16.5   
a
Drinking more than 1 drink per day varied between 0.3% and 2.9%, with the highest percentage in the first trimester.
b
Smoking 10 or more cigarettes per day fluctuated between 4.2% and 5.7%, with the highest percentage in the first trimester.
At approximately age 7 years, children who scored in the top 15th percentile on the Child Behavior Checklist (for ages 1½–5 years) total score and those who scored in the top 2nd percentile on the Pervasive Developmental Problems subscale underwent a screening procedure for ASD using the Social Communication Questionnaire, a 40-item parent-reported screening instrument to assess characteristic autistic behavior. Social Communication Questionnaire scores ≥15 are considered positive for screening (22). Children with scores above this threshold were invited to complete the Autism Diagnostic Observation Schedule (23), and their mothers were invited to complete the Autism Diagnostic Interview–Revised (24).

MRI

All children were first familiarized with the MRI scanning environment during a mock scanning session. Structural MRI scans were obtained on a 3-T scanner (Discovery MR750, General Electric Worldwide, Milwaukee). Cortical reconstruction and volumetric segmentation were performed with the FreeSurfer image analysis suite (version 5.1 [http://surfer.nmr.mgh.harvard.edu/]). Further details can be found in the online data supplement.

Statistical Analysis

To investigate the relationship between cortical morphology and autistic traits, we performed vertex-wise analyses using the FreeSurfer QDEC module (Query, Design, Estimate, Contrast [http://surfer.nmr.mgh.harvard.edu]), which allows users to perform intersubject/group averaging and inference using the general linear model on the morphometric data produced by the FreeSurfer processing stream. Analyses were corrected for multiple comparisons using the built-in Monte Carlo simulation at a threshold set at a p value <0.05, a cluster-wise correction that controls for the rate of false positive clusters.
In QDEC, we used a regression model with Social Responsiveness Scale score as the continuous predictor, gender as a discrete factor, and age as a nuisance variable within the different offset, different slope design matrix. Because of limitations in the number of covariates in QDEC, we exported local gyrification data for each participant for the identified clusters into SPSS version 21.0 (IBM, Armonk, N.Y.) to assess whether the associations withstood correction for confounding factors. Linear regression analyses were performed with Social Responsiveness Scale score as the independent variable. All analyses were corrected for gender and age, whereas other variables were included as covariates when they changed the effect estimate (B) by ≥5%. For further information on covariates, see the online data supplement. We explored gender interaction in QDEC and performed a stratified analysis for boys and girls to visualize gender-specific patterns and make our results directly comparable with gender-restricted samples. In addition, we performed sensitivity analyses, in which we excluded individuals with the highest load of autistic traits and those with a diagnosis of ASD.

Results

Sample Characteristics

Child and maternal characteristics are presented in Table 1. Boys had somewhat higher Social Responsiveness Scale scores (mean difference=0.06, t=2.96, df=715, p=0.003) and more attention problems (mean difference=0.70, t=4.63, df=702, p=0.000004). Characteristics of the excluded sample are presented in Table S1 in the online data supplement. Children who were excluded from the final sample were more likely to be of non-Dutch origin (χ2=44.88, df=2, p=1.79×10⁻¹⁰); N=1,070) and had somewhat higher Child Behavior Checklist attention problems scores (mean difference=−0.50, t=–3.23, df=975, p=0.001), slightly lower nonverbal IQ (mean difference=−0.07, t=3.61, df=980, p=0.0003), and (if excluded for reasons other than missing information on autistic traits) somewhat higher Social Responsiveness Scale scores (mean difference=−0.07, t=–2.09, df=856, p=0.04). Mothers of excluded children were more likely to have less education (χ2=14.32, df=2, p=0.001; N=971) and less income (χ2=44.59, df=2, p=2.08×10⁻¹⁰; N=937).

Gyrification

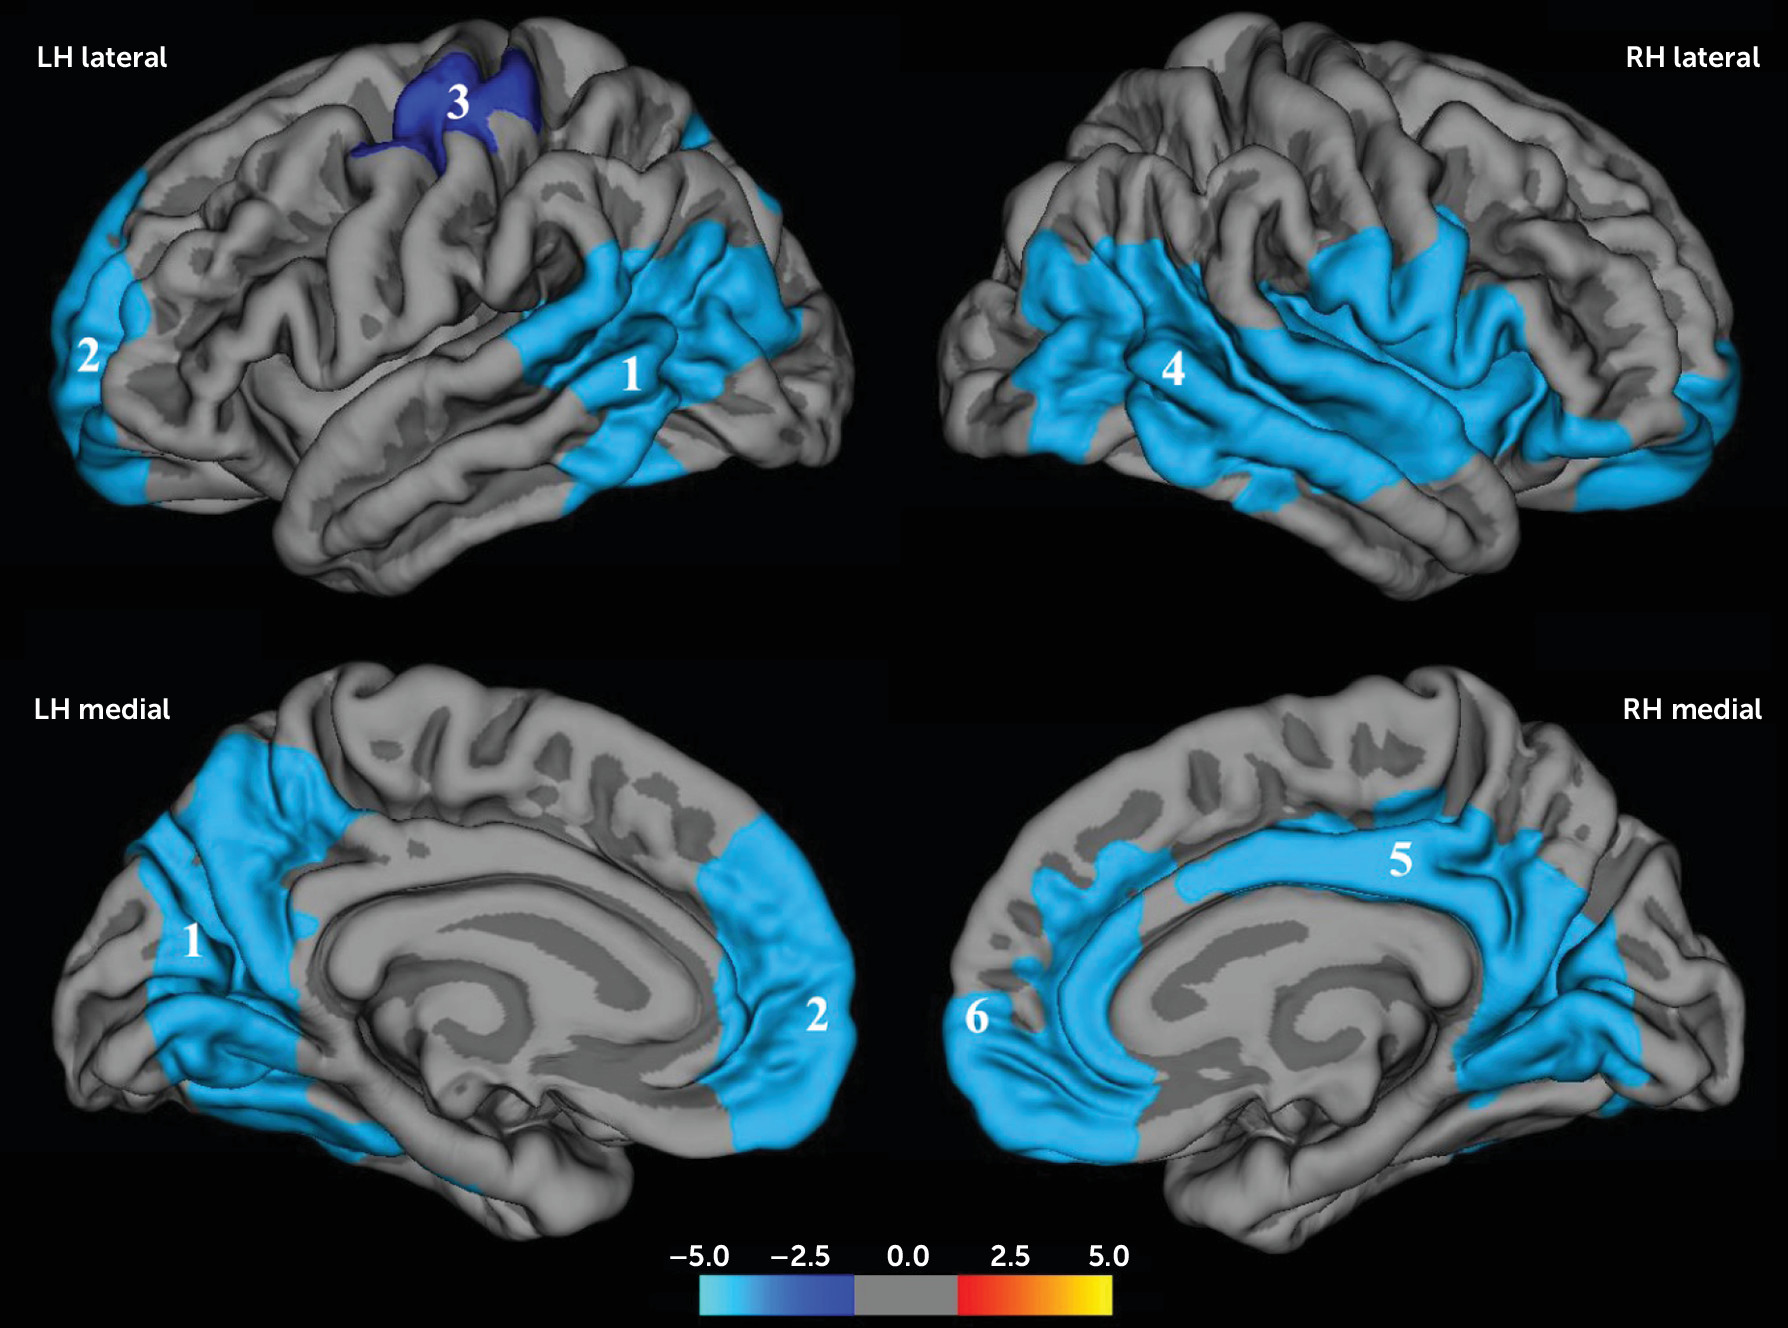
Six regions in the brain showed significant negative correlations between Social Responsiveness Scale scores and gyrification (Table 2, Figure 1), three in each hemisphere.
TABLE 2. Vertex-Wise Analyses of Gyrification and Autistic Traits (N=717)
Hemisphere and RegionCluster Size (mm2)Talairach Coordinates (x, y, z)Number of Vertices Within ClusterCluster-Wise p
Left    
Temporal/precuneus15,222.16–48.7, –43.6, 7.528,4520.0001
Frontal5,039.94–9.5, 62.7, –5.57,5690.0001
Pre-/postcentral2,100.33–30.6, –27.2, 48.64,9930.03
Right    
Temporal/frontal16,329.3761.7, –7.9, 0.334,3980.0001
Cingulate7,276.6914.1, –61.1, 1.114,9410.0001
Frontal/cingulate4,493.516.2, 46.3, –19.87,6700.0001
FIGURE 1. Gyrification and Autistic Traits in the Full Sample of 6- to 10-Year Old Childrena
a Analyses were adjusted for age and gender. Colors represent the –log10(p value). Blue clusters represent a negative correlation with autistic traits. Numbers refer to the entire cluster. Large clusters 1 and 2 are visible both in the lateral and the medial view of the left hemisphere. LH=left hemisphere; RH=right hemisphere.
In the left hemisphere, the first cluster (LH1) included the posterior temporal cortex, covering portions of the superior, middle, and inferior temporal cortices, as well as the inferior parietal cortex and supramarginal gyrus. This cluster extended medially to include the precuneus, cuneus, pericalcarine, lingual cortex, and fusiform gyrus (p=0.0001).
The second cluster (LH2) included the rostral middle frontal cortex and extended into the superior frontal, medial orbitofrontal, and rostral anterior cingulate cortices (p=0.0001). The third cluster (LH3) covered part of the central sulcus and pre- and postcentral gyri (p=0.03).
In the right hemisphere, cluster RH4 included a large part of the temporal lobe extending posteriorly into the inferior parietal cortex and supramarginal gyrus and anteriorly to the insula, supramarginal gyrus, and pre- and postcentral gyri (p=0.0001). Cluster RH5 included part of the posterior cingulate cortex and extended posteriorly to the precuneus and caudally to the lingual gyrus (p=0.0001). Cluster RH6 included the superior frontal cortex and the medial orbital frontal and anterior cingulate cortex.
The association remained in all but two clusters (LH3 and RH6), after adjusting for confounding factors (Table 3). The significant findings remained after additionally correcting for total brain volume (see Table S2 in the online data supplement). Plots of the age-residualized gyrification indices against quintiles of Social Responsiveness Scale scores are presented in Figure S2 in the data supplement. Adding a quadratic term did not significantly improve the model in any of the gyrification clusters.
TABLE 3. Regression Analyses of Gyrification and Autistic Traits (N=717)a
Hemisphere, Region, and ModelBSE Bpβ
Left    
Temporal/precuneus    
 Model 1–0.200.050.000–0.15
 Model 2 (adjusted)–0.150.110.006–0.11
Frontal    
 Model 1–0.140.040.000–0.14
 Model 2 (adjusted)–0.100.080.02–0.10
Pre-/postcentral    
 Model 1–0.200.080.009–0.10
 Model 2 (adjusted)–0.120.170.15–0.06
Right    
Temporal/frontal    
 Model 1–0.360.090.000–0.15
 Model 2 (adjusted)–0.280.190.005–0.12
Cingulate    
 Model 1–0.300.080.000–0.14
 Model 2 (adjusted)–0.220.180.01–0.11
Frontal/cingulate    
 Model 1–0.110.040.003–0.11
 Model 2 (adjusted)–0.070.080.09–0.07
a
Local gyrification indices were residualized for age at scanning. Model 1 adjusted for age when the Social Responsiveness Scale was completed and gender. Model 2 additionally adjusted for child ethnicity, maternal education, maternal alcohol use, maternal smoking, Child Behavior Checklist attention problems score, and nonverbal IQ.
There was no gender-by-gyrification interaction, and gender-stratified analysis revealed similar patterns of decreased gyrification (see Figure S3 in the data supplement). In children with a delay of less than 1 year between administration of the Social Responsiveness Scale and the MRI scan (N=179), the direction of the effect was similar.

Case-Control Analyses

To assess differences in gyrification between children with a diagnosis of ASD and control subjects, we performed independent t tests for the six boys in our sample with a confirmed diagnosis (measured using Autism Diagnostic Interview–Revised/Autism Diagnostic Observation Schedule criteria) compared with a group of age- and gender-matched control subjects. In general, children with ASD had lower gyrification indices, although this difference did not reach statistical significance (see Table S3 in the data supplement).

Analyses Without Children With the Highest Levels of Autistic Traits and ASD

Next, we explored whether these associations also held excluding children with high levels of autistic traits. We excluded the six boys who met criteria for ASD as measured by either the Autism Diagnostic Interview–Revised or the Autism Diagnostic Observation Schedule. Furthermore, boys with weighted Social Responsiveness Scale scores >1.078 and girls with scores >1.000 were excluded, in line with cutoffs recommended for screening in population-based settings (20). This resulted in a sample of 695 children. The results show effect sizes similar to those in the full sample (Table 4). After correcting for covariates, the relation between less gyrification and more autistic traits remained significant in the left hemisphere temporal/precuneus cluster (LH1), and a nearly significant relation remained in the left hemisphere frontal cluster (LH2).
TABLE 4. Autistic Traits and Gyrification in the Sample Without Children With the Highest Levels of Autistic Traits and Autism Spectrum Disorder (N=695)a
Hemisphere, Region, and ModelBSE Bpβ
Left    
Temporal/precuneus    
 Model 1–0.210.070.002–0.12
 Model 2 (adjusted)–0.150.070.04–0.08
Frontal    
 Model 1–0.150.050.002–0.12
 Model 2 (adjusted)–0.100.060.07–0.08
Pre-/postcentral    
 Model 1–0.170.100.09–0.06
 Model 2 (adjusted)–0.080.110.46–0.03
Right    
Temporal/frontal    
 Model 1–0.340.120.003–0.11
 Model 2 (adjusted)–0.220.130.09–0.07
Cingulate    
 Model 1–0.280.100.008–0.10
 Model 2 (adjusted)–0.170.120.15–0.06
Frontal/cingulate    
 Model 1–0.120.050.01–0.10
 Model 2 (adjusted)–0.070.060.22–0.05
a
Local gyrification indices were residualized for age at scanning. Model 1 adjusted for age when the Social Responsiveness Scale was completed and gender. Model 2 additionally adjusted for child ethnicity, maternal education, maternal alcohol use, maternal smoking, Child Behavior Checklist attention problems score, and nonverbal IQ.

Specificity Analyses

To explore the specificity of our results, we repeated the analyses with two other subscales of the Child Behavior Checklist as predictors (aggression and anxiety/depression). This was in addition to attention problems and nonverbal IQ, which were included as covariates in the main analysis. This yielded very small effect sizes that became insignificant after correcting for confounders.

Cortical Thickness

For the total sample, including both genders (N=717), we found no areas where thickness correlated with autistic traits and no gender interaction.
In boys only (N=373), thicker cortex in the pericalcarine area was related to more autistic traits (p=0.01) (see Figure S4 in the data supplement). In girls (N=344), no areas correlated with autistic traits.

Additional Measures

No relation was found between autistic traits and the global hemispheric means of cortical thickness, surface area, and gyrification (Table 5). In addition, there were no associations between autistic traits and volumes of subcortical nuclei. While cortical thickness and gyrification were the main outcomes of interest, several other measures were explored, including cortical volume, sulcal depth, and surface area. Larger volume in the bilateral pericalcarine region was related to more autistic traits (see Figure S5 in the data supplement). Similarly, decreased sulcal depth in the posterior part of the right superior temporal sulcus was associated with more autistic traits (see Figure S6 in the data supplement). For surface area, no differences were found.
TABLE 5. Autistic Traits and Global Brain Measuresa
Hemisphere, Morphological Measure, and ModelBSE Bpβ
Left    
Mean cortical thickness    
 Model 1–0.010.040.88–0.04
 Model 2 (adjusted)0.030.040.380.03
Mean pial surface area    
 Model 1–12399.113379.490.0000.02
 Model 2 (adjusted)–1839.101373.260.18–0.02
Mean gyrification    
 Model 1–0.130.040.0030.05
 Model 2 (adjusted)–0.050.040.19–0.04
Right    
Mean cortical thickness    
 Model 1–0.020.040.710.01
 Model 2 (adjusted)0.030.040.410.03
Mean pial surface area    
 Model 1–12861.233497.540.0000.01
 Model 2 (adjusted)–1911.551407.190.17–0.02
Mean gyrification    
 Model 1–0.160.050.0010.03
 Model 2 (adjusted)–0.070.040.09–0.05
a
Model 1 adjusted for gender and age when the Social Responsiveness Scale was completed. Model 2 additionally adjusted for total brain volume.

Discussion

There is emerging evidence that autistic traits fall on a continuum within the general population (1). If this is the case, then it is likely that the neuroanatomy of autistic traits also falls along a continuum within the general population. Thus, the primary goal of the present study was to evaluate the relationship between autistic traits and structural brain measures in a large population-based study of school-aged children. We studied whether neurobiological findings of autistic traits are present along a continuum in a population using a three-step approach, which involved 1) showing that a significant linear relationship exists between the autistic traits and the neurobiologic measurement and that a nonlinear relationship does not provide a significantly better fit, 2) performing a case-control evaluation of children with ASD to show that the findings are present in the case subjects with diagnosed ASD compared with control subjects, and 3) excluding individuals with ASD or the highest autistic symptoms to assess whether the linear relationship remains.
Evaluating brain morphology across a continuum of autistic traits, we found that school-aged children show a widespread decrease in cortical gyrification with increasing autistic traits. In some regions, this relationship appeared to be driven by those with more autistic symptoms, suggesting that for these regions a cutoff effect may be applicable. However, there was a strong linear relationship in regions involving the left hemisphere temporal/precuneus area that remained after excluding children with the highest levels of autistic traits and confirmed ASD. Finally, we found less gyrification with more autistic traits and a comparable, although nonsignificant, effect when comparing a small sample of confirmed ASD cases with age- and gender-matched control subjects. Taken together, these findings provide supportive evidence for the existence of a continuum, at least for some regions, in the neurobiology of autistic traits in children.
While other studies of gyrification in ASD have not had the goal of evaluating whether traits are continuous in the population, they have evaluated gyrification abnormalities in ASD. Studies have found both decreased (13) and increased (10, 12) gyrification in clinical cohorts with ASD. In a case-control study of ASD in 11 children aged 9–17 years (male subjects, N=8), compared with matched typically developing control subjects, Schaer et al. (13) found decreased gyrification in frontal brain regions. However, using the same technique, Wallace et al. (10) reported regions of increased gyrification in an all-male case-control study of ASD (ages 12–23 years old). The differences in the age and gender constellations of these studies could be responsible for the discrepancy in the findings. However, this is less intuitive because gyrification peaks early in childhood and, parallel with cortical pruning, decreases over time (25, 26). Thus, factors such as heterogeneity in the features of ASD, small sample size, or sample selection differences could be responsible for these differences. Interestingly though, when Wallace et al. performed a subanalysis that included only the typically developing subjects, they found negative correlations between autistic traits and gyrification in a region showing marked overlap with our finding in the right superior temporal lobe.
Gyrification is a poorly understood phenomenon that is thought to accommodate efficient neural processing in the brain (27). Decreased gyrification could point to disruptions in fetal development, since the majority of gyrification takes place in the third trimester, at a time when the brain undergoes prolific growth. However, the many primary sulci are formed before then, between 20 and 28 weeks of gestational age (28). Following Van Essen’s model (27), decreased gyrification could reflect decreased short-range connectivity of the neurons within specific regions. Indeed, Schaer et al. found decreased gyrification in ASD to be related to decreased connectivity in the same regions (13).
In our study, decreased gyrification was not associated with decreased surface area. This decoupling of various aspects of the cortex is puzzling but consistent with at least one other study of ASD (10) and could potentially be understood by the fact that both features derive from distinct stages in gestation and that different aspects of the cortex are regulated by different genetic mechanisms (29). A disruption within a particular developmental window may interfere with the development of one feature, while leaving another preserved.
While we found widespread regions of decreased gyrification, specific brain regions were more affected. Interestingly, the regions we found are functionally associated with capacities that are impaired in ASD. The frontal and posterior cingulate cortices both form components of the default mode network, a resting state functional brain network thought to be involved in self-reflection (30). Additionally, the anterior cingulate cortex, the temporal lobes, and the superior temporal sulcus have been related to “theory of mind” (31). The superior temporal sulcus, in which we found less gyrification and decreased sulcal depth, is recognized as a structure crucial to perception and processing of language and auditory stimuli, specifically social stimuli (both visual and auditory) (32). Previous research has shown decreased gray matter (9, 33) and white matter (34) volumes and abnormal activation of the superior temporal region in ASD (32).
We found larger volume and thicker cortex in the pericalcarine region, a region that is among the first to reach peak cortical thickness (35), around age 7 years, which falls within the age range in our study. Thicker occipital cortex has been found in school-aged children with ASD (8) and is in line with the early brain overgrowth hypothesis. Furthermore, magnetic resonance spectroscopy has revealed diminished levels of creatine (36). Thicker cortex in the pericalcarine area was exclusively found in boys, which potentially reflects gender specificity in brain development in children with autistic traits. Since female subjects are generally underrepresented in clinical ASD samples, because of the low prevalence in the female population, it is possible that some findings arising from previous studies of cortical thickness are in fact driven by the male subjects only. However, the regions where we found decreased gyrification were mostly overlapping across genders, in line with work that suggests similar brain differences in men and women with ASD (37).
Our study has a number of strengths. First, we imaged children from a large population-based cohort with autistic traits across a broad spectrum. This provides the unique opportunity to test whether the underlying neurobiology of autistic traits extends into the general population. In addition, considerable information is available on potential confounding factors. Although autistic traits frequently co-occur with attention problems and lower IQ (38), the brain correlates described here are specifically related to autistic traits independent of IQ and attention problems. Furthermore, our results were independent of symptoms of aggression, anxiety, and depression.
There are also several limitations to the study. First, the measurements of autistic traits and cortical morphology were not contemporaneous. However, autistic traits are relatively stable over time (39), and a sensitivity analysis only including children with a short delay between the two measurements yielded similar results. Second, because the MRI data were assessed cross-sectionally, we cannot study longitudinal trajectories of brain development associated with autistic traits. Third, while we corrected for multiple testing within each surface-based analysis, we did not perform additional correction for the different surface-based analyses. Fourth, the Autism Diagnostic Observation Schedule/Autism Diagnostic Interview–Revised assessments were not available for all participants. In our sample, six boys met criteria for ASD based on these instruments, but it is possible that we would have identified more cases of ASD had we been able to perform in-depth assessments of all participants. Since this is a small group, a cautious interpretation of these findings is warranted. Fifth, there is a potential for selection effects, since children who were excluded differed from the sample on socioeconomic factors and problem scores. Thus, it is possible that our results are not representative of the general population, although we are likely missing the children with more severe autistic symptoms. Finally, in interpreting data from a data-driven analysis, there is a risk of reverse inference. However, the regions we found have been consistently and specifically associated with ASD in the literature.
In conclusion, we found differences in cortical morphology to be related to autistic traits in a large population-based sample of school-aged children. Our findings lend support to an extension of the neurobiology of autistic traits to the general population.


Acknowledgments

The authors thank the children and parents, general practitioners, hospitals, midwives, and pharmacies in Rotterdam, the Netherlands. The authors also thank Marcus Schmidt for technical support.
Dr. van der Lugt has received research grant support from and served on the speaker’s bureau of GE Healthcare. Dr. Verhulst receives royalties from the Dutch version of the Achenbach System of Empirically Based Assessment. Dr. Tiemeier has received research grant support from the Dutch Medical Research Council (ZonMW), the European Union Research Support FP7 Program for Pediatric Conduct Disorder, and the Sophia Foundation for Scientific Research. All other authors report no financial relationships with commercial interests.

Supplementary Material

File (appi.ajp.2014.14040482.ds001.pdf)

References

1.
Constantino JN, Todd RD: Autistic traits in the general population: a twin study. Arch Gen Psychiatry 2003; 60:524–530
2.
Amaral DG, Schumann CM, Nordahl CW: Neuroanatomy of autism. Trends Neurosci 2008; 31:137–145
3.
Raznahan A, Lenroot R, Thurm A, et al: Mapping cortical anatomy in preschool aged children with autism using surface-based morphometry. Neuroimage Clin 2012; 2:111–119
4.
Schumann CM, Bloss CS, Barnes CC, et al: Longitudinal magnetic resonance imaging study of cortical development through early childhood in autism. J Neurosci 2010; 30:4419–4427
5.
Hardan AY, Muddasani S, Vemulapalli M, et al: An MRI study of increased cortical thickness in autism. Am J Psychiatry 2006; 163:1290–1292
6.
Hazlett HC, Poe MD, Gerig G, et al: Early brain overgrowth in autism associated with an increase in cortical surface area before age 2 years. Arch Gen Psychiatry 2011; 68:467–476
7.
Wallace GL, Dankner N, Kenworthy L, et al: Age-related temporal and parietal cortical thinning in autism spectrum disorders. Brain 2010; 133:3745–3754
8.
Zielinski BA, Prigge MBD, Nielsen JA, et al: Longitudinal changes in cortical thickness in autism and typical development. Brain 2014; 137:1799–1812
9.
Scheel C, Rotarska-Jagiela A, Schilbach L, et al: Imaging derived cortical thickness reduction in high-functioning autism: key regions and temporal slope. Neuroimage 2011; 58:391–400
10.
Wallace GL, Robustelli B, Dankner N, et al: Increased gyrification, but comparable surface area in adolescents with autism spectrum disorders. Brain 2013; 136:1956–1967
11.
Jou RJ, Minshew NJ, Keshavan MS, et al: Cortical gyrification in autistic and Asperger disorders: a preliminary magnetic resonance imaging study. J Child Neurol 2010; 25:1462–1467
12.
Kates WR, Ikuta I, Burnette CP: Gyrification patterns in monozygotic twin pairs varying in discordance for autism. Autism Res 2009; 2:267–278
13.
Schaer M, Ottet MC, Scariati E, et al: Decreased frontal gyrification correlates with altered connectivity in children with autism. Front Hum Neurosci 2013; 7:750
14.
Casanova MF, El-Baz A, Mott M, et al: Reduced gyral window and corpus callosum size in autism: possible macroscopic correlates of a minicolumnopathy. J Autism Dev Disord 2009; 39:751–764
15.
Wallace GL, Shaw P, Lee NR, et al: Distinct cortical correlates of autistic versus antisocial traits in a longitudinal sample of typically developing youth. J Neurosci 2012; 32:4856–4860
16.
Lenroot RK, Gogtay N, Greenstein DK, et al: Sexual dimorphism of brain developmental trajectories during childhood and adolescence. Neuroimage 2007; 36:1065–1073
17.
Lai MC, Lombardo MV, Suckling J, et al; MRC AIMS Consortium: Biological sex affects the neurobiology of autism. Brain 2013; 136:2799–2815
18.
Jaddoe VW, van Duijn CM, Franco OH, et al: The Generation R Study: design and cohort update 2012. Eur J Epidemiol 2012; 27:739–756
19.
White T, El Marroun H, Nijs I, et al: Pediatric population-based neuroimaging and the Generation R Study: the intersection of developmental neuroscience and epidemiology. Eur J Epidemiol 2013; 28:99–111
20.
Constantino JN: Social Responsiveness Scale (SRS), Manual. Los Angeles, Western Psychological services, 2002
21.
Constantino JN, Davis SA, Todd RD, et al: Validation of a brief quantitative measure of autistic traits: comparison of the Social Responsiveness Scale with the Autism Diagnostic Interview Revised. J Autism Dev Disord 2003; 33:427–433
22.
Berument SK, Rutter M, Lord C, et al: Autism Screening Questionnaire: diagnostic validity. Br J Psychiatry 1999; 175:444–451
23.
Lord C, Risi S, Lambrecht L, et al: The Autism Diagnostic Observation Schedule–Generic: a standard measure of social and communication deficits associated with the spectrum of autism. J Autism Dev Disord 2000; 30:205–223
24.
Lord C, Rutter M, Le Couteur A: Autism Diagnostic Interview Revised: a revised version of a diagnostic interview for caregivers of individuals with possible pervasive developmental disorders. J Autism Dev Disord 1994; 24:659–685
25.
White T, Su S, Schmidt M, et al: The development of gyrification in childhood and adolescence. Brain Cogn 2010; 72:36–45
26.
Shaw P, Malek M, Watson B, et al: Development of cortical surface area and gyrification in attention-deficit/hyperactivity disorder. Biol Psychiatry 2012; 72:191–197
27.
Van Essen DC: A tension-based theory of morphogenesis and compact wiring in the central nervous system. Nature 1997; 385:313–318
28.
Habas PA, Scott JA, Roosta A, et al: Early folding patterns and asymmetries of the normal human brain detected from in utero MRI. Cereb Cortex 2012; 22:13–25
29.
Panizzon MS, Fennema-Notestine C, Eyler LT, et al: Distinct genetic influences on cortical surface area and cortical thickness. Cereb Cortex 2009; 19:2728–2735
30.
Fair DA, Cohen AL, Dosenbach NUF, et al: The maturing architecture of the brain’s default network. Proc Natl Acad Sci USA 2008; 105:4028–4032
31.
Gallagher HL, Frith CD: Functional imaging of theory of mind. Trends Cogn Sci 2003; 7:77–83
32.
Zilbovicius M, Meresse I, Chabane N, et al: Autism, the superior temporal sulcus and social perception. Trends Neurosci 2006; 29:359–366
33.
Hadjikhani N, Joseph RM, Snyder J, et al: Anatomical differences in the mirror neuron system and social cognition network in autism. Cereb Cortex 2006; 16:1276–1282
34.
von dem Hagen EA, Nummenmaa L, Yu R, et al: Autism spectrum traits in the typical population predict structure and function in the posterior superior temporal sulcus. Cereb Cortex 2011; 21:493–500
35.
Shaw P, Kabani NJ, Lerch JP, et al: Neurodevelopmental trajectories of the human cerebral cortex. J Neurosci 2008; 28:3586–3594
36.
Levitt JG, O’Neill J, Blanton RE, et al: Proton magnetic resonance spectroscopic imaging of the brain in childhood autism. Biol Psychiatry 2003; 54:1355–1366
37.
Craig MC, Zaman SH, Daly EM, et al: Women with autistic-spectrum disorder: magnetic resonance imaging study of brain anatomy. Br J Psychiatry 2007; 191:224–228
38.
Grzadzinski R, Di Martino A, Brady E, et al: Examining autistic traits in children with ADHD: does the autism spectrum extend to ADHD? J Autism Dev Disord 2011; 41:1178–1191
39.
Constantino JN, Abbacchi AM, Lavesser PD, et al: Developmental course of autistic social impairment in males. Dev Psychopathol 2009; 21:127–138

Information & Authors

Information

Published In

Go to American Journal of Psychiatry
American Journal of Psychiatry
Pages: 479 - 486
PubMed: 25585034

History

Received: 14 April 2014
Revision received: 28 August 2014
Revision received: 6 October 2014
Accepted: 10 October 2014
Published online: 13 January 2015
Published in print: May 01, 2015

Authors

Details

Laura M.E. Blanken, M.D., M.Sc.
From the Department of Child and Adolescent Psychiatry/Psychology, Erasmus Medical Center-Sophia, Rotterdam, the Netherlands; The Generation R Study Group, Erasmus Medical Center-Sophia, Rotterdam, the Netherlands; the Centre for Child and Family Studies, Leiden University, Leiden, the Netherlands; the Department of Radiology, Erasmus Medical Center, Rotterdam, the Netherlands; and the Department of Epidemiology, Erasmus Medical Center, Rotterdam, the Netherlands.
Sabine E. Mous, M.Sc.
From the Department of Child and Adolescent Psychiatry/Psychology, Erasmus Medical Center-Sophia, Rotterdam, the Netherlands; The Generation R Study Group, Erasmus Medical Center-Sophia, Rotterdam, the Netherlands; the Centre for Child and Family Studies, Leiden University, Leiden, the Netherlands; the Department of Radiology, Erasmus Medical Center, Rotterdam, the Netherlands; and the Department of Epidemiology, Erasmus Medical Center, Rotterdam, the Netherlands.
Akhgar Ghassabian, M.D., Ph.D.
From the Department of Child and Adolescent Psychiatry/Psychology, Erasmus Medical Center-Sophia, Rotterdam, the Netherlands; The Generation R Study Group, Erasmus Medical Center-Sophia, Rotterdam, the Netherlands; the Centre for Child and Family Studies, Leiden University, Leiden, the Netherlands; the Department of Radiology, Erasmus Medical Center, Rotterdam, the Netherlands; and the Department of Epidemiology, Erasmus Medical Center, Rotterdam, the Netherlands.
Ryan L. Muetzel, M.Sc.
From the Department of Child and Adolescent Psychiatry/Psychology, Erasmus Medical Center-Sophia, Rotterdam, the Netherlands; The Generation R Study Group, Erasmus Medical Center-Sophia, Rotterdam, the Netherlands; the Centre for Child and Family Studies, Leiden University, Leiden, the Netherlands; the Department of Radiology, Erasmus Medical Center, Rotterdam, the Netherlands; and the Department of Epidemiology, Erasmus Medical Center, Rotterdam, the Netherlands.
Nikita K. Schoemaker, M.Sc.
From the Department of Child and Adolescent Psychiatry/Psychology, Erasmus Medical Center-Sophia, Rotterdam, the Netherlands; The Generation R Study Group, Erasmus Medical Center-Sophia, Rotterdam, the Netherlands; the Centre for Child and Family Studies, Leiden University, Leiden, the Netherlands; the Department of Radiology, Erasmus Medical Center, Rotterdam, the Netherlands; and the Department of Epidemiology, Erasmus Medical Center, Rotterdam, the Netherlands.
Hanan El Marroun, Ph.D.
From the Department of Child and Adolescent Psychiatry/Psychology, Erasmus Medical Center-Sophia, Rotterdam, the Netherlands; The Generation R Study Group, Erasmus Medical Center-Sophia, Rotterdam, the Netherlands; the Centre for Child and Family Studies, Leiden University, Leiden, the Netherlands; the Department of Radiology, Erasmus Medical Center, Rotterdam, the Netherlands; and the Department of Epidemiology, Erasmus Medical Center, Rotterdam, the Netherlands.
Aad van der Lugt, M.D., Ph.D.
From the Department of Child and Adolescent Psychiatry/Psychology, Erasmus Medical Center-Sophia, Rotterdam, the Netherlands; The Generation R Study Group, Erasmus Medical Center-Sophia, Rotterdam, the Netherlands; the Centre for Child and Family Studies, Leiden University, Leiden, the Netherlands; the Department of Radiology, Erasmus Medical Center, Rotterdam, the Netherlands; and the Department of Epidemiology, Erasmus Medical Center, Rotterdam, the Netherlands.
Vincent W.V. Jaddoe, M.D., Ph.D.
From the Department of Child and Adolescent Psychiatry/Psychology, Erasmus Medical Center-Sophia, Rotterdam, the Netherlands; The Generation R Study Group, Erasmus Medical Center-Sophia, Rotterdam, the Netherlands; the Centre for Child and Family Studies, Leiden University, Leiden, the Netherlands; the Department of Radiology, Erasmus Medical Center, Rotterdam, the Netherlands; and the Department of Epidemiology, Erasmus Medical Center, Rotterdam, the Netherlands.
Albert Hofman, M.D., Ph.D.
From the Department of Child and Adolescent Psychiatry/Psychology, Erasmus Medical Center-Sophia, Rotterdam, the Netherlands; The Generation R Study Group, Erasmus Medical Center-Sophia, Rotterdam, the Netherlands; the Centre for Child and Family Studies, Leiden University, Leiden, the Netherlands; the Department of Radiology, Erasmus Medical Center, Rotterdam, the Netherlands; and the Department of Epidemiology, Erasmus Medical Center, Rotterdam, the Netherlands.
Frank C. Verhulst, M.D., Ph.D.
From the Department of Child and Adolescent Psychiatry/Psychology, Erasmus Medical Center-Sophia, Rotterdam, the Netherlands; The Generation R Study Group, Erasmus Medical Center-Sophia, Rotterdam, the Netherlands; the Centre for Child and Family Studies, Leiden University, Leiden, the Netherlands; the Department of Radiology, Erasmus Medical Center, Rotterdam, the Netherlands; and the Department of Epidemiology, Erasmus Medical Center, Rotterdam, the Netherlands.
Henning Tiemeier, M.D., Ph.D.
From the Department of Child and Adolescent Psychiatry/Psychology, Erasmus Medical Center-Sophia, Rotterdam, the Netherlands; The Generation R Study Group, Erasmus Medical Center-Sophia, Rotterdam, the Netherlands; the Centre for Child and Family Studies, Leiden University, Leiden, the Netherlands; the Department of Radiology, Erasmus Medical Center, Rotterdam, the Netherlands; and the Department of Epidemiology, Erasmus Medical Center, Rotterdam, the Netherlands.
Tonya White, M.D., Ph.D.
From the Department of Child and Adolescent Psychiatry/Psychology, Erasmus Medical Center-Sophia, Rotterdam, the Netherlands; The Generation R Study Group, Erasmus Medical Center-Sophia, Rotterdam, the Netherlands; the Centre for Child and Family Studies, Leiden University, Leiden, the Netherlands; the Department of Radiology, Erasmus Medical Center, Rotterdam, the Netherlands; and the Department of Epidemiology, Erasmus Medical Center, Rotterdam, the Netherlands.

Notes

Address correspondence to Dr. White ([email protected]).

Funding Information

Netherlands Organisation for Health Research and Development10.13039/501100001826: 91211021
Supported by the FP7 grant Action FP-7 Health Innovation 2013 (number, 602768) (to Dr. Tiemeier) and by ZonMw TOP (project number, 91211021) (to Dr. White). The general design of the Generation R Study is supported by the Erasmus Medical Center-Rotterdam, the Erasmus University Rotterdam, the Netherlands Organization for Health Research and Development (ZonMw), the Netherlands Organization for Scientific Research, and the Ministry of Health, Welfare and Sport. The Generation R Study is conducted by the Erasmus Medical Center in close collaboration with the School of Law and the Faculty of Social Sciences of the Erasmus University Rotterdam, the Municipal Health Service Rotterdam area, the Rotterdam Homecare Foundation, and the Stichting Trombosedienst and Artsenlaboratorium Rijnmond.

Metrics & Citations

Metrics

Citations

Export Citations

If you have the appropriate software installed, you can download article citation data to the citation manager of your choice. Simply select your manager software from the list below and click Download.

For more information or tips please see 'Downloading to a citation manager' in the Help menu.

Format
Citation style
Style
Copy to clipboard

View Options

View options

PDF/EPUB

View PDF/EPUB

Get Access

Login options

Already a subscriber? Access your subscription through your login credentials or your institution for full access to this article.

Personal login Institutional Login Open Athens login
Purchase Options

Purchase this article to access the full text.

PPV Articles - American Journal of Psychiatry

PPV Articles - American Journal of Psychiatry

Not a subscriber?

Subscribe Now / Learn More

PsychiatryOnline subscription options offer access to the DSM-5-TR® library, books, journals, CME, and patient resources. This all-in-one virtual library provides psychiatrists and mental health professionals with key resources for diagnosis, treatment, research, and professional development.

Need more help? PsychiatryOnline Customer Service may be reached by emailing [email protected] or by calling 800-368-5777 (in the U.S.) or 703-907-7322 (outside the U.S.).

Media

Figures

Other

Tables

Share

Share

Share article link

Share