Abstract

Objective:

Clinical phenomenology remains the primary means for classifying psychoses despite considerable evidence that this method incompletely captures biologically meaningful differentiations. Rather than relying on clinical diagnoses as the gold standard, this project drew on neurobiological heterogeneity among psychosis cases to delineate subgroups independent of their phenomenological manifestations.

Method:

A large biomarker panel (neuropsychological, stop signal, saccadic control, and auditory stimulation paradigms) characterizing diverse aspects of brain function was collected on individuals with schizophrenia, schizoaffective disorder, and bipolar disorder with psychosis (N=711), their first-degree relatives (N=883), and demographically comparable healthy subjects (N=278). Biomarker variance across paradigms was exploited to create nine integrated variables that were used to capture neurobiological variance among the psychosis cases. Data on external validating measures (social functioning, structural magnetic resonance imaging, family biomarkers, and clinical information) were collected.

Results:

Multivariate taxometric analyses identified three neurobiologically distinct psychosis biotypes that did not respect clinical diagnosis boundaries. The same analysis procedure using clinical DSM diagnoses as the criteria was best described by a single severity continuum (schizophrenia worse than schizoaffective disorder worse than bipolar psychosis); this was not the case for biotypes. The external validating measures supported the distinctiveness of these subgroups compared with clinical diagnosis, highlighting a possible advantage of neurobiological versus clinical categorization schemes for differentiating psychotic disorders.

Conclusions:

These data illustrate how multiple pathways may lead to clinically similar psychosis manifestations, and they provide explanations for the marked heterogeneity observed across laboratories on the same biomarker variables when DSM diagnoses are used as the gold standard.
Disease classifications in medicine are increasingly transformed by enhanced knowledge of molecular foundations, especially where clinical manifestations are diverse and illness trajectories are multifarious. There are multiple examples where biological differentiation has resulted in classification of diseases with remarkably similar clinical presentations and pathology into distinct disorders (1, 2). Statistical modeling of clinical and biomarker data sets can facilitate redefinition and reconceptualization of complex human diseases (3, 4). More basic knowledge of neurobiological architecture can enhance treatment research and outcomes (5, 6) and support development of treatments tailored for patients’ unique etiopathologies (7).
Biological reformulations of disease have revolutionized many medical disciplines, but classification and treatment of brain diseases subsumed by psychiatry rely on clinical phenomenology, despite the call for alternatives (8, 9). Even bipolar disorder with psychosis and schizophrenia, the two major and ostensibly distinct psychosis categories, do not “breed true” (10, 11). There is overlap in susceptibility genes and phenotypes across bipolar disorder with psychosis and schizophrenia (1214) and considerable similarity between different psychotic disorders on symptoms, illness course, cognition, psychophysiology, and neurobiology (1526). Drug treatments for these conditions overlap extensively (27). “Psychosis” could be a final endpoint for multiple psychotogenic etiologies, as “congestive heart failure” is a common endpoint of cardiac, renal, and pulmonary disorders, all of which are best ameliorated with distinct treatments (for example, see reference 28). A useful complementary approach may include the development of a more neuroscience-based classification of the psychoses (29).
To evaluate this possibility, we recruited individuals manifesting psychosis, a neurobiologically heterogeneous target population with unknown and certainly diverse etiologies. We collected a large panel of biomarkers of known relevance to psychosis and functional brain activity. Multivariate analyses were used to partition neurobiologically distinct subgroups of psychosis cases independent of clinical phenomenology. We refined a subset of the biomarker panel that differentiated people with psychosis from healthy persons, and we used those biomarkers to differentiate among (create distinct subgroups of) psychosis cases. The neurobiological uniqueness of the newly created psychosis categories was supported with meaningful external validators (for an illustration of the approach, see Figure S1 in the data supplement accompanying the online version of this article). Given the apparent distinctiveness of these subgroups, we call them psychosis “biotypes” (biologically distinctive phenotypes). Much like for other branches of medicine, the biotypes did not respect clinical phenomenological diagnoses (see references 3033). Identifying additional unique characteristics of these psychosis biotypes may facilitate novel clinical, basic, and molecular research (34).

Method

Subjects

Subject recruitment, interviews, and laboratory data collection were completed at the Bipolar-Schizophrenia Network on Intermediate Phenotypes (B-SNIP) consortium sites; full details have been previously published (26); see also the Methods file in the online data supplement). Probands with psychosis (N=711), their first-degree relatives (N=883), and demographically comparable healthy subjects (N=278) were fully clinically characterized (see Table 1 and Table S1 in the online data supplement). Probands were assessed with the Structured Clinical Interview for DSM-IV. Relatives of the probands recruited for the study were also evaluated with the Structured Interview for DSM-IV Personality Disorders (35) to evaluate psychosis spectrum personality traits. The healthy persons were without lifetime psychotic disorders and had no first-degree relatives with a history of psychotic or bipolar disorder according to the Family History Research Diagnostic Criteria (36). The majority of probands and a minor subset of relatives were taking psychotropic medications; details are provided in Table S2 in the online data supplement. There were minimal associations between clinical and/or medication variables and biomarker outcomes (1518, 2022, 25). The institutional review board at every participating institution approved this project; all subjects provided informed consent prior to inclusion after they obtained a complete description of the study.
TABLE 1. Clinical Characteristics of Probands With Psychosis and Their First-Degree Relatives, by Proband Biotype
Clinical CharacteristicBiotype 1 (B1)Biotype 2 (B2)Biotype 3 (B3)Analysis
 % % % χ2dfp
Proband’s DSM psychosis diagnosis         
 Schizophrenia58.6 46.0 31.7 34.542<0.001a
 Schizoaffective disorder21.2 26.8 24.5 1.8020.41
 Bipolar disorder20.2 27.2 43.9 33.022<0.001b
 MeanSDMeanSDMeanSDFdfp
Schizo-Bipolar Scale score6.02.85.33.24.23.219.162, 687<0.001c
Proband’s clinical symptom scores         
 PANSS positive subscale16.35.816.36.015.05.14.642, 6920.01d
 PANSS negative subscale16.25.915.55.313.75.213.842, 692<0.001e
 Montgomery-Åsberg Depression Rating Scale9.79.511.28.910.39.51.412, 6870.24
 Young Mania Rating Scale5.56.16.66.75.76.01.992, 6880.14
Birchwood Social Functioning Scale score (healthy group: mean=154.8, SD=17.8)         
 Probands116.823.4123.024.1131.325.0142.413, 885<0.001f
 Relatives144.222.9145.222.4149.321.413.883, 979<0.001g
 % % % χ2dfp
Relative’s diagnosis         
 Axis I psychosis14.0 12.3 9.2 3.5320.17
 Axis II: clusters A and B personality disorders12.3 12.3 7.8 4.5420.10
 Psychosis-related diagnosis (axis I psychosis + axis II clusters A and B)h25.9 23.8 16.7 8.3920.02i
a
Yates-corrected pairwise chi-square test: B1>B2 (χ2=6.37, df=1, p=0.02); B2>B3 (χ2=10.44, df=1, p=0.001); B1>B3 (χ2=33.16, df=1, p<0.001).
b
Yates-corrected pairwise chi-square test: B3>B2 (χ2=14.57, df=1, p<0.001); B3>B1 (χ2=27.84, df=1, p<0.001).
c
Tukey honestly significant difference test (HSD): B1>B3 (p<0.001); B2>B3 (p<0.001).
d
Tukey HSD: B3<B1 (p=0.03); B3<B2 (p=0.03).
e
Tukey HSD: B3<B1 (p<0.001); B2<B1 (p<0.001).
f
Tukey HSD: B1<B2 (p=0.04); B1<B3 (p<0.001); B1<healthy (p<0.001); B2<B3 (p<0.001); B2<healthy (p<0.001); B3<healthy (p<0.001).
g
Tukey HSD: healthy>B1 (p<0.001); healthy>B2 (p<0.001); healthy>B3 (p=0.007); B1<B3 (p=0.06).
h
Percents for axis I psychosis and for axis II clusters A and B do not sum to exactly the percent for psychosis-related diagnoses because some relatives had both axis I psychosis and axis II clusters A and B diagnoses. In such cases they were counted once.
i
Yates-corrected pairwise chi-square test: B1>B3 (χ2=6.69, df=1, p=0.001); B2>B3 (χ2=4.54, df=1, p=0.03).

Procedures

Recording and testing conditions were similar and stimulus presentation and recording equipment were identical across sites. Experimenters across sites also were trained and continually monitored to ensure comparable laboratory data collection procedures. As a result, there were no site effects that influenced group comparisons on any laboratory biomarker measure (1518, 2022, 25).

Laboratory Tasks

Biotypes were derived by using laboratory tasks that assess brain function at the neurocognitive/perceptual level (traditional “endophenotypes” [37] that can be assessed across diverse clinical and laboratory settings). Using variables at this level of analysis also afforded the opportunity to test the validity of the outcomes against more clinical (social functioning) and more basic (structural magnetic resonance imaging) measures. This biomarker panel was constructed, given known and purported neurophysiological deviations in psychosis (38), by using all scored phenotypic data from the B-SNIP assessments, after being statistically reduced for redundancy (see below), except for social function, brain structure, and first-degree relative phenotype data, which were reserved for external validation. Data were scored according to previously published criteria (see the Methods file in the online data supplement).

Brief Assessment of Cognition in Schizophrenia (BACS).

This battery assesses multiple cognitive functions (39, 40), although a global neuropsychological functioning composite score integrating over multiple domains provided the best measure of psychosis-related cognitive deviation (18). Age- and sex-stratified normative data (18) were used to compute these composite scores for each participant (see also the Methods file in the online data supplement).

Pro- and anti-saccade tasks.

Prosaccades assess speed of visual orienting (41) (patients with psychosis show variable slowed or speeded response times [41, 42]). Antisaccades assess inhibitory control under perceptual conflict because the visual stimulus and required response location are incompatible (patients with psychosis have increased error rates [22, 41, 43]). The participants performed pro- and antisaccade tasks under identical conditions, which have been previously described (22; see also the online supplementary methods).

Stop signal task.

Stop signal performance measures the efficiency and adequacy of cognitive control when response activation and generation regarding a single stimulus location are placed in conflict (there are delayed response times and increased errors in psychosis [16]). Details of the task have been presented previously (16; see also the online supplementary methods).

Auditory paired stimuli and oddball evoked brain responses.

Evoked brain responses to repetitive auditory stimuli (paired-stimuli task) (17) and predetermined auditory targets randomly interspersed with nontarget (or standard) auditory events (oddball task) (15) are deviant in patients with psychosis (15, 17). These paradigms assess the neural dynamics of preparation for and recovery from auditory sensory activations, neural responses to stimulus salience, and neural differentiation of relevant from irrelevant auditory stimulus events. Stimulus presentation characteristics for electroencephalography (EEG) data have been presented previously (15, 17; see also the supplementary methods in the online data supplement).

Magnetic resonance imaging acquisition and voxel-based morphometry.

Structural three-dimensional magnetic resonance images were acquired on 3-T scanners of different manufacturers, including GE Signa, Siemens Trio, Philips Achieva, and Siemens Allegra, by using high-resolution T1-weighted sequences from the Alzheimer's Disease Neuroimaging Initiative protocol, standardized across sites (44). The images were preprocessed by experienced analysts blind to participant identity, and they were prepared for voxel-based morphometry analysis in MATLAB7/SPM8/VBM8/DARTEL following standard procedures (44; see also the online supplementary methods).

Data Analyses for Biotypes

Data integration within paradigms.

Initial analyses identified measures from the full B-SNIP battery differentiating psychosis probands from healthy persons. For five of the six laboratory paradigms, there were multiple such variables (the BACS had only the composite score): five saccade variables (collapsed across pro- and antisaccade tasks), two stop signal variables, and 31 EEG variables (collapsed across paired-stimuli and oddball tasks; see Table S3 in the online data supplement). To provide the most efficient information for biotype construction, data reduction within each paradigm set (saccades, stop signal task, EEG) was captured by using principal component analysis (15, 17). This step was undertaken because we assumed that individual variables were not assessing unique aspects of brain functioning (e.g., antisaccade response latency and prosaccade latency both index speed of visual orienting; the N100 response during the paired-stimuli task assesses a neural response that is highly similar to the N100 response during the oddball task). Principal component analysis reduces data dimensionality (maximizing signal to noise) by replacing a group of variables with a linear combination of those variables, thus reducing information redundancy and retaining maximal meaningful explanatory variance across all measures. As in regression analysis, where too many (redundant) predictor variables may result in model over-fitting and problems with generalization and replication, data dimension reduction (through principal component analysis, for instance) has been demonstrated to improve the classification accuracy of taxometric methods such as k-means clustering (45).
The data integration step yielded two saccade, one stop signal, and five EEG components (see Table S3 in the data supplement for principal component analysis pattern matrices by paradigm set). These components (biomarker composite scores) provide more efficient measurements of important brain response constructs than do any one of the individual variables that supported their construction. For each of these biomarker composites, Bartlett factor scores were generated for each subject, and these scores, along with the BACS score, were used in biotype analyses. Tables 2A and 2B provide the effect size separation between individuals in each psychosis class designation (DSM diagnoses and biotypes) and healthy persons (standard deviation for the healthy subjects in the denominator) for each of the biomarker composite variables.
TABLE 2. Biomarker Composite Characteristics for Probands With Psychosis and Their First-Degree Relatives, by Proband DSM Diagnosis and Biotype
 Group Separation From Healthy Subjects (N=278), in Effect Size Units
Group and Composite VariableaProband DSM DiagnosisbProband Biotype Class
A. ProbandsBDP (N=226)SzAff (N=173)SZ (N=312)Biotype 1 (N=198)Biotype 2 (N=235)Biotype 3 (N=278)
Cognitive control      
 BACS–1.01–1.51–1.83–2.58–1.94–0.35
 Stop signal task–0.41–0.61–0.55–0.99–0.78–0.05
 Antisaccade errors1.361.662.453.321.901.19
Sensorimotor reactivity      
 EEG intrinsic activity0.070.09–0.01–0.550.68–0.05
 N100 ERP–0.47–0.62–0.67–1.36–0.11–0.44
 Paired S2 ERP–0.30–0.010.220.46–0.510.04
 P300 ERP–0.35–0.49–0.73–1.27–0.15–0.34
 P200 ERP–0.36–0.21–0.24–0.490.17–0.47
 Saccade latency–0.17–0.06–0.290.19–0.24–0.38
B. RelativesBDP (N=289)SzAff (N=231)SZ (N=363)Biotype 1 (N=227)Biotype 2 (N=286)Biotype 3 (N=370)
Cognitive control      
 BACS–0.25–0.42–0.46–0.86–0.45–0.03
 Stop signal task–0.02–0.29–0.18–0.38–0.11–0.05
 Antisaccade errors0.820.931.091.720.680.70
Sensorimotor reactivity      
 EEG intrinsic activity–0.070.270.030.080.32–0.06
 N100 ERP–0.11–0.31–0.20–0.34–0.05–0.25
 Paired S2 ERP–0.08–0.020.130.19–0.110.02
 P300 ERP–0.13–0.30–0.32–0.48–0.13–0.22
 P200 ERP–0.39–0.12–0.15–0.33–0.03–0.30
 Saccade latency–0.17–0.17–0.10–0.04–0.14–0.17
 Variable Category    
C. FamilialitycBiomarker CompositesDiscriminant Functions    
Cognitive control 0.51*    
 BACS0.40**     
 Stop signal task0.21†     
 Antisaccade errors0.32***     
Sensorimotor reactivity 0.59*    
 EEG intrinsic activity0.47***     
 N100 ERP0.62**     
 Paired S2 ERP0.17†     
 P300 ERP0.52**     
a
BACS, Brief Assessment of Cognition in Schizophrenia. ERP, event-related potential.
b
BDP, bipolar disorder with psychosis. SzAff, schizoaffective disorder. SZ, schizophrenia.
c
All values are statistically significant.
*
p<1.0e–20. **p<1.0e–10. ***p<1.0e–5. †p<0.01.

Cluster determination.

The optimal number of subgroups to extract from unsupervised clustering with the biomarker composite variables was determined by using 1) the gap statistic, which provides a formalization of the point at which within-cluster dispersion (pooled within-cluster sum of squares from the centroid) becomes less pronounced as a function of the number of clusters assumed (46), and 2) the preclustering step of the TwoStep cluster analysis algorithm (SPSS Statistics for Windows, version 22.0; IBM, Armonk, N.Y.).
The gap statistic results are based on the difference between the pooled within-cluster sums of squares around cluster centroids as a function of the number of clusters requested and that same function under a null distribution (46). In our case, the null distribution was calculated by randomly shuffling variables across observations (sampling with replacement) such that values for BACS, for instance, were randomly paired with values on all other measures used for biotype construction. We generated 10,000 new observations in this fashion. These plots for the actual data and null distributions (mean of the middle 99% of cases) are shown in Figure S2A in the data supplement, along with the gap function in supplementary Figure S2B. The largest gap is at four clusters, but that value does not significantly differ from the three-cluster case, so three subgroups most parsimoniously captured the data structure.
The preclustering step of the TwoStep cluster algorithm uses a hierarchical cluster approach, with determination of number of clusters based on distance and rate of change criteria (the procedure is completely described in a white paper technical report from SPSS: “The SPSS TwoStep Cluster Component” (http://www.spss.ch/upload/1122644952_The%20SPSS%20TwoStep%20Cluster%20Component.pdf). The precluster step output for our data is shown in Table S4 in the online data supplement. As with the gap distribution above, this independent method indicates that three subgroups most parsimoniously capture the underlying data structure.

Biotype construction.

Biotypes were formed and the biomarker composite variables were integrated for visualization and analytical purposes by using the following three steps. First, k-means clustering was used for class formation (47). This method finds partitions such that clusters are defined by their centroids, and the sum of the squared Euclidian distance (our distance metric) of all cases from assigned cluster centroids is minimized. Only psychosis probands were used at this stage, given that the biomarkers differentiated psychotic and healthy persons, so the problem was meaningfully parsing variance within the psychosis probands. On the basis of the results of the gap statistic and the TwoStep cluster algorithm, three subgroups (biotypes) were used to parsimoniously capture cognitive-perceptual classification variance among the participants with psychosis. In the second step of biomarker construction, all biomarker composite variables were standardized to mean 0 and unit variance. No outliers were identified that required special handling before cluster optimization proceeded. The k-means algorithm achieved cluster stability within 14 iterations, and it resulted in numbers of observations in the clusters (biotypes), as described in Tables 1 and 2. In the third step, the outcome captured biotype membership in the nine-variable space of the biomarker composites. To provide an efficient and more easily visualized means for describing group differences, we used biotype membership as the classification variable and performed multivariate discriminant analysis to summarize the relationship among the biomarker composite variables. This discriminant analysis summarized variance that maximally separated groups (in this instance, the three biotypes). This step was undertaken to ease visualization of the subgroup differentiations and to allow a simple metric for comparing proband and relative groups on the biomarker composite variables that supported biotype construction (see Tables 2A and 2B for group comparisons on the nine biomarker composite variables individually). Two significant functions summarized biotype separations, which we named “cognitive control” and “sensorimotor reactivity” given their constituents (48) (Table 2; online Table S5). These discriminant functions were also used to test classification accuracy with a jackknife procedure (49) and to generate variable scores for healthy persons and relatives on cognitive control and sensorimotor reactivity.

Results

Distinct Psychosis Biotypes Identified by Multivariate Biomarkers
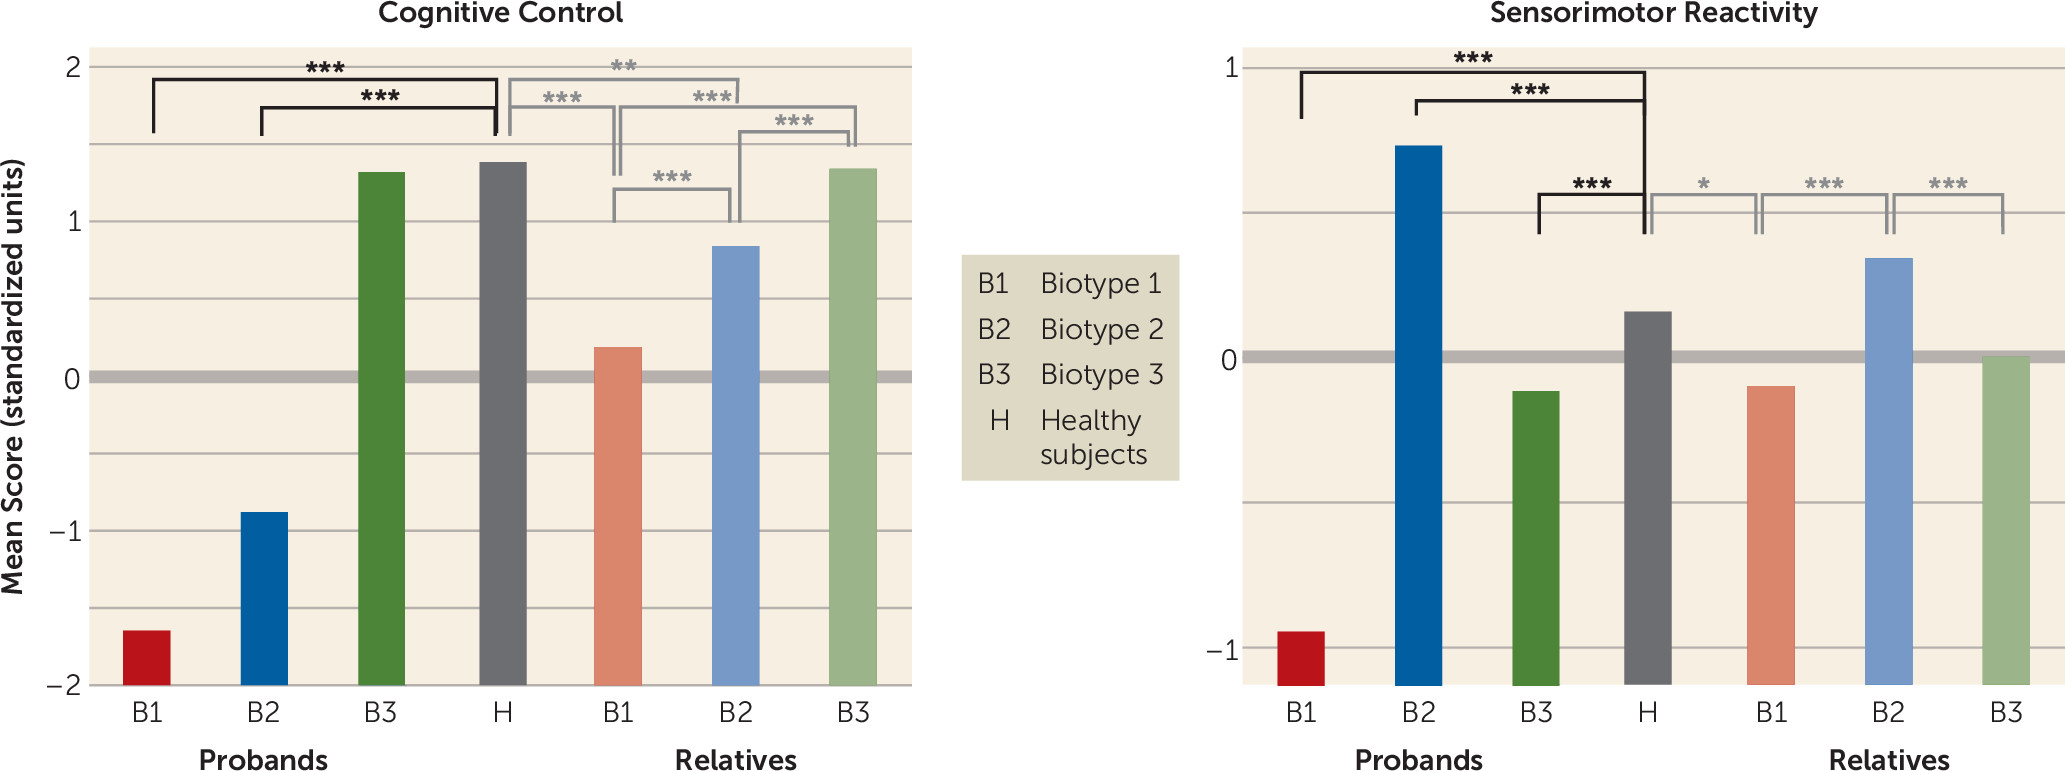
Table 2A provides biomarker composite effect size differentiations of probands and healthy subjects by DSM diagnosis and biotype. In general, the DSM diagnostic groups showed differences in severity on the biomarker composites (with schizophrenia probands in general differing from healthy subjects more than did the schizoaffective disorder probands, who differed more than those with bipolar disorder with psychosis), while the three biotypes had distinctive patterns of abnormality across biomarkers that were neither entirely nor efficiently captured by a severity continuum (see below). Discriminant function coefficients were used to generate a score for each individual on cognitive control and sensorimotor reactivity. Means (standard score units) by group on cognitive control and sensorimotor reactivity are provided in Figure 1. Healthy subjects are included in these comparisons, although they were not used to generate the discriminant functions. These discriminant functions correctly classified 91% of the psychosis probands by biotype. A similar analysis using DSM diagnostic groups yielded only one significant discriminant function that described a severity continuum with modest separations between schizophrenia and bipolar disorder with psychosis at the extreme ends. This function correctly classified only 45% of the psychosis probands into their DSM diagnostic groups (Table S6 and Figure S3 in the online data supplement).
FIGURE 1. Group Separations on Biomarker Composite Variables for Probands With Psychosis and Their First-Degree Relatives, by Proband Biotypea
a Statistical comparisons of biotype proband groups were not computed because they were statistically constructed to be maximally separate on the variables included in the discriminant function analysis. Comparisons shown here were made by means of t tests.
*p<0.01. **p<0.001. ***p<0.0001.
Because the biotypes were constructed by using the probands, we did not test statistically for differences between proband groups (those groups were constructed to be maximally differentiated). As can be seen in Figure 1, however, healthy persons (who were not involved in generating the biotypes) differed significantly on cognitive control from biotype 1 (t=27.7, df=475, p<0.001) and biotype 2 (t=22.3, df=512, p<0.001) but not from biotype 3. Healthy persons differed significantly from all three biotypes on sensorimotor reactivity (biotype 1: t=11.4, df=475, p<0.001; biotype 2: t=–6.43, df=512, p<0.001; biotype 3: t=3.87, df=555, p<0.001) (see Figure 1). Biotype 1 had the highest proportion of inhibition errors, the lowest amplitude brain responses to auditory stimuli but comparatively accentuated neural responding to repeated auditory stimuli, sluggish responding to sensory inputs, and the poorest target (critical stimulus) detection. Biotype 2 was moderately impaired on cognitive control (compromised compared with healthy persons but intermediate between biotypes 1 and 3). However, biotype 2 had accentuated sensorimotor reactivity, including normal to higher amplitude neural responding to auditory inputs, the highest intrinsic (not specifically stimulus-related) neural activities, but intact neurophysiological evidence of target detection. Biotype 3 probands did not differ from healthy persons on cognitive control (despite having a psychosis diagnosis) but were modestly deviant on sensorimotor reactivity. They had modestly more inhibition errors than was normal, modestly lower neural responding to auditory inputs, modestly impaired target detection, and the fastest visual orienting times of the three biotypes (significantly faster than healthy persons; see Table 2A). Compared with DSM diagnoses, the biotypes reduced variance on the biomarker composites by 38% on average and around the subgroup centroids by 29% on average (see Figure S3 in the data supplement). These biomarker outcomes by biotype suggest more distinct functional brain correlates of psychosis manifestation than were captured by clinical phenomenological diagnostic definitions (see below).

Clinical Characteristics of Biotypes and Relation to DSM Diagnoses
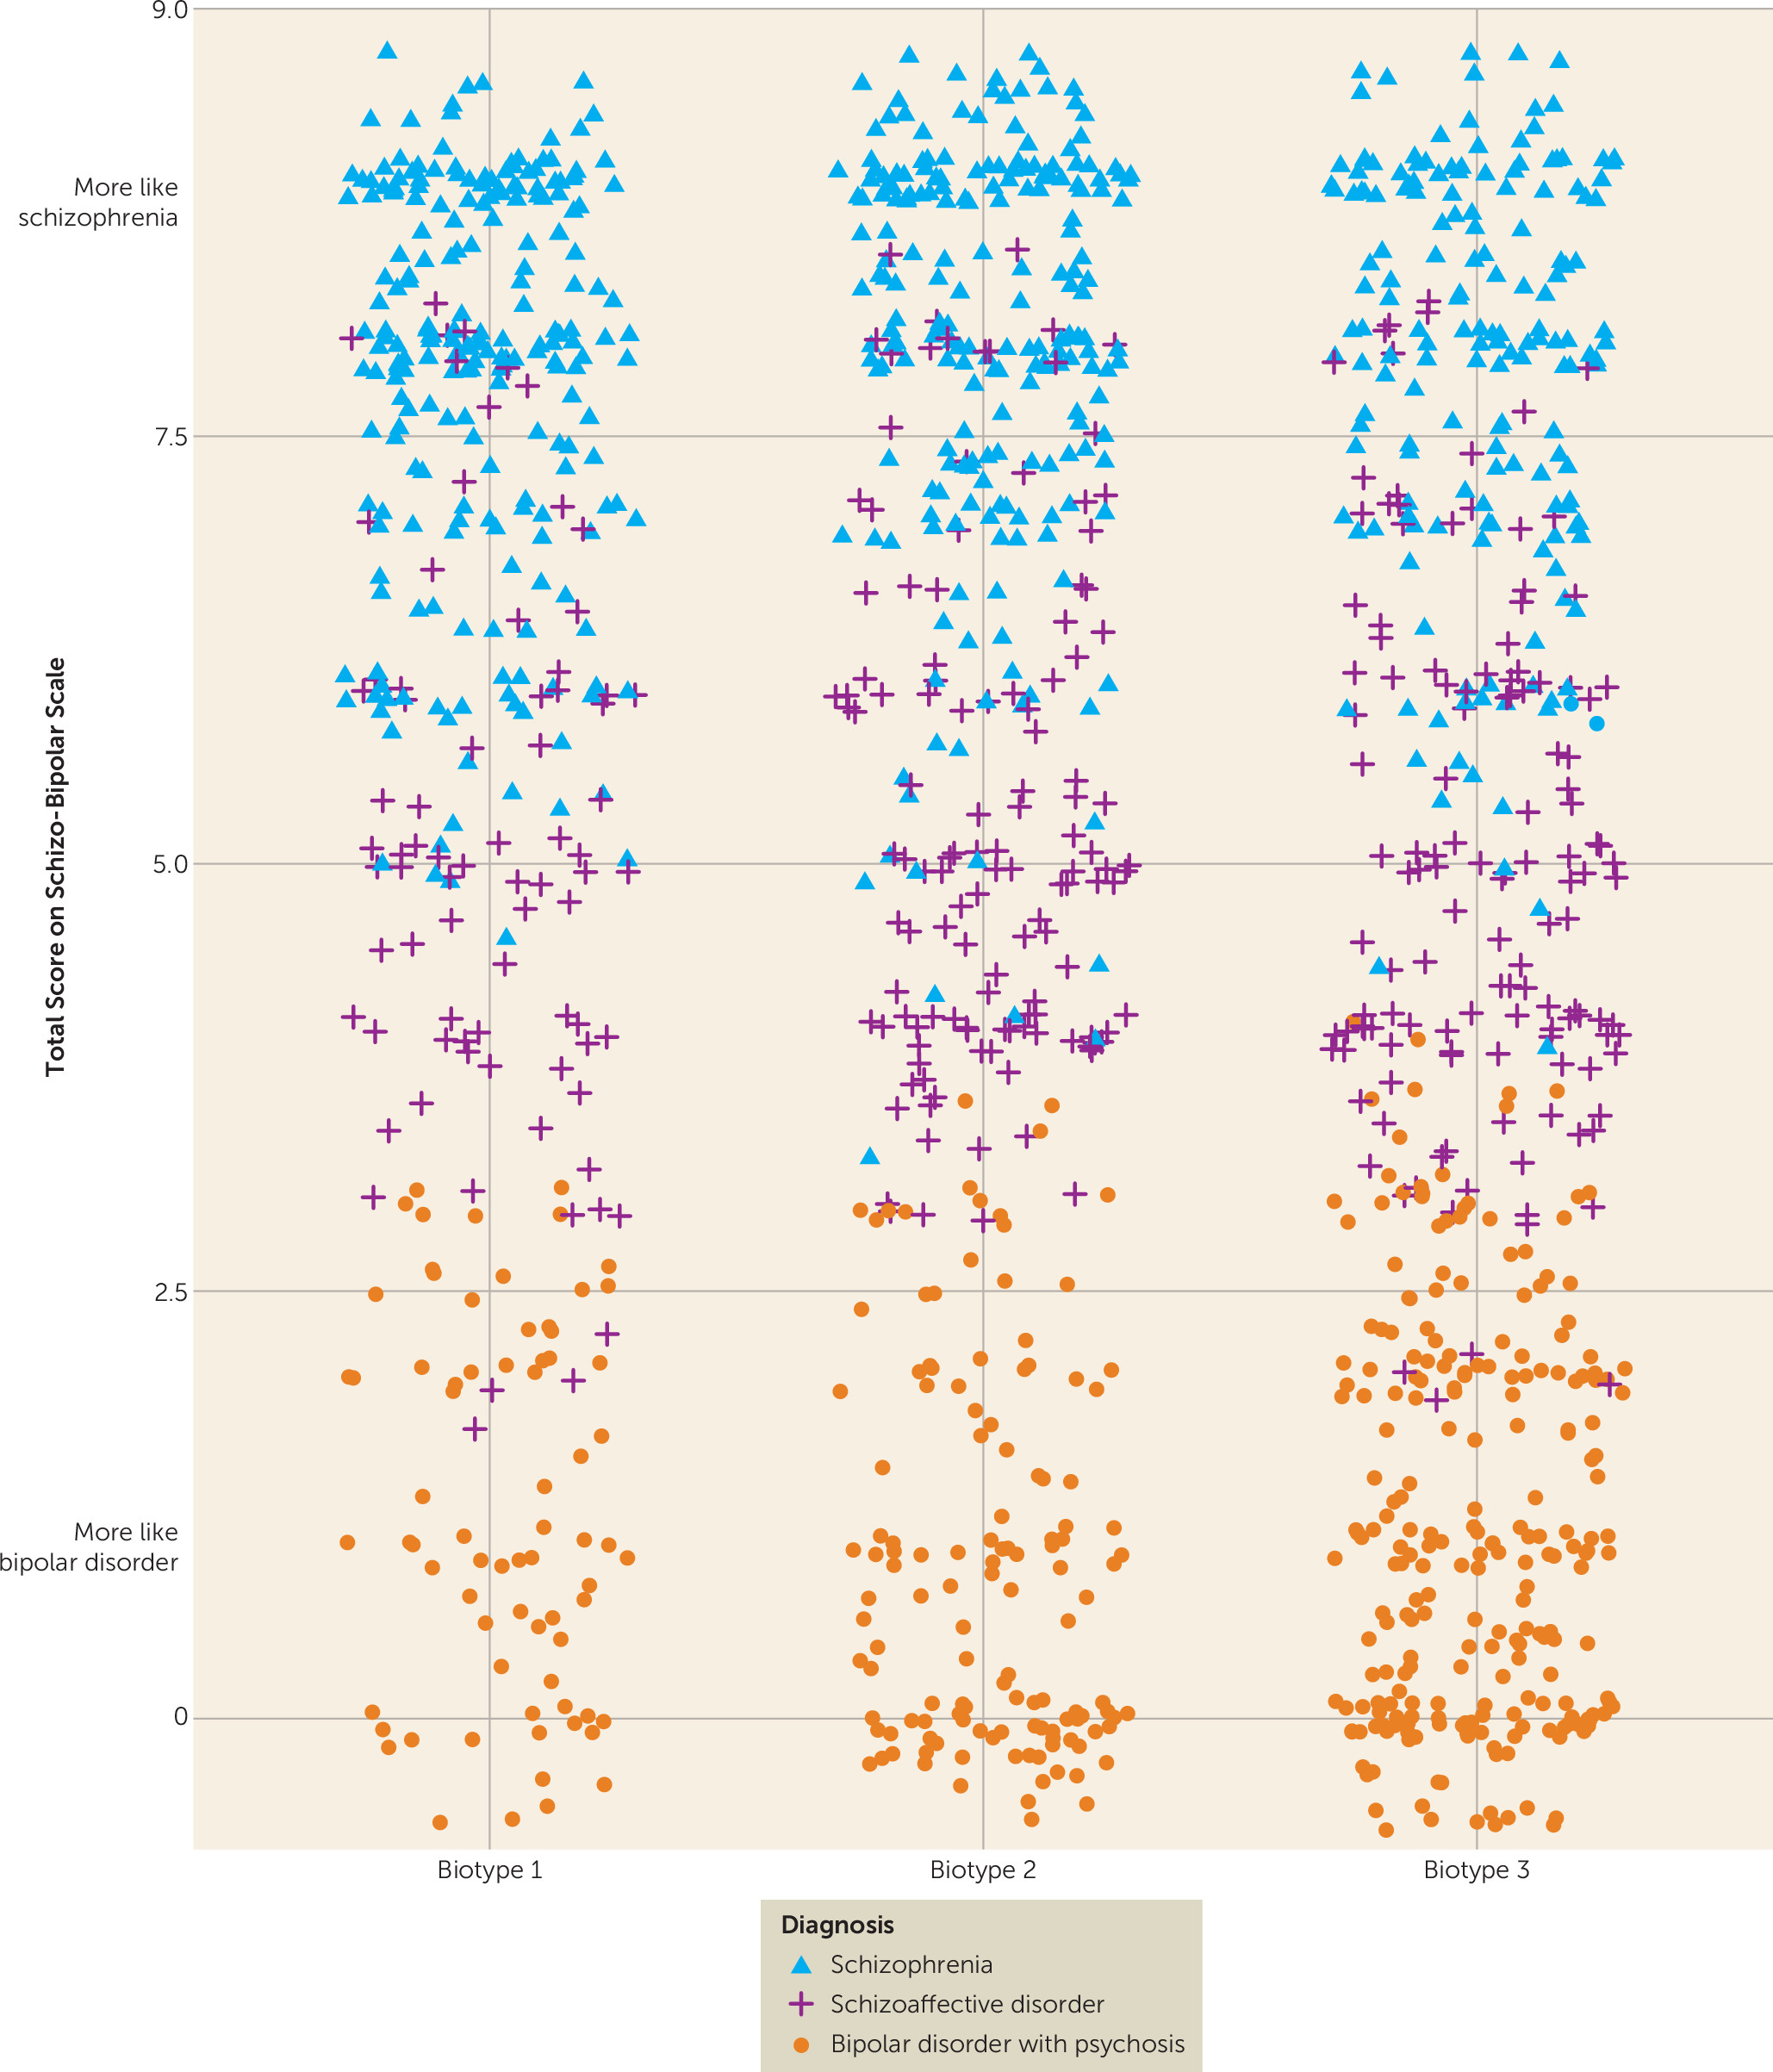
There was an unequal distribution of DSM diagnoses across biotypes (Table 1), with biotype 1 having more schizophrenia (59%) and biotype 3 having more bipolar disorder with psychosis (44%). Nevertheless, as illustrated in Figure 2 and Figure S3 in the data supplement, there was considerable mixing across biotypes of DSM psychosis diagnoses. Similarly, there was considerable overlap across the neurobiologically distinct biotypes on global psychosis-related clinical ratings (Table 1). First, biotypes 1 and 2 did not differ in scores on the Schizo-Bipolar Scale (19), a global measure of schizophrenia symptoms (high scores) versus bipolar disorder symptoms (low scores) (see Figure 2). Second, biotype 3 had lower ratings for positive and negative symptoms than the other two biotypes. Third, biotypes did not differ on mania-related symptoms.
FIGURE 2. Distribution of Schizo-Bipolar Scale Scores of Probands With Psychosis, by Biotype and DSM Diagnosisa,b
a Probands with schizophrenia have higher scores, probands with bipolar disorder with psychosis have lower scores, and probands with schizoaffective disorder have intermediate scores on the Schizo-Bipolar Scale (19), and all three clinical diagnoses are prominently represented within each biotype. These two features indicate that neurobiological distinctiveness of the biotypes is not captured by DSM diagnoses.
b Because there are so many data points, some scores were pseudorandomly jittered around their mean.
Two other clinical characteristics differentiated the biotypes (Table 1). First, the biotypes significantly differed in ratings on the Birchwood Social Functioning Scale, which assesses social engagement, psychosocial independence and competence, and occupational success; biotype 1 showed the most psychosocial impairment, and biotype 3 had the least impairment. Second, the rate of cases of psychosis or psychosis-related personality disorder among the relatives of the biotype 3 probands was significantly lower than the rates for the relatives of probands with the other two biotypes (see Table S7 in the online supplement for the same data by DSM diagnosis).

Structural Neuroanatomical Features of Biotypes
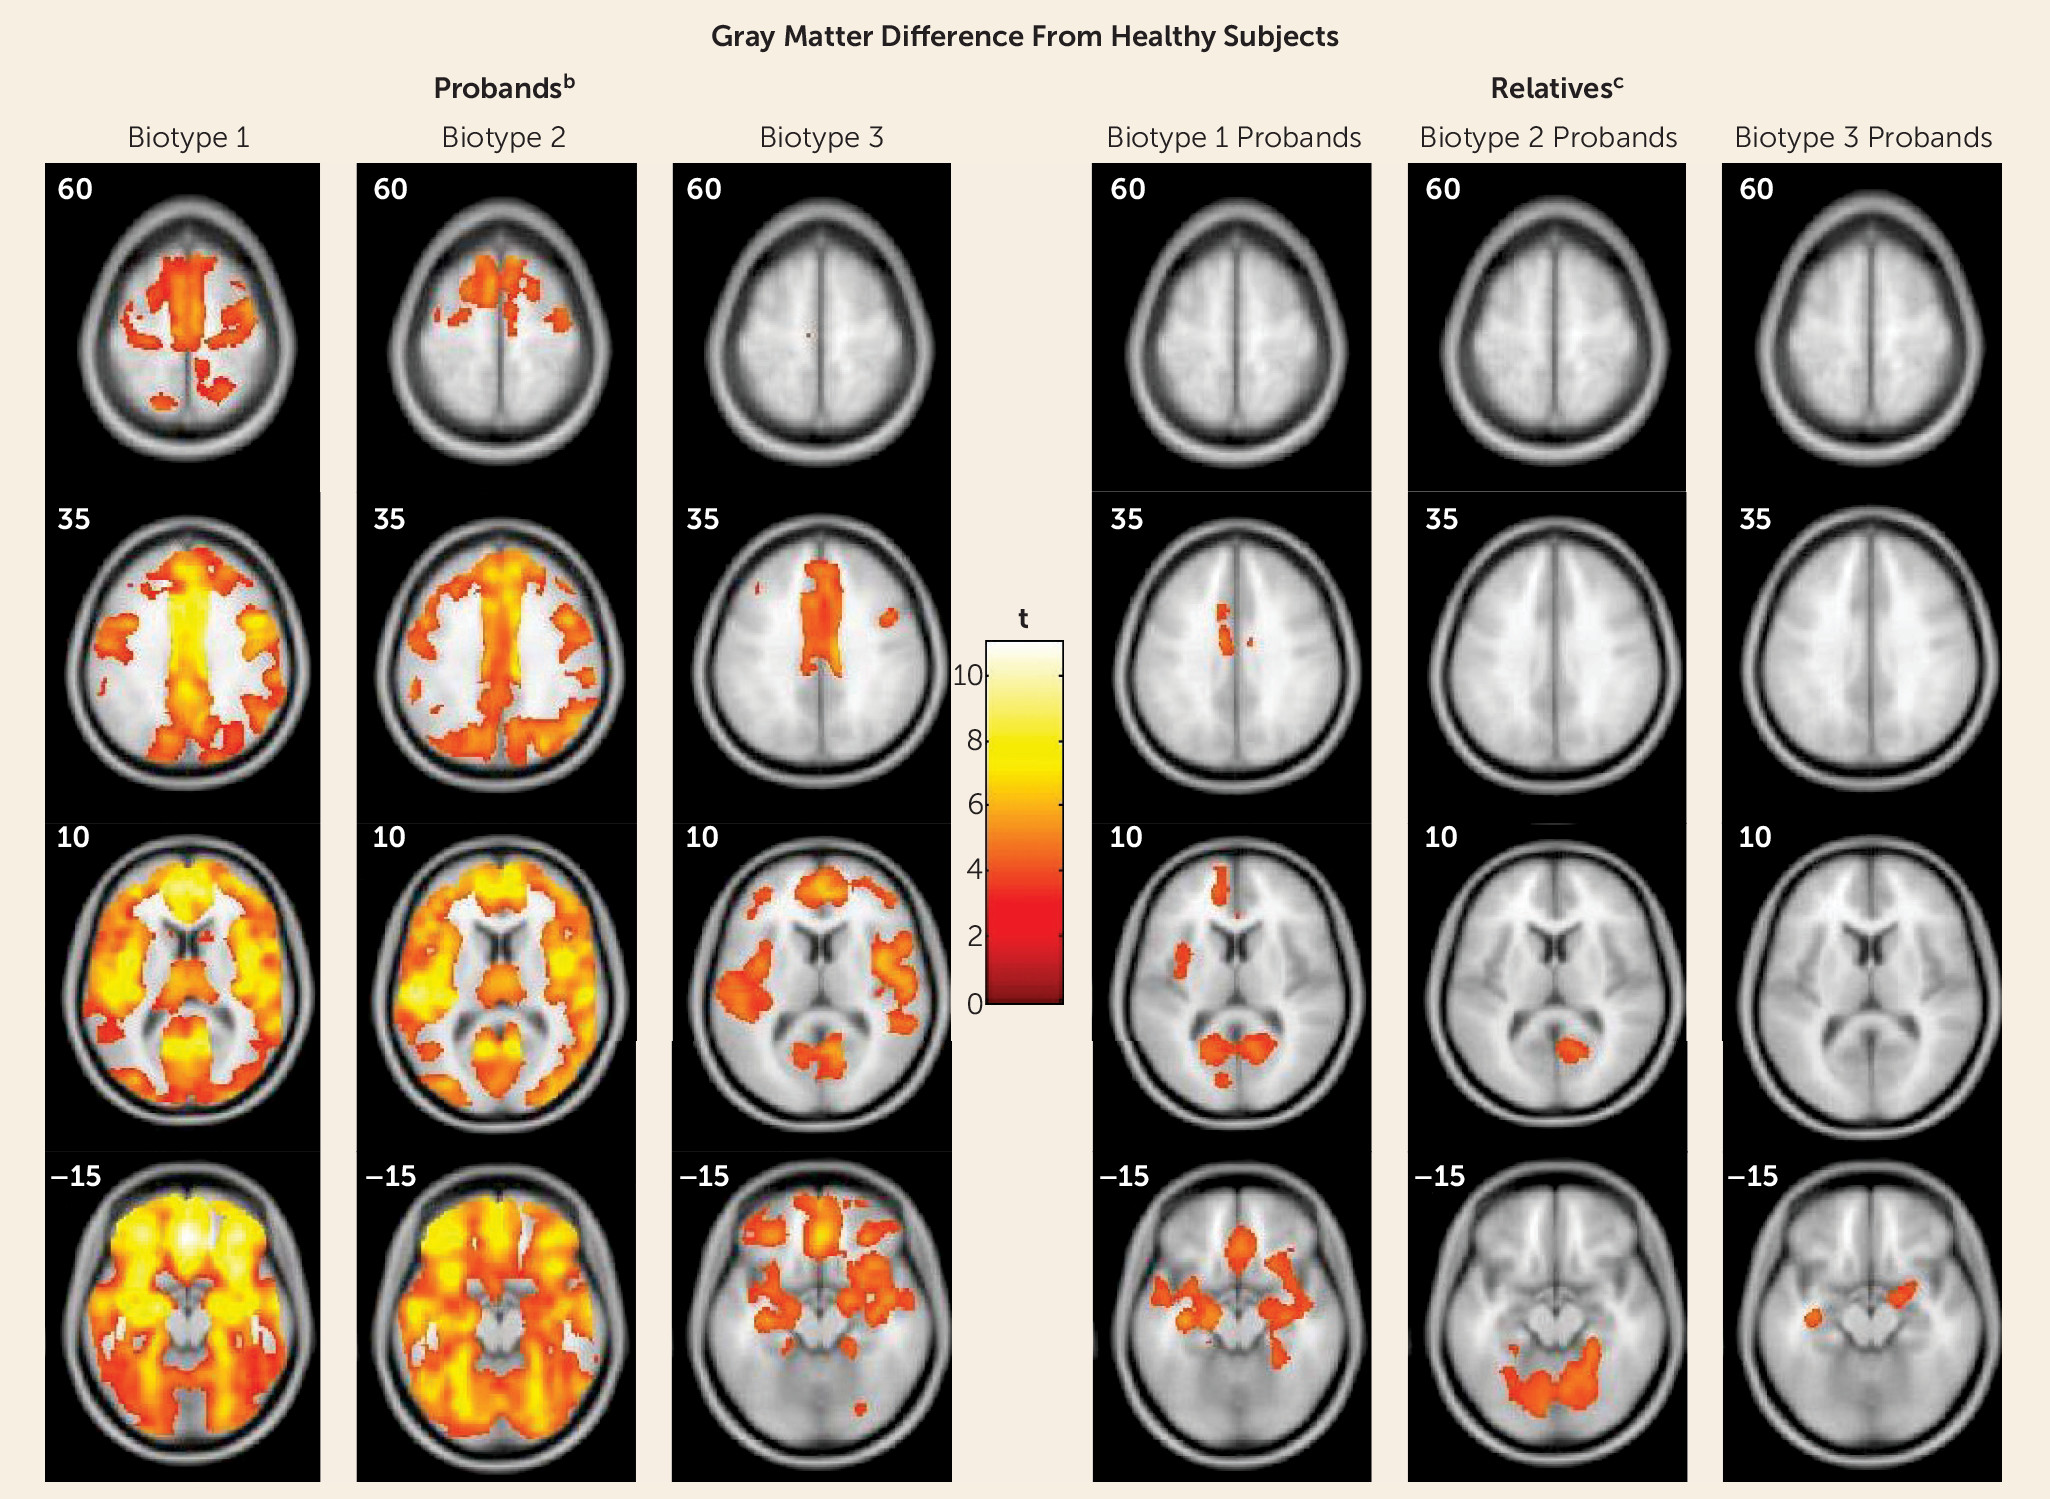
These data were not used in biotype creation, so, like data on social functioning (see above) and for biological relatives (see below), they provide an independent means for validating biotype categorizations. Figure 3 shows the deviations of whole brain gray matter volume from that of the healthy subjects by biotype; Table 3 presents effect sizes by region for biotypes and DSM diagnoses (see supplementary Table S8 for more details on regional differences). Probands with biotype 1 had widespread gray matter reductions in predominantly frontal, cingulate, temporal, and parietal cortex, as well as in the basal ganglia and thalamus. The gray matter changes for biotype 2 were regionally similar to those of biotype 1, albeit with lower effect sizes than in biotype 1. In biotype 3, the probands’ volumetric reductions were modest and predominantly localized to anterior limbic brain regions. Alternatively, although the bipolar probands had modest deviations from healthy subjects on regional brain volumes, the probands with schizophrenia and schizoaffective disorder were statistically indistinguishable across brain regions on these measures (see Table 3 and reference 44).
FIGURE 3. Gray Matter Differences From Healthy Subjects in Voxel-Based Morphometry Results for Probands With Psychosis and Their First-Degree Relatives, by Proband Biotypea
a Images are displayed in neurological convention. Outcomes are reported at p=0.05, with cluster-wise family-wise-error correction.
b Biotype 1 had the most extensive volume reductions, with the largest effects in the frontal, cingulate, temporal, and parietal cortex, as well as basal ganglia and thalamus. Biotype 2 had volume reductions regionally overlapping with those in biotype 1, with the largest effects in the frontotemporal cortex, parietal cortex, and cerebellum, albeit of a lesser magnitude overall than for biotype 1. Biotype 3 had smaller clusters of reductions that were primarily distributed over frontal, cingulate, and temporal regions.
c The biological relatives of biotype 1 probands showed predominantly anterior, mostly frontotemporal, gray matter volume differences. The relatives of biotype 2 probands showed posterior, mostly cerebellar, reductions. The relatives of biotype 3 probands showed small clusters of reductions limited to bilateral temporal regions and right inferior frontal regions.
TABLE 3. Regional Brain Structure Characteristics of Probands With Psychosis and Their First-Degree Relatives, by Proband DSM Diagnosis and Biotypea
 Group Separation From Healthy Subjects, in Effect Size Units
 Proband DSM DiagnosisbProband Biotype Class
Group and Brain RegionBDPSzAffSZBiotype 1Biotype 2Biotype 3
Probands      
Frontal/inferior frontal gyrus0.540.700.841.00.820.52
Cingulate gyrus0.430.730.680.970.660.52
Temporal/superior temporal gyrus0.550.680.760.880.800.53
Occipital/lingual gyrus0.160.640.600.730.650.38
Cerebellum0.000.620.560.720.620.34
Overall0.340.670.690.860.710.46
Relatives      
Frontal/inferior frontal gyrus0.000.000.160.430.000.16
Cingulate gyrus0.000.210.350.410.000.00
Temporal/superior temporal gyrus0.150.230.170.400.000.34
Occipital/lingual gyrus0.000.360.400.410.420.00
Cerebellum0.000.160.320.340.440.00
Overall0.030.190.280.400.170.10
a
Brain images showing contrasts with healthy subjects for probands and relatives are provided in Figure 3. In this table, each “Overall” row provides data averaged over all selected brain regions. See Table S8 in the online data supplement for these data for all brain regions.
b
BDP, bipolar disorder with psychosis. SzAff, schizoaffective disorder. SZ, schizophrenia.

Neurobiological and Clinical Characteristics of Biological Relatives by Biotype

As indicated in Table 2C, the biomarkers showed substantial intrafamilial similarity, with these estimates being largely enhanced by discriminant function integration across biomarkers. First, Figure 1 shows the same, but less extreme, pattern of performance on cognitive control (F=37.6, df=3, 997, p<0.001) and sensorimotor reactivity (F=9.2, df=3, 997, p<0.001) for the biological relatives of the three proband biotype classes (see also Table 2B). Even when all the clinically affected relatives were removed from these analyses, the same, but attenuated, pattern of significant differences remained (see Figure S4 in the data supplement), indicating that cognitive control and sensorimotor reactivity are indexing independent constitutional indicators of liability for these psychosis biotypes. Second, the relatives also showed the same pattern of compromised social functioning as the probands, with the relatives of biotype 1 probands being the most compromised and the relatives of the biotype 3 probands being the least compromised (see Table 1). Even when clinically affected relatives were removed, the relatives of the biotype 1 and 2 probands still showed compromised social functioning compared with healthy persons. Third, the relatives showed structural brain deviations intermediate in magnitude between their respective probands and the healthy persons, but with specific and important differences as a function of proband group (see Figure 3, Table 3, and Table S8 in the data supplement). Biotype 1 relatives, similar to their probands, had widespread gray matter volume loss. Biotype 2 relatives, however, had predominantly posterior, mostly occipital and cerebellar, reductions. Biotype 3 relatives had more modest reductions, mostly limited to temporal regions. When the relatives with psychosis-related diagnoses were removed, all relative groups still showed significant gray matter volume reductions.

Discussion

The neurobiological heterogeneity across the psychosis spectrum illustrates the difficulty with attempting to derive etiological and neurobiological distinctiveness from clinical phenomenology alone. The present approach drew on biomarker heterogeneity to identify brain-based psychosis biotypes independent of specific clinical features (other than presence of psychosis). Each biotype included all DSM psychosis categories, but probands diagnosed with schizophrenia were more numerous in biotype 1 (although 20% had bipolar disorder with psychosis) and probands diagnosed with bipolar disorder with psychosis were more numerous in biotype 3 (although 32% had schizophrenia), respectively. Measures not used in creation of the biotypes, including social functioning, brain structure, and characteristics of biological relatives, independently supported biotype distinctiveness. When considered across proband and relative data, the biotype subgroups were superior to DSM diagnostic classes in between-group separations on external validating measures, illustrating the former scheme’s superiority for capturing neurobiological distinctiveness.
An important feature of our approach was integration across numerous laboratory biomarker measures of psychosis-related neurobiological deviations. The statistically derived constructs, labeled “cognitive control” and “sensorimotor reactivity” given their constituents, have played prominent roles in previous attempts to describe neurobiological deviations in psychosis, most notably schizophrenia (48). These multivariate constructs were superior to the individual biomarkers (had larger effect sizes) for distinguishing between subgroups. This was true for both biotype designations and DSM diagnostic classes. Epigenetics, etiological heterogeneity, pleiotropy, and variable expressivity, among other factors, influence phenotypic manifestations (50), making it difficult for a single laboratory measure to be pathognomonic for complex psychiatric diseases.
These data also indicated that there may be multiple pathways to clinically similar psychosis manifestations. Biotype 1, the subgroup with the fewest probands, was most prototypical of the chronic, deteriorated, poor-outcome cases often considered to capture the essence of schizophrenia (19, 23, 26, 29). These participants showed profound dysfunction on cognitive control and had severely compromised neural reactivity to even simple sensory events. Their first-degree biological relatives showed the same pattern of deviations. In contrast, individuals in biotype 2, although also demonstrating marked, but less severe, cognitive control dysfunction, were characterized by accentuated sensorimotor reactivity, a feature that has been previously described (51). This pattern of deviations for biotype 2 probands was mirrored in their biological relatives. Nevertheless, biotypes 1 and 2 had highly similar clinical severity and evidence for familial psychosis risk. In contrast, individuals in biotype 3, the largest of the groups, showed less severe clinical psychosis manifestations, nearly normal cognition, and sensorimotor reactivity less distinguishable from normal.
These differential patterns of biomarkers across biotypes invoke an explanation for the marked heterogeneity in DSM diagnoses that is routinely observed across research laboratories, even on the same biomarker variables. Individuals with biotype 1, being the most compromised, might be more likely to be recruited in inpatient settings, while those with biotype 2 or 3 might be more prominent in outpatient clinics. In addition, researchers working in settings that captured mostly biotype 3 probands would justly conclude that studying neurobiological risk indicators (endophenotypes) for psychosis among biological relatives was a futile enterprise. Investigators in molecular genetic studies sampling high concentrations of biotype 3 probands also might conclude that a large proportion of the variance in psychosis genetic risk was captured by spontaneous mutations (1214). Recruitment strategy and subject sampling, therefore, might influence determinations of beliefs concerning the core neurobiological features of psychosis.
These divergent biomarker patterns across biotypes also illustrate the difficulty with using solely clinical psychosis diagnoses as the “gold standard” for capturing neurobiological distinctiveness (32, 33). The psychosis probands (as a group) showed at least some degree of cognitive control deviation, but the remarkable difference between diminution and accentuation of sensorimotor reactivity across individuals with psychosis would certainly lead to devaluing this group of measures for understanding psychosis neurobiology in mixed samples (the overall mean would be close to that seen among healthy persons). In contrast, molecular, pharmacological, and genetic studies directly comparing biotype 1, 2, and 3 subgroups, as defined by both cognitive control and sensorimotor reactivity constructs, could be useful for disentangling at least part of the etiological and pathophysiological heterogeneity purported to typify clinical psychosis (52).
The biotype outcome provides proof of concept that structural and functional brain biomarker measures can sort individuals with psychosis into groups that are neurobiologically distinctive and appear biologically meaningful. These outcomes inspire specific theories that could be fruitfully investigated. First, biotypes 1 and 2 should be of greater interest in familial genetic investigations, while perhaps biotype 3 would be more informative for explorations of environmental correlates of psychosis risk, spontaneous mutations, and/or epigenetic modifications. Second, treatments for biotype 1 would be naturally directed both to profoundly compromised cognitive control and to correcting reduced neural activations that compromise signal-to-noise ratios for discerning environmental stimulus relevance (manifest in EEG signals). Third, biotypes 1 and 2 could be explored for potassium and/or calcium channel alterations and channel-based therapies that may correct neuronal hypo- or hyperexcitability (53). It is possible that biotypes and/or related neurobiological parsing approaches will contribute to defining biological correlates of psychosis. Whether these constructs become important in psychosis research will depend on their usefulness, i.e., on their ability to foster and support incisive molecular, genetic, and treatment distinctions.
The present approach to parsing neurobiological variance among the psychoses has limitations that we attempted to minimize but could not completely overcome in this single project. First, the probands were mostly medicated, chronically psychotic, and tested at one time point; we have yet to demonstrate the longitudinal stability of these subgroupings, though the biomarkers themselves may be stable traits. Second, there was no replication sample in this initial data analysis, even though collection of a larger replication sample is in process. We did, however, test the accuracy of the neurobiological classification by using a jackknife procedure, and the data on first-degree relatives provided additional and important support for the subgrouping scheme (these data were not used in biotype construction). Third, the included biomarkers were chosen on the basis of their previously demonstrated success (at the initiation of this project) for distinguishing psychotic disorder subjects (probands and relatives) from healthy persons (38). It is unlikely that this demonstration of a promising means for capturing neurobiological distinctiveness in psychosis describes all relevant possibilities; the inclusion of additional biomarkers may be useful in this regard. Fourth, the estimation of biotype membership, at present, requires extensive biomarker assessments. A means for estimating such membership, however, through clinical examination would be an extremely useful contribution to our understanding of the psychoses.

Acknowledgments

The authors thank Brad Witte and Gaurav Poudyal for their contributions to data management, which allowed for seamless analysis and inspection of all B-SNIP data resources, and they thank the patient and family volunteers who joined this study and contributed their time and individual data.

Supplementary Material

File (appi.ajp.2015.14091200.correction.pdf)
File (appi.ajp.2015.14091200.ds001.pdf)
File (appi.ajp.2015.14091200.ds001.tables.figures.pdf)
File (appi.ajp.2015.14091200.ds002.methods.pdf)
File (appi.ajp.2015.14091200.ds002.pdf)

References

1.
Curtis C, Shah SP, Chin SF, et al: The genomic and transcriptomic architecture of 2,000 breast tumours reveals novel subgroups. Nature 2012; 486:346–352
2.
Yang Y, Han L, Yuan Y, et al: Gene co-expression network analysis reveals common system-level properties of prognostic genes across cancer types. Nat Commun 2014; 5:3231
3.
Rzhetsky A, Wajngurt D, Park N, et al: Probing genetic overlap among complex human phenotypes. Proc Natl Acad Sci USA 2007; 104:11694–11699
4.
Waltman P, Pearlman A, Mishra B: Interpreter of maladies: redescription mining applied to biomedical data analysis. Pharmacogenomics 2006; 7:503–509
5.
Bethune G, Bethune D, Ridgway N, et al: Epidermal growth factor receptor (EGFR) in lung cancer: an overview and update. J Thorac Dis 2010; 2:48–51
6.
Yang JC, Shih JY, Su WC, et al: Afatinib for patients with lung adenocarcinoma and epidermal growth factor receptor mutations (LUX-Lung 2): a phase 2 trial. Lancet Oncol 2012; 13:539–548
7.
National Research Council (US): Committee on a Framework for Developing a New Taxonomy of Disease: Toward Precision Medicine: Building a Knowledge Network for Biomedical Research and a New Taxonomy of Disease. Washington, DC, National Academies Press, 2011
8.
American Psychiatric Association: Diagnostic and Statistical Manual of Mental Disorders, 5th ed. Arlington, Va, American Psychiatric Publishing, 2013
9.
Insel T, Cuthbert B, Garvey M, et al: Research Domain Criteria (RDoC): toward a new classification framework for research on mental disorders. Am J Psychiatry 2010; 167:748–751
10.
Cardno AG, Rijsdijk FV, West RM, et al: A twin study of schizoaffective-mania, schizoaffective-depression, and other psychotic syndromes. Am J Med Genet B Neuropsychiatr Genet 2012; 159B:172–182
11.
Gershon ES, Badner JA, Goldin LR, et al: Closing in on genes for manic-depressive illness and schizophrenia. Neuropsychopharmacology 1998; 18:233–242
12.
Gejman PV, Sanders AR, Kendler KS: Genetics of schizophrenia: new findings and challenges. Annu Rev Genomics Hum Genet 2011; 12:121–144
13.
Gershon ES, Alliey-Rodriguez N, Liu C: After GWAS: searching for genetic risk for schizophrenia and bipolar disorder. Am J Psychiatry 2011; 168:253–256
14.
Malhotra D, Sebat J: CNVs: harbingers of a rare variant revolution in psychiatric genetics. Cell 2012; 148:1223–1241
15.
Ethridge LE, Hamm JP, Pearlson GD, et al: Event-related potential and time-frequency endophenotypes for schizophrenia and psychotic bipolar disorder. Biol Psychiatry 2015; 77:127–136
16.
Ethridge LE, Soilleux M, Nakonezny PA, et al: Behavioral response inhibition in psychotic disorders: diagnostic specificity, familiality and relation to generalized cognitive deficit. Schizophr Res 2014; 159:491–498
17.
Hamm JP, Ethridge LE, Boutros NN, et al: Diagnostic specificity and familiality of early versus late evoked potentials to auditory paired stimuli across the schizophrenia-bipolar psychosis spectrum. Psychophysiology 2014; 51:348–357
18.
Hill SK, Reilly JL, Keefe RS, et al: Neuropsychological impairments in schizophrenia and psychotic bipolar disorder: findings from the Bipolar-Schizophrenia Network on Intermediate Phenotypes (B-SNIP) study. Am J Psychiatry 2013; 170:1275–1284
19.
Keshavan MS, Morris DW, Sweeney JA, et al: A dimensional approach to the psychosis spectrum between bipolar disorder and schizophrenia: the Schizo-Bipolar Scale. Schizophr Res 2011; 133:250–254
20.
Khadka S, Meda SA, Stevens MC, et al: Is aberrant functional connectivity a psychosis endophenotype? A resting state functional magnetic resonance imaging study. Biol Psychiatry 2013; 74:458–466
21.
Meda SA, Ruaño G, Windemuth A, et al: Multivariate analysis reveals genetic associations of the resting default mode network in psychotic bipolar disorder and schizophrenia. Proc Natl Acad Sci USA 2014; 111:E2066–E2075
22.
Reilly JL, Frankovich K, Hill S, et al: Elevated antisaccade error rate as an intermediate phenotype for psychosis across diagnostic categories. Schizophr Bull 2014; 40:1011–1021
23.
Rosen C, Marvin R, Reilly JL, et al: Phenomenology of first-episode psychosis in schizophrenia, bipolar disorder, and unipolar depression: a comparative analysis. Clin Schizophr Relat Psychoses 2012; 6:145–151
24.
Shinn AK, Pfaff D, Young S, et al: Auditory hallucinations in a cross-diagnostic sample of psychotic disorder patients: a descriptive, cross-sectional study. Compr Psychiatry 2012; 53:718–726
25.
Skudlarski P, Schretlen DJ, Thaker GK, et al: Diffusion tensor imaging white matter endophenotypes in patients with schizophrenia or psychotic bipolar disorder and their relatives. Am J Psychiatry 2013; 170:886–898
26.
Tamminga CA, Ivleva EI, Keshavan MS, et al: Clinical phenotypes of psychosis in the Bipolar-Schizophrenia Network on Intermediate Phenotypes (B-SNIP). Am J Psychiatry 2013; 170:1263–1274
27.
Leucht S, Cipriani A, Spineli L, et al: Comparative efficacy and tolerability of 15 antipsychotic drugs in schizophrenia: a multiple-treatments meta-analysis. Lancet 2013; 382:951–962
28.
Clementz BA, Sweeney J, Keshavan MS, et al: Using biomarker batteries. Biol Psychiatry 2015; 77:90–92
29.
Keshavan MS, Clementz BA, Pearlson GD, et al: Reimagining psychoses: an agnostic approach to diagnosis. Schizophr Res 2013; 146:10–16
30.
Barkovich J: Complication begets clarification in classification. Brain 2013; 136:368–373
31.
Romero R, Dey SK, Fisher SJ: Preterm labor: one syndrome, many causes. Science 2014; 345:760–765
32.
Hyman SE: Diagnosing the DSM: diagnostic classification needs fundamental reform. Cerebrum (Epub ahead of print, April 26, 2011)
33.
Kapur S, Phillips AG, Insel TR: Why has it taken so long for biological psychiatry to develop clinical tests and what to do about it? Mol Psychiatry 2012; 17:1174–1179
34.
Hyman SE: Revolution stalled. Sci Transl Med 2012; 4:155cm11
35.
Zanarini MC, Frankenburg FR, Sickel AE, et al: Diagnostic Interview for DSM-IV Personality Disorders (DIPD-IV). Boston, McLean Hospital, 1996
36.
Andreasen NC, Endicott J, Spitzer RL, et al: The family history method using diagnostic criteria: reliability and validity. Arch Gen Psychiatry 1977; 34:1229–1235
37.
Iacono WG, Clementz BA: A strategy for elucidating genetic influences on complex psychopathological syndromes (with special reference to ocular motor functioning and schizophrenia). Prog Exp Pers Psychopathol Res 1993; 16:11–65
38.
Thaker GK: Neurophysiological endophenotypes across bipolar and schizophrenia psychosis. Schizophr Bull 2008; 34:760–773
39.
Keefe RS, Goldberg TE, Harvey PD, et al: The Brief Assessment of Cognition in Schizophrenia: reliability, sensitivity, and comparison with a standard neurocognitive battery. Schizophr Res 2004; 68:283–297
40.
Harvey PD, Keefe RSE, Patterson TL, et al: Abbreviated neuropsychological assessment in schizophrenia: prediction of different aspects of outcome. J Clin Exp Neuropsychol 2009; 31:462–471
41.
Reilly JL, Harris MS, Khine TT, et al: Reduced attentional engagement contributes to deficits in prefrontal inhibitory control in schizophrenia. Biol Psychiatry 2008; 63:776–783
42.
Clementz BA: The ability to produce express saccades as a function of gap interval among schizophrenia patients. Exp Brain Res 1996; 111:121–130
43.
McDowell JE, Myles-Worsley M, Coon H, et al: Measuring liability for schizophrenia using optimized antisaccade stimulus parameters. Psychophysiology 1999; 36:138–141
44.
Ivleva EI, Bidesi AS, Keshavan MS, et al: Gray matter volume as an intermediate phenotype for psychosis: Bipolar-Schizophrenia Network on Intermediate Phenotypes (B-SNIP). Am J Psychiatry 2013; 170:1285–1296
45.
Ding C, He X: K-means clustering via principal component analysis, in Proceedings of the 21st International Conference on Machine Learning. New York, ACM, 2004, p 29
46.
Tibshirani R, Walther G, Hastie T: Estimating the number of clusters in a data set via the gap statistic. JR Stat Soc Series B Stat Methodol 2001; 63:411–423
47.
Jain AK: Data clustering: 50 years beyond K-means. Pattern Recognit Lett 2010; 31:651–666
48.
Friston KJ, Frith CD: Schizophrenia: a disconnection syndrome? Clin Neurosci 1995; 3:89–97
49.
Severiano A, Carriço JA, Robinson DA, et al: Evaluation of jackknife and bootstrap for defining confidence intervals for pairwise agreement measures. PLoS One 2011; 6:e19539
50.
Rosenberg RN, Pascual JN: Rosenberg’s Molecular and Genetic Basis of Neurological and Psychiatric Diseases, 5th ed. Waltham, Mass, Academic Press, 2014
51.
Hamm JP, Gilmore CS, Clementz BA: Augmented gamma band auditory steady-state responses: support for NMDA hypofunction in schizophrenia. Schizophr Res 2012; 138:1–7
52.
Ivleva EI, Morris DW, Moates AF, et al: Genetics and intermediate phenotypes of the schizophrenia—bipolar disorder boundary. Neurosci Biobehav Rev 2010; 34:897–921
53.
Yanagi M, Joho RH, Southcott SA, et al: Kv3.1-containing K(+) channels are reduced in untreated schizophrenia and normalized with antipsychotic drugs. Mol Psychiatry 2014; 19:573–579

Information & Authors

Information

Published In

Go to American Journal of Psychiatry
American Journal of Psychiatry
Pages: 373 - 384
PubMed: 26651391

History

Received: 25 September 2014
Revision received: 9 March 2015
Revision received: 29 May 2015
Revision received: 12 August 2015
Accepted: 18 September 2015
Published online: 7 December 2015
Published in print: April 01, 2016

Authors

Details

Brett A. Clementz, Ph.D.
From the Departments of Psychology and Neuroscience, Bio-Imaging Research Center, University of Georgia, Athens; the Department of Psychiatry, University of Texas Southwestern Medical Center, Dallas; the Departments of Psychiatry and Neurobiology, Yale University School of Medicine, New Haven, Conn., and the Institute of Living, Hartford Hospital, Hartford, Conn.; and the Department of Psychiatry, Harvard Medical School, Boston.
John A. Sweeney, Ph.D.
From the Departments of Psychology and Neuroscience, Bio-Imaging Research Center, University of Georgia, Athens; the Department of Psychiatry, University of Texas Southwestern Medical Center, Dallas; the Departments of Psychiatry and Neurobiology, Yale University School of Medicine, New Haven, Conn., and the Institute of Living, Hartford Hospital, Hartford, Conn.; and the Department of Psychiatry, Harvard Medical School, Boston.
Jordan P. Hamm, Ph.D.
From the Departments of Psychology and Neuroscience, Bio-Imaging Research Center, University of Georgia, Athens; the Department of Psychiatry, University of Texas Southwestern Medical Center, Dallas; the Departments of Psychiatry and Neurobiology, Yale University School of Medicine, New Haven, Conn., and the Institute of Living, Hartford Hospital, Hartford, Conn.; and the Department of Psychiatry, Harvard Medical School, Boston.
Elena I. Ivleva, M.D., Ph.D.
From the Departments of Psychology and Neuroscience, Bio-Imaging Research Center, University of Georgia, Athens; the Department of Psychiatry, University of Texas Southwestern Medical Center, Dallas; the Departments of Psychiatry and Neurobiology, Yale University School of Medicine, New Haven, Conn., and the Institute of Living, Hartford Hospital, Hartford, Conn.; and the Department of Psychiatry, Harvard Medical School, Boston.
Lauren E. Ethridge, Ph.D.
From the Departments of Psychology and Neuroscience, Bio-Imaging Research Center, University of Georgia, Athens; the Department of Psychiatry, University of Texas Southwestern Medical Center, Dallas; the Departments of Psychiatry and Neurobiology, Yale University School of Medicine, New Haven, Conn., and the Institute of Living, Hartford Hospital, Hartford, Conn.; and the Department of Psychiatry, Harvard Medical School, Boston.
Godfrey D. Pearlson, M.D.
From the Departments of Psychology and Neuroscience, Bio-Imaging Research Center, University of Georgia, Athens; the Department of Psychiatry, University of Texas Southwestern Medical Center, Dallas; the Departments of Psychiatry and Neurobiology, Yale University School of Medicine, New Haven, Conn., and the Institute of Living, Hartford Hospital, Hartford, Conn.; and the Department of Psychiatry, Harvard Medical School, Boston.
Matcheri S. Keshavan, M.D.
From the Departments of Psychology and Neuroscience, Bio-Imaging Research Center, University of Georgia, Athens; the Department of Psychiatry, University of Texas Southwestern Medical Center, Dallas; the Departments of Psychiatry and Neurobiology, Yale University School of Medicine, New Haven, Conn., and the Institute of Living, Hartford Hospital, Hartford, Conn.; and the Department of Psychiatry, Harvard Medical School, Boston.
Carol A. Tamminga, M.D.
From the Departments of Psychology and Neuroscience, Bio-Imaging Research Center, University of Georgia, Athens; the Department of Psychiatry, University of Texas Southwestern Medical Center, Dallas; the Departments of Psychiatry and Neurobiology, Yale University School of Medicine, New Haven, Conn., and the Institute of Living, Hartford Hospital, Hartford, Conn.; and the Department of Psychiatry, Harvard Medical School, Boston.

Notes

Address correspondence to Dr. Clementz ([email protected]).

Competing Interests

Dr. Keshavan has received a grant from Sunovion and is a consultant to Forum Pharmaceuticals. Dr. Sweeney has served as a consultant to Takeda, Roche, and Lilly. Dr. Tamminga is a Deputy Editor of the Journal; her financial disclosures appear in the April 2015 issue. The other authors report no financial relationships with commercial interests.

Funding Information

National Institute of Mental Health10.13039/100000025: MH077851, MH077852, MH077862, MH077945, MH078113
Supported by NIMIH grants MH-077851, MH-078113, MH-077945, MH-077852, and MH-077862.

Metrics & Citations

Metrics

Citations

Export Citations

If you have the appropriate software installed, you can download article citation data to the citation manager of your choice. Simply select your manager software from the list below and click Download.

For more information or tips please see 'Downloading to a citation manager' in the Help menu.

Format
Citation style
Style
Copy to clipboard

View Options

View options

PDF/EPUB

View PDF/EPUB

Login options

Already a subscriber? Access your subscription through your login credentials or your institution for full access to this article.

Personal login Institutional Login Open Athens login
Purchase Options

Purchase this article to access the full text.

PPV Articles - American Journal of Psychiatry

PPV Articles - American Journal of Psychiatry

Not a subscriber?

Subscribe Now / Learn More

PsychiatryOnline subscription options offer access to the DSM-5-TR® library, books, journals, CME, and patient resources. This all-in-one virtual library provides psychiatrists and mental health professionals with key resources for diagnosis, treatment, research, and professional development.

Need more help? PsychiatryOnline Customer Service may be reached by emailing [email protected] or by calling 800-368-5777 (in the U.S.) or 703-907-7322 (outside the U.S.).

Media

Figures

Other

Tables

Share

Share

Share article link

Share