
Abstract

Objective:

Animal models suggest that the development of psychosis involves hyperactivity in the hippocampus that drives increased activity in the midbrain and basal ganglia. The authors examined this hypothesis by measuring resting perfusion in the hippocampus, basal ganglia, and midbrain in people at high risk of psychosis.

Method:

Pseudo-continuous arterial spin labeling imaging was used to measure resting regional cerebral blood flow (rCBF) in 52 individuals at ultra-high risk for psychosis and in 27 healthy volunteers. The severity of psychotic symptoms was assessed using the Comprehensive Assessment of At-Risk Mental States. The ultra-high-risk subjects were reassessed after a mean of 17 months, using the same measures as at baseline.

Results:

At baseline, relative to healthy volunteers, ultra-high-risk subjects showed elevated rCBF in the hippocampus, basal ganglia, and midbrain. In the ultra-high-risk sample overall, at follow-up, symptomatic improvement and reduced rCBF in the hippocampus and ventral striatum were observed. Subjects whose symptoms had resolved such that they no longer met ultra-high-risk criteria showed a longitudinal reduction in left hippocampal rCBF that was not evident in subjects who remained in a high-risk state or had become psychotic.

Conclusions:

A high risk for psychosis was associated with increased resting activity in the hippocampus, midbrain, and basal ganglia. Subsequent resolution of the high-risk state was linked to a normalization of activity in these regions. These findings are consistent with animal models that propose that psychotic symptoms may be generated when hippocampal hyperactivity drives hyperactivity in regions involved in subcortical dopamine signaling.
Recent investigations using animal models suggest that the development of psychosis is associated with increased resting activity in the hippocampal region, and that this is linked to an increase in efferent activity in local glutamatergic neurons that project to the basal ganglia and midbrain (1), elevating activity in areas responsible for dopamine signaling (2, 3). Animal models would thus predict that, prior to the onset of psychosis in humans, resting activity may be elevated in the hippocampus, midbrain, and striatum (4). Neuroimaging studies in people at high risk of developing psychosis have yet to explicitly test this hypothesis (4). However, in subjects at high risk for psychosis, the volume of the hippocampal region is reduced (5, 6), local resting blood volume is increased (7), and the hippocampal response to a range of cognitive tasks is altered (8, 9). Furthermore, high-risk subjects also show elevated dopamine function in the midbrain and the striatum (8, 10), as well as a perturbation in the normal relationship between activation in the hippocampus and striatal dopamine function (11).
The first aim of the present study was to test the hypothesis that subjects at ultra-high risk for psychosis would show increased resting state regional cerebral blood flow (rCBF) in the hippocampus, basal ganglia, and midbrain. We measured rCBF, which provides an indirect measure of neuronal function (12), using pseudo-continuous arterial spin labeling (pCASL). Measurements of rCBF show the intimate relationship between neuronal activity and the control of blood supply, a process known as neurovascular coupling (13), and provide an indirect but highly correlated measure of neuronal function (12).
Our second aim was to examine the relationship between rCBF in these regions and longitudinal changes in the severity of psychotic symptoms. There is marked heterogeneity in the clinical course of ultra-high-risk subjects after presentation (14, 15), with a substantial proportion improving to the extent that they no longer meet criteria for an ultra-high-risk state. In other cases the presenting symptoms persist or progress to the extent that there is a first episode of frank psychosis (15). Our second hypothesis was that changes in the severity of psychotic symptoms following presentation would be related to longitudinal changes in the level of resting perfusion in the hippocampus, basal ganglia, and midbrain.

Method

Participants

The study received National Research Ethics Service approval, and all participants gave written informed consent to participate. Seventy-nine subjects (52 subjects at ultra-high risk of psychosis and 27 healthy comparison subjects) participated in the baseline imaging study. Ultra-high-risk subjects were recruited via OASIS (Outreach and Support in South London [16]). The ultra-high-risk diagnosis was made using the Comprehensive Assessment of At-Risk Mental States (CAARMS) (17). Subjects met one or more of the following criteria: attenuated psychotic symptoms; brief, limited, intermittent psychotic symptoms (a history of one or more episodes of frank psychotic symptoms that resolved spontaneously within 1 week in the past year); or a recent decline in function, together with either the presence of schizotypal personality disorder or a family history of psychosis in a first-degree relative. At baseline, seven ultra-high-risk subjects were being treated with low dosages of antipsychotic medication (five were taking quetiapine, one was taking risperidone, and one was taking olanzapine).
Healthy comparison subjects (N=27) were recruited from the local community. Participants who had a history of psychiatric disorders or who were receiving prescription medications were excluded from the study. None of the comparison subjects had a history of neurological illness, or drug or alcohol dependence as specified in DSM-IV. All subjects had an estimated premorbid IQ in the normal range as assessed using the National Adult Reading Test (18). Anxiety was measured with the Hamilton Anxiety Rating Scale (HAM-A) (19), and subjects were asked to provide information on tobacco use (cigarettes per day) and cannabis use (0=no use, 1=experimental use, 2=occasional use, 3=moderate use, 4=severe use). Twelve participants (eight ultra-high-risk subjects and four comparison subjects) who underwent scanning at baseline were left-handed (assessed using the Annett Handedness Scale [20]). The participants’ demographic characteristics are reported in Table 1.
TABLE 1. Participant Demographic, Clinical, and Medication Data at Baselinea
MeasureUltra-High-Risk Group (N=52)Comparison Group (N=27)Analysis
 MeanSDMeanSDStatisticp
Age (years)22.374.424.104.80t=1.850.07
IQ101.7811.4109.7011.10t=2.79<0.01
Years of school11.921.1012.690.74t=2.93<0.01
Years of postsecondary education0.821.502.111.69t=3.53<0.01
Cigarettes per day5.306.902.032.03t=–2.280.02
GAF score57.619.0082.727.50t=12.00<0.01
CAARMS      
 Total score40.0218.001.762.90t=–14.62<0.01
 Positive score7.443.700.260.85t=–12.69<0.01
 Negative score8.484.400.460.90t=–12.00<0.01
HAM-A score11.206.050.550.62t=–8.8<0.01
 N%N%Statisticp
Antipsychotic medicationb713.5    
Male2344.21037.0z=–0.610.54
Right-handed4484.62385.1z=–0.060.94
a
GAF=Global Assessment of Functioning Scale; CAARMS=Comprehensive Assessment of At-Risk Mental States; HAM-A=Hamilton Anxiety Rating Scale. Two participants in the ultra-high-risk group used cannabis, as did one participant in the comparison group.
b
Five participants were taking quetiapine, one was taking risperidone, and one was taking olanzapine.

Follow-Up Imaging and Clinical Assessment

Forty-five subjects (30 ultra-high-risk subjects and 15 comparison subjects) participated in the follow-up study. In ultra-high-risk subjects, follow-up MRI scans occurred on average 16.85 months (SD=4.2 months; range=12–27 months) after their baseline scanning (Table 2). Follow-up clinical assessment data were available for all ultra-high-risk subjects. At follow-up, two ultra-high-risk subjects were treated with low dosages of antipsychotics (both were taking quetiapine). During the follow-up period, two ultra-high-risk subjects made a transition to psychosis, according to CAARMS criteria (17). An additional 16 subjects no longer met criteria for being at ultra-high risk at follow-up (CAARMS positive subscale score of <5).
TABLE 2. Participant Demographic, Clinical, and Medication Data at Follow-Upa
MeasureUltra-High-Risk Baseline Subsample Participating in Follow-Up (N=30)Ultra-High-Risk at Follow-Up (N=30)Analysis (Ultra-High-Risk Baseline Versus Follow-Up)pComparison Subject Follow-Up Subsample (N=15)Analysis
 MeanSDMeanSD  MeanSDStatisticp
Age (years)21.503.6023.103.50  23.875.10t=1.810.07
IQ104.1011.32    110.147.30t=1.820.08
Years of school11.901.20    12.730.7t=2.410.02
Years of postsecondary education0.831.50    1.801.30t=2.080.04
GAF score56.799.6062.2116.40t=–1.780.0881.739.40t=8.21<0.01
CAARMS          
 Total score42.0416.0024.4422.43t=3.9<0.012.003.20t=–12.74<0.01
 Positive score7.563.955.335.10t=2.490.020.471.10t=–9.25<0.01
 Negative score8.673.752.843.59t=6.4<0.010.250.50t=–11.59<0.01
HAM-A score10.87.006.28.80t=3.80.040.510.60t=5.78<0.01
Follow-up duration (months)  16.94.21  15.23.90t=1.20.23
 N%N%  N%Statisticp
Antipsychotic medicationb26.626.6      
Male1550.0    426.6z=–1.480.14
Right-handed2790.0    1386.6z=–0.330.74
Remission at follow-up  1653.3      
Nonremission at follow-up  1446.6      
a
Ultra-high-risk data are compared with baseline data in the subsample that participated in follow-up study (column 1). GAF=Global Assessment of Functioning Scale; CAARMS=Comprehensive Assessment of At-Risk Mental States; HAM-A=Hamilton Anxiety Rating Scale.
b
Two participants were taking quetiapine.

pCASL Protocol and Image Preprocessing

To maximize the correspondence between regional perfusion and neuronal activity, we acquired the pCASL images after a long (1.5 second) postlabeling delay, so as to ensure that the data reflected the component of capillary microcirculation because this is most closely associated with neuronal function (12). pCASL acquisition parameters and pCASL image preprocessing procedures are explained in detail in the data supplement that accompanies the online edition of this article.

Statistical Analysis

To enhance sensitivity, statistical analyses of rCBF data were performed using the “randomise” program implemented within the FMRIB Software Library version 5.0 (http://www.fmrib.ox.ac.uk/fsl). Randomise uses a nonparametric permutation–based approach (21) to infer statistical significance against a null data set generated by random permutation (membership 5,000 times). We tested for significant rCBF group effects in the comparison group and in the ultra-high-risk group at baseline and at the follow-up time points. Voxel-wise whole brain analyses of baseline and follow-up rCBF data are reported in the online data supplement. Regions of interest were specified to assess regional rCBF within the left and right medial hippocampus and subiculum, the putamen, caudate, and pallidum (combined in a “basal ganglia” region of interest), and the midbrain, which were anatomically defined for each subject by subcortical segmentation using the FIRST tool in the FMRIB Software Library (22). Subcortical masks were normalized using the nonlinear normalization parameters from the FMRIB Nonlinear Image Registration Tool (see the online data supplement) and were averaged to create study-specific masks of the hippocampus, basal ganglia, and midbrain.
All statistical comparisons had a threshold of p<0.05 and were corrected using the family-wise error within the threshold-free cluster enhancement (23). Mean rCBF values (mL/100 g/min×10) were extracted from the anatomically defined regions of interest described above, at both baseline and follow-up, to test for group and longitudinal effects (using analysis of covariance [ANCOVA]) and symptom associations using univariate analyses (SPSS, version 21, IBM, Armonk, N.Y.) so that covariates of no interest could be included (see below). As antipsychotic medication is known to affect rCBF (24), supplementary analyses were conducted with the ultra-high-risk subjects receiving antipsychotic medication removed from the ANCOVA.

Covariates.

For all whole-brain and region-of-interest analyses, the following covariates were included in statistical models: age, gender, global rCBF, HAM-A score, and cigarettes per day. For analysis of global rCBF effects, age, gender, HAM-A score, and cigarettes per day were included as covariates in statistical models. HAM-A score was included as a covariate of no interest because it has been shown that anxiety can have systematic effects on CBF (25, 26). Significant results were reported at p<0.05.

Results

Symptoms and rCBF at Baseline

Demographic, clinical, and medication data at baseline are reported in Table 1. The two groups did not differ significantly in gender or handedness, but the comparison subjects were significantly older on average than the ultra-high-risk participants and had a higher mean premorbid IQ. The ultra-high-risk participants smoked more cigarettes and had fewer years of education on average, and they differed from the comparison group on all clinical measures.

Global rCBF at baseline.

At baseline, mean global gray matter rCBF was significantly greater in the ultra-high-risk group relative to the comparison group (53.40, SD=9.80; compared with 49.67, SD=9.32; mL/100 g/min respectively), with age and gender included as covariates (F=4.12, df=78, p=0.04).
This difference remained significant when ultra-high-risk participants receiving antipsychotic medication were removed from the analysis (F=4.67, df=71, p=0.03), but not after HAM-A score and number of cigarettes per day were included as covariates (F=1.48, df=77, p=0.22). Whole brain voxel-wise analysis of baseline rCBF data (comparing the comparison subjects with the ultra-high-risk subjects) is reported in the data supplement.

Regional rCBF at baseline.

Relative to the comparison group, the ultra-high-risk participants showed increased rCBF in the hippocampus, subiculum, putamen, pallidum, and midbrain, bilaterally (Figure 1; see also Table S1 in the data supplement). These differences remained significant after controlling for the effects of global rCBF, age, gender, cigarettes per day, and HAM-A score. There were no significant correlations between regional rCBF at baseline and CAARMS score (p>0.1 for all regions of interest).
FIGURE 1. Increased Resting Perfusion in Ultra-High-Risk Subjects Relative to Healthy Comparison Subjects at Baselinea
a Ultra-high-risk participants showed greater perfusion than comparison subjects in (A) hippocampus, (B) basal ganglia, and (C) midbrain regions of interest (p<0.05 family-wise error). The left side of the brain is shown on the left side of the maps.

Symptoms and rCBF at Follow-Up

Demographic, clinical, and medication data at follow-up are reported in Table 2. Follow-up rCBF scans occurred after a mean of 16.9 months from baseline in the ultra-high-risk group (N=30) and 15.2 months in the comparison group (N=15). The ultra-high-risk and comparison subjects who participated in the follow-up phase did not differ significantly in age, gender, ethnicity, handedness, or premorbid IQ. Across all ultra-high-risk subjects, there was a significant decrease in the CAARMS positive, negative, and total scores relative to the scores at baseline (Table 2). However, within this group, symptomatic outcome was heterogeneous. Sixteen participants no longer met ultra-high-risk criteria at follow-up and were categorized as a symptomatic remission subgroup (ultra-high risk–remission). In contrast, 14 ultra-high-risk subjects still had attenuated psychotic symptoms at follow-up, and the symptoms in two participants had increased to the extent that they had frank psychosis. These subjects were categorized as a nonremission subgroup (ultra-high risk–nonremission; see Table 3).
TABLE 3. Participant Demographic, Clinical, and Medication Data at Follow-Up (Ultra-High-Risk Remission and Nonremission Subgroups)a
MeasureUltra-High-Risk–Remission Subgroup (N=16)Ultra-High-Risk–Nonremission Subgroup (N=14)p
 MeanSDMeanSD 
Age (years)21.43.7921.63.430.92
Follow-up duration (months)17.783.8515.744.450.20
IQ10411103110.70
Years of school12.061.4411.710.990.45
GAF score711153160.01
CAARMS positive score1.51.89.73.8<0.01
HAM-A score10.28.3311.55.560.65
Cigarettes per day4.56.017.28.500.31
 N%N% 
Antipsychotic medication16.217.1 
Male637.5964.20.22
Right-handed1487.51392.80.82
a
GAF=Global Assessment of Functioning Scale; CAARMS=Comprehensive Assessment of At-Risk Mental States; HAM-A=Hamilton Anxiety Rating Scale.

Global gray matter rCBF.

At follow-up there was no significant group difference in global gray matter rCBF (F=0.09, df=44, p=0.76). There was a significant effect of time point for global gray matter rCBF (F=5.09, df=38, p=0.04), with all subjects showing reduced rCBF at follow-up. There also was a significant interaction effect between group and time point (F=3.62, df=38, p=0.03), with subjects in the ultra-high-risk–remission group showing a significant longitudinal reduction in global gray matter rCBF (t=2.7, df=14, p=0.02) that was not evident in either the ultra-high-risk–nonremission group (t=2.0, df=15, p=0.10) or the comparison group (t= 2.1, df=14, p=0.09).

Regional rCBF.

The ultra-high-risk group overall showed a significant reduction in rCBF relative to baseline in the left hippocampus (Figure 2A; see also Table S1 in the online data supplement), in the left putamen/pallidum, and in the caudate bilaterally (Figure 2B; see also Table S1 in the data supplement). In the comparison group, the difference in rCBF between the baseline and follow-up scans was nonsignificant in all regions of interest (see Table S1 in the data supplement). Within the ultra-high-risk group at follow-up, right basal ganglia region-of-interest rCBF was associated with a longitudinal improvement in psychotic symptoms (F=7.60, df=29, p=0.01) (Figure 2C). There was also a significant interaction between the effects of symptomatic outcome subgroup (ultra-high risk–remission compared with ultra-high risk–nonremission) and time point in the left hippocampus (F=4.31, df=25, p=0.04). In this region, the ultra-high-risk–remission subgroup showed a significant longitudinal reduction in rCBF (F= 17.95, df=11, p<0.01) that was not evident in the subjects with persistent symptoms (F=1.6, df=10, p=0.22) (Figure 2D).
FIGURE 2. Differences in rCBF Measurements Between the Ultra-High-Risk and Healthy Comparison Groupsa
a Ultra-high-risk subjects showed a longitudinal reduction in rCBF in the (A) left hippocampal and (B) left and right basal ganglia regions of interest. Panel C shows the association between longitudinal change in positive symptom scores on the Comprehensive Assessment of At-Risk Mental States and left basal ganglia rCBF at follow-up. The plot in panel D shows significant reduction in left hippocampal rCBF in the ultra-high-risk–remission (UHR-R) subgroup compared with the ultra-high-risk–nonremission (UHR-NR) subgroup. Values for rCBF are mL/100 g/min×10.

Discussion

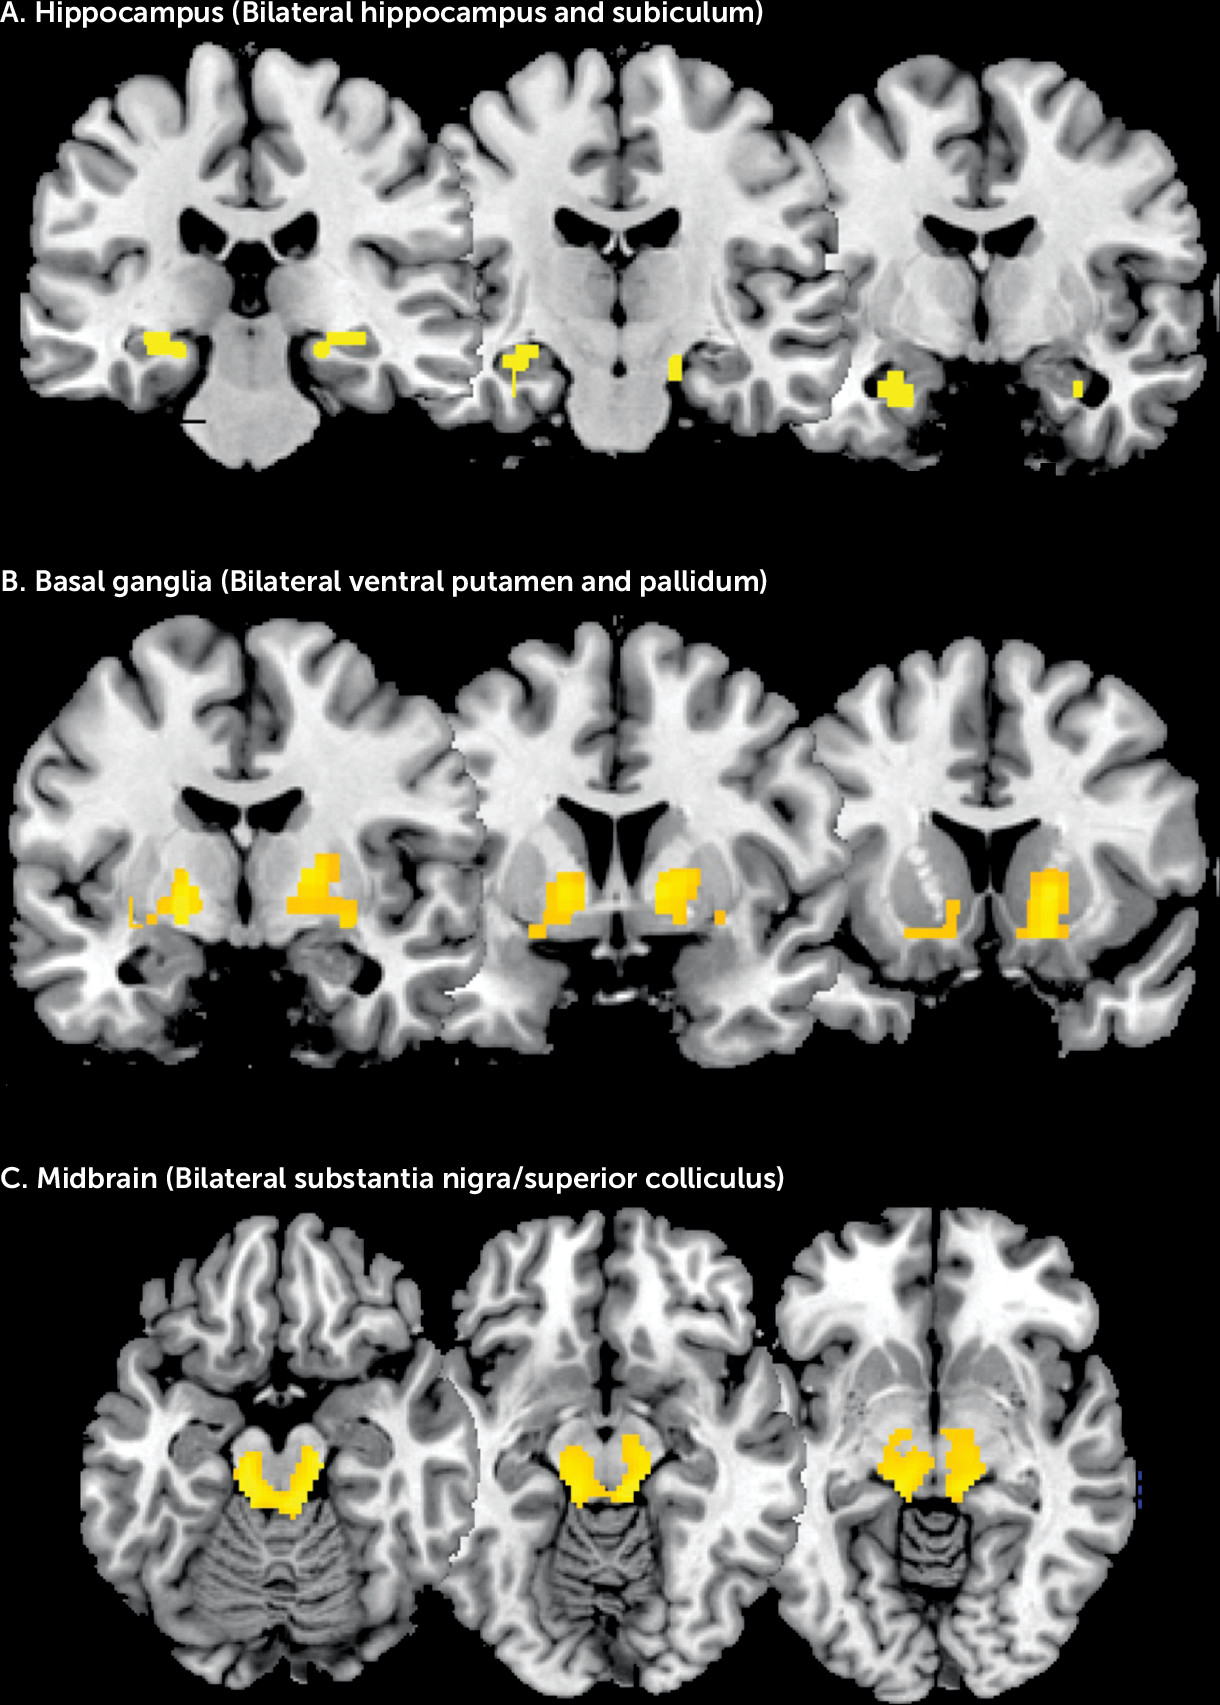
Our first hypothesis was confirmed; in subjects at ultra-high risk for psychosis, rCBF within the hippocampus, basal ganglia, and midbrain was significantly greater than in healthy comparison subjects. Although there were also group differences in global gray matter rCBF, these were not significant after controlling for group differences in anxiety levels and tobacco use (27, 28), while group differences in regional perfusion remained significant after global rCBF and other potentially confounding variables were included as covariates.
Our regional predictions were based on rodent models of psychosis that propose that increased excitatory activity in the hippocampus drives increased subcortical dopamine function through effects on the midbrain and striatum (29). While there is extensive evidence from experimental studies in animals to support this model (4, 2931), relatively few neuroimaging studies have sought to explicitly examine it in humans (4). In the present study, we observed elevated rCBF in the hippocampus and subiculum extending to the anterior hippocampus, the ventral putamen and pallidum, and the part of the midbrain that includes the substantia nigra. This regional distribution of increased perfusion corresponds to the network of areas implicated in animal models of psychosis (3, 8, 32). Regions within this putative network have also been identified in previous neuroimaging studies of ultra-high-risk subjects as sites of reduced gray matter volume (6), increased resting blood volume (33), and altered activation during cognitive tasks (8, 9), while dopamine function has been found to be elevated in the midbrain and striatum (34).
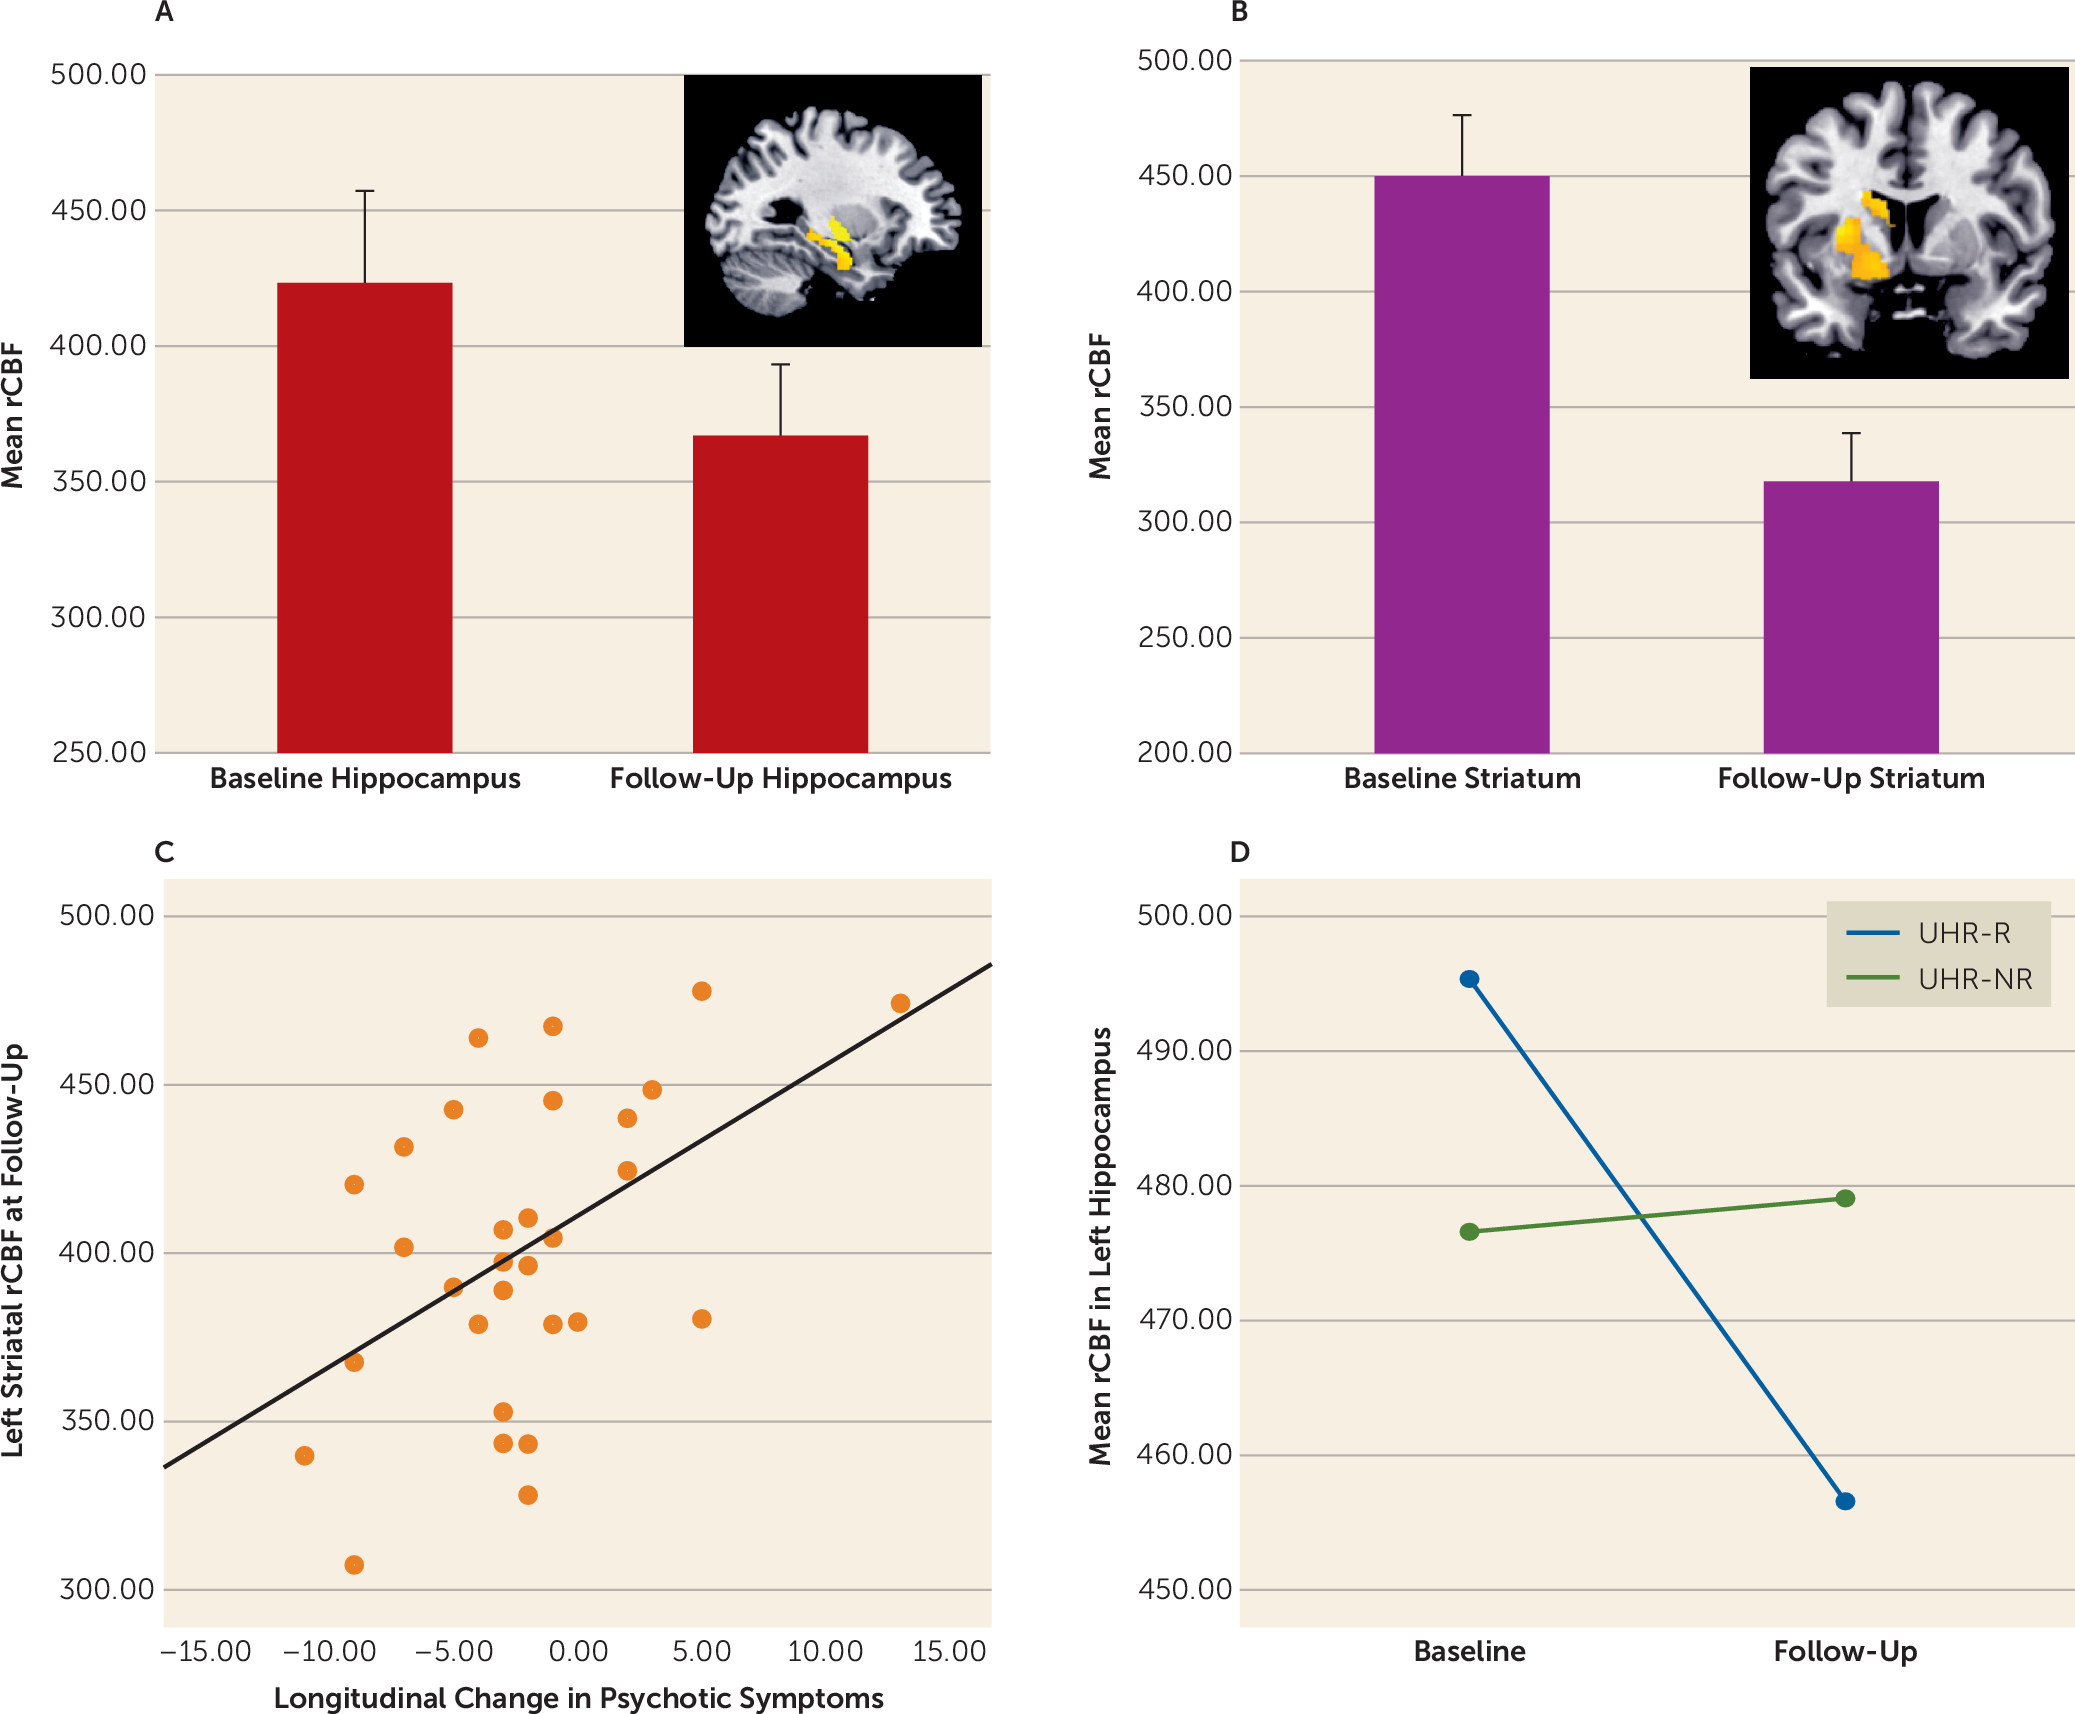
Our second prediction was that changes in the severity of psychotic symptoms in ultra-high-risk subjects following clinical presentation would be related to longitudinal changes in rCBF in the same subjects. The ultra-high-risk sample as a whole showed a symptomatic improvement, along with a concurrent longitudinal reduction in rCBF in the hippocampus and caudate bilaterally and in the left putamen. This is consistent with evidence that increased activity in subcortical areas involved in dopaminergic signaling underlies the generation of psychotic symptoms (29). More interestingly, although the overall severity of symptoms in the ultra-high-risk group improved, the pattern of symptomatic change within the sample was markedly heterogeneous; in about half of those followed up, there was a reduction in symptoms such that they no longer met criteria for an ultra-high-risk state (i.e., they were in remission). In contrast, the symptoms in the other half of this group either persisted or worsened, in some cases to the point where they became frankly psychotic. Comparison of these two subgroups revealed that there was a greater longitudinal reduction in hippocampal rCBF in those who entered remission than in those who did not. This finding is in line with previous neuroimaging data linking alterations in medial temporal structure and function with an adverse clinical outcome in high-risk subjects (5, 6, 8).
Previous ASL and positron emission tomography studies of resting perfusion in schizophrenia have also described elevated rCBF in striatal (3537), midbrain, and hippocampal (38) regions, although this has often been accompanied by cortical reductions in rCBF, particularly in the prefrontal cortex. In the present study, a supplementary analysis (see the online data supplement) revealed increased, rather than decreased, prefrontal cortex rCBF in ultra-high-risk subjects relative to comparison subjects. Indeed, we did not find reductions in rCBF in any region in our ultra-high-risk sample. This contrast with findings of reduced resting prefrontal cortex perfusion in established schizophrenia raises the possibility that reduced prefrontal cortex rCBF may become evident after the onset of the illness, perhaps as an effect of treatment and/or as pathological mechanisms associated with chronicity.
Although our longitudinal analyses focused on comparisons between subgroups of ultra-high-risk subjects who did and did not show symptomatic improvement, there was also a significant reduction in attenuated positive, negative, and total symptoms in the ultra-high-risk sample overall. This suggests that the normalization of rCBF following presentation may be related to a longitudinal reduction in symptom severity. The basis of widespread cortical and subcortical hyperperfusion at baseline is beyond the scope of the present study, but previous work in both experimental animals and ultra-high-risk subjects suggests that this may reflect perturbations in cortical GABA and glutamate function (1, 4, 33, 39). Although speculative, it is possible that global hyperperfusion is seen in ultra-high-risk cases but that the hypoperfusion abnormalities seen in established schizophrenia are the consequence of excitotoxic effects due to continual cortical disinhibition (33). This prediction could be examined in longitudinal multimodal neuroimaging studies in ultra-high-risk cohorts.

Potential Limitations

Most of our ultra-high-risk subjects were medication-naive, but a minority (seven of 52) had been treated with low dosages of antipsychotic drugs, which could have altered the severity of psychotic symptoms and rCBF (24). However, the number of medicated subjects was small, and they were equally distributed between the two ultra-high-risk subgroups with different clinical outcomes. Moreover, supplementary analyses showed that the findings remained significant after exclusion of the ultra-high-risk subjects who had received antipsychotic medication. The proportion of the ultra-high-risk sample who developed a first episode of psychosis during follow-up was small. However, the mean follow-up period was 17 months, and most transitions to psychosis occur within the first 36 months (40), and some even later (41). Thus, it is possible that more subjects in the present sample will develop psychosis as the follow-up period is extended.

Conclusions

People at high risk for psychosis have increased resting perfusion in the hippocampus, midbrain, and striatum, and symptomatic remission in this group is associated with a normalization of perfusion in these regions. The findings are consistent with animal models that propose that psychotic symptoms develop as a consequence of hyperactivity in the hippocampus and striatum.

Acknowledgments

The authors thank members of the Outreach and Support in South London (OASIS) team who were involved in the recruitment, management, and clinical follow-up of the ultra-high-risk subjects who participated in this study.

Supplementary Material

File (appi.ajp.2015.15040485.ds001.pdf)

References

1.
Marin O: Interneuron dysfunction in psychiatric disorders. Nat Rev Neurosci 2012; 13:107–120
2.
Lodge DJ, Grace AA: Aberrant hippocampal activity underlies the dopamine dysregulation in an animal model of schizophrenia. J Neurosci 2007; 27:11424–11430
3.
Lodge DJ, Grace AA: Hippocampal dysregulation of dopamine system function and the pathophysiology of schizophrenia. Trends Pharmacol Sci 2011; 32:507–513
4.
Modinos G, Allen P, Grace AA, et al: Translating the MAM model of psychosis to humans. Trends Neurosci 2015; 38:129–138
5.
Pantelis C, Velakoulis D, McGorry PD, et al: Neuroanatomical abnormalities before and after onset of psychosis: a cross-sectional and longitudinal MRI comparison. Lancet 2003; 361:281–288
6.
Mechelli A, Riecher-Rossler A, Meisenzahl EM, et al: Neuroanatomical abnormalities that predate the onset of psychosis: a multicenter study. Arch Gen Psychiatry 2011; 68:489–495
7.
Schobel SA, Lewandowski NM, Corcoran CM, et al: Differential targeting of the CA1 subfield of the hippocampal formation by schizophrenia and related psychotic disorders. Arch Gen Psychiatry 2009; 66:938–946
8.
Allen P, Luigjes J, Howes OD, et al: Transition to psychosis associated with prefrontal and subcortical dysfunction in ultra high-risk individuals. Schizophr Bull 2012; 38:1268–1276
9.
Allen P, Seal ML, Valli I, et al: Altered prefrontal and hippocampal function during verbal encoding and recognition in people with prodromal symptoms of psychosis. Schizophr Bull 2011; 37:746–756
10.
Howes OD, Bose SK, Turkheimer F, et al: Dopamine synthesis capacity before onset of psychosis: a prospective [18F]-DOPA PET imaging study. Am J Psychiatry 2011; 168:1311–1317
11.
Valli I, Stone J, Mechelli A, et al: Altered medial temporal activation related to local glutamate levels in subjects with prodromal signs of psychosis. Biol Psychiatry 2011; 69:97–99
12.
Hirano Y, Stefanovic B, Silva AC: Spatiotemporal evolution of the functional magnetic resonance imaging response to ultrashort stimuli. J Neurosci 2011; 31:1440–1447
13.
Attwell D, Buchan AM, Charpak S, et al: Glial and neuronal control of brain blood flow. Nature 2010; 468:232–243
14.
McGlashan TH, Miller TJ, Woods SW: Pre-onset detection and intervention research in schizophrenia psychoses: current estimates of benefit and risk. Schizophr Bull 2001; 27:563–570
15.
Velthorst E, Nieman DH, Klaassen RM, et al: Three-year course of clinical symptomatology in young people at ultra high risk for transition to psychosis. Acta Psychiatr Scand 2011; 123:36–42
16.
Fusar-Poli P, Byrne M, Badger S, et al: Outreach and support in south London (OASIS), 2001-2011: ten years of early diagnosis and treatment for young individuals at high clinical risk for psychosis. Eur Psychiatry 2013; 28:315–326
17.
Yung AR, Phillips LJ, McGorry PD, et al: Prediction of psychosis. A step towards indicated prevention of schizophrenia. Br J Psychiatry Suppl 1998; 172:14–20
18.
Nelson HE: National Adult Reading Scale, 2nd ed. Berkshire, England, NART, 1991
19.
Hamilton M: The assessment of anxiety states by rating. Br J Med Psychol 1959; 32:50–55
20.
Coren S: Measurement of handedness via self-report: the relationship between brief and extended inventories. Percept Mot Skills 1993; 76:1035–1042
21.
Nichols TE, Holmes AP: Nonparametric permutation tests for functional neuroimaging: a primer with examples. Hum Brain Mapp 2002; 15:1–25
22.
Patenaude B, Smith SM, Kennedy DN, et al: A Bayesian model of shape and appearance for subcortical brain segmentation. Neuroimage 2011; 56:907–922
23.
Smith SM, Nichols TE: Threshold-free cluster enhancement: addressing problems of smoothing, threshold dependence and localisation in cluster inference. Neuroimage 2009; 44:83–98
24.
Handley R, Zelaya FO, Reinders AA, et al: Acute effects of single-dose aripiprazole and haloperidol on resting cerebral blood flow (rCBF) in the human brain. Hum Brain Mapp 2013; 34:272–282
25.
Gur RC, Gur RE, Resnick SM, et al: The effect of anxiety on cortical cerebral blood flow and metabolism. J Cereb Blood Flow Metab 1987; 7:173–177
26.
Mathew RJ, Wilson WH, Humphreys D, et al: Cerebral vasodilation and vasoconstriction associated with acute anxiety. Biol Psychiatry 1997; 41:782–795
27.
Freeman D, Garety PA: Connecting neurosis and psychosis: the direct influence of emotion on delusions and hallucinations. Behav Res Ther 2003; 41:923–947
28.
Myles N, Newall HD, Curtis J, et al: Tobacco use before, at, and after first-episode psychosis: a systematic meta-analysis. J Clin Psychiatry 2012; 73:468–475
29.
Lodge DJ, Grace AA: Hippocampal dysregulation of dopamine system function and the pathophysiology of schizophrenia. Trends Pharmacol Sci 2011; 32:507–513
30.
Moore H, Jentsch JD, Ghajarnia M, et al: A neurobehavioral systems analysis of adult rats exposed to methylazoxymethanol acetate on E17: implications for the neuropathology of schizophrenia. Biol Psychiatry 2006; 60:253–264
31.
Marin O, Rico B: A new beginning for a broken mind: balancing neuregulin 1 reverses synaptic dysfunction. Neuron 2013; 78:577–579
32.
Egerton A, Chaddock CA, Winton-Brown TT, et al: Presynaptic striatal dopamine dysfunction in people at ultra-high risk for psychosis: findings in a second cohort. Biol Psychiatry 2013; 74:106–112
33.
Schobel SA, Chaudhury NH, Khan UA, et al: Imaging patients with psychosis and a mouse model establishes a spreading pattern of hippocampal dysfunction and implicates glutamate as a driver. Neuron 2013; 78:81–93
34.
Howes OD, Williams M, Ibrahim K, et al: Midbrain dopamine function in schizophrenia and depression: a post-mortem and positron emission tomographic imaging study. Brain 2013; 136:3242–3251
35.
Pinkham A, Loughead J, Ruparel K, et al: Resting quantitative cerebral blood flow in schizophrenia measured by pulsed arterial spin labeling perfusion MRI. Psychiatry Res 2011; 194:64–72
36.
Walther S, Federspiel A, Horn H, et al: Resting state cerebral blood flow and objective motor activity reveal basal ganglia dysfunction in schizophrenia. Psychiatry Res 2011; 192:117–124
37.
Kindler J, Jann K, Homan P, et al: Static and dynamic characteristics of cerebral blood flow during the resting state in schizophrenia. Schizophr Bull 2015; 41:163–170
38.
Scheef L, Manka C, Daamen M, et al: Resting-state perfusion in nonmedicated schizophrenic patients: a continuous arterial spin-labeling 3.0-T MR study. Radiology 2010; 256:253–260
39.
Lisman JE, Coyle JT, Green RW, et al: Circuit-based framework for understanding neurotransmitter and risk gene interactions in schizophrenia. Trends Neurosci 2008; 31:234–242
40.
Fusar-Poli P, Bonoldi I, Yung AR, et al: Predicting psychosis: meta-analysis of transition outcomes in individuals at high clinical risk. Arch Gen Psychiatry 2012; 69:220–229
41.
Lin A, Wood SJ, Nelson B, et al: Neurocognitive predictors of functional outcome two to 13 years after identification as ultra-high risk for psychosis. Schizophr Res 2011; 132:1–7

Information & Authors

Information

Published In

Go to American Journal of Psychiatry
American Journal of Psychiatry
Pages: 392 - 399
PubMed: 26684922

History

Received: 16 April 2015
Revision received: 21 August 2015
Accepted: 30 September 2015
Published online: 18 December 2015
Published in print: April 01, 2016

Authors

Affiliations

Paul Allen, Ph.D.
From the Departments of Psychosis Studies and of Neuroimaging, Institute of Psychiatry, Psychology and Neuroscience, King’s College London; and the Department of Psychology, University of Roehampton, London.
Christopher A. Chaddock, Ph.D.
From the Departments of Psychosis Studies and of Neuroimaging, Institute of Psychiatry, Psychology and Neuroscience, King’s College London; and the Department of Psychology, University of Roehampton, London.
Alice Egerton, Ph.D.
From the Departments of Psychosis Studies and of Neuroimaging, Institute of Psychiatry, Psychology and Neuroscience, King’s College London; and the Department of Psychology, University of Roehampton, London.
Oliver D. Howes, M.D., Ph.D.
From the Departments of Psychosis Studies and of Neuroimaging, Institute of Psychiatry, Psychology and Neuroscience, King’s College London; and the Department of Psychology, University of Roehampton, London.
Ilaria Bonoldi, M.D.
From the Departments of Psychosis Studies and of Neuroimaging, Institute of Psychiatry, Psychology and Neuroscience, King’s College London; and the Department of Psychology, University of Roehampton, London.
Fernando Zelaya, Ph.D.
From the Departments of Psychosis Studies and of Neuroimaging, Institute of Psychiatry, Psychology and Neuroscience, King’s College London; and the Department of Psychology, University of Roehampton, London.
Sagnik Bhattacharyya, M.D., Ph.D.
From the Departments of Psychosis Studies and of Neuroimaging, Institute of Psychiatry, Psychology and Neuroscience, King’s College London; and the Department of Psychology, University of Roehampton, London.
Robin Murray, M.D.
From the Departments of Psychosis Studies and of Neuroimaging, Institute of Psychiatry, Psychology and Neuroscience, King’s College London; and the Department of Psychology, University of Roehampton, London.
Philip McGuire, M.D., Ph.D.
From the Departments of Psychosis Studies and of Neuroimaging, Institute of Psychiatry, Psychology and Neuroscience, King’s College London; and the Department of Psychology, University of Roehampton, London.

Notes

Address correspondence to Dr. Allen ([email protected]).

Author Contributions

Dr. Allen, Dr. Chaddock, and Dr. Egerton contributed equally to this article.

Competing Interests

Dr. Egerton has received consulting fees from Heptares Therapeutics and research funding from Hoffman-La Roche. Dr. Howes has received investigator-initiated research funding from, participated in advisory roles for, and spoken at meetings organized by AstraZeneca, Autifony, Bristol-Myers Squibb, Eli Lilly, Hoffman-La Roche, Janssen, Leyden-Delta, Lundbeck, Otsuka, Servier, and Sunovion. Dr. Murray has served on an advisory board for Sunovion and has received honoraria for lectures from AstraZeneca, Eli Lilly, Janssen, Lundbeck, Otsuka, and Roche. Dr. McGuire has received consulting fees from Hoffman-La Roche and Sunovion. The other authors report no financial relationships with commercial interests.

Funding Information

Medical Research Council UK: G0700995
Supported by Medical Research Council-UK (MC-A656-5QD30 and G0700995), Maudsley Charity (666), and Wellcome Trust (094849/Z/10/Z) grants to Dr. Howes, by the National Institute for Health Research Biomedical Research Centre at South London and Maudsley NHS Foundation Trust, and by King’s College London.

Metrics & Citations

Metrics

Citations

Export Citations

If you have the appropriate software installed, you can download article citation data to the citation manager of your choice. Simply select your manager software from the list below and click Download.

For more information or tips please see 'Downloading to a citation manager' in the Help menu.

Format
Citation style
Style
Copy to clipboard

There are no citations for this item

View Options

View options

PDF/ePub

View PDF/ePub

Get Access

Login options

Already a subscriber? Access your subscription through your login credentials or your institution for full access to this article.

Personal login Institutional Login Open Athens login
Purchase Options

Purchase this article to access the full text.

PPV Articles - American Journal of Psychiatry

PPV Articles - American Journal of Psychiatry

Not a subscriber?

Subscribe Now / Learn More

PsychiatryOnline subscription options offer access to the DSM-5-TR® library, books, journals, CME, and patient resources. This all-in-one virtual library provides psychiatrists and mental health professionals with key resources for diagnosis, treatment, research, and professional development.

Need more help? PsychiatryOnline Customer Service may be reached by emailing [email protected] or by calling 800-368-5777 (in the U.S.) or 703-907-7322 (outside the U.S.).

Media

Figures

Other

Tables

Share

Share

Share article link

Share