With some exceptions (
1,
2), there is accumulating evidence showing that late-life depression is associated with smaller hippocampal volume (
3–
9). However, there is considerable debate about its etiology. The leading hypotheses are the depression-as-late-life-neuropsychiatric-disorder model (
7,
9,
10) and the stress model (
11).
The neuropsychiatric model proposes that hippocampal volume loss in late-life depression is caused by age-related neurodegenerative or other pathological brain changes (
9). It has been repeatedly shown that in a significant proportion of patients, late-life depression precedes the onset of dementia, particularly Alzheimer’s disease (
12), which is itself associated with hippocampal atrophy. Correspondingly, hippocampal volume decrease has been associated with later dementia (
10) and continuing memory deficits during follow-up (
4). Most studies document greater volume loss in late-onset compared with early-onset depression, and specific volume changes in hippocampal subfields involved in Alzheimer’s disease have been demonstrated in late-onset depression (
5). Neuropathological studies show Alzheimer-type pathology in the majority of patients with a diagnosis of late-life depression who subsequently develop dementia (
13), as well as a disproportionate amount of neuritic plaques and neurofibrillary tangles in the hippocampus of patients with Alzheimer’s disease and a history of depression (
14). However, a neuropathological study in late-life depression without dementia (
15) documented hippocampal neuronal loss in the absence of Alzheimer-type or cerebrovascular pathology, suggesting an alternative cause of hippocampal volume loss. Furthermore, in a clinical-pathological cohort study (
16), depressive symptoms were associated with cognitive decline independently of neuropathological hallmarks of dementia.
The main alternative to the neuropsychiatric model is the stress hypothesis, which posits that stress-related mechanisms, including toxicity by elevated cortisol levels, reduced neurotrophic factors, and excess glutamatergic neurotransmission, have detrimental effects on the hippocampus, causing volume decrease (
17). Support for this hypothesis comes from studies linking a longer duration of depression to smaller hippocampal volumes (
18,
19) and from population-based studies showing that depression precedes hippocampal volume decrease (
20). Accordingly, one would expect that chronic stress throughout the lifespan would have a cumulative pathological effect on the hippocampus, causing disproportionate volume decrease in the elderly, especially those with an early-onset depression. Although some reports support this prediction (
6,
21), the majority find more hippocampal atrophy in late-onset depression (
3,
5,
7) or fail to find an effect of illness onset (
8). On the other hand, there is increasing evidence that early life stress in genetically predisposed individuals may contribute to hippocampal volume loss before illness onset (
17) and that lower hippocampal volume increases vulnerability to psychological trauma and depression (
22,
23).
The stress model and the depression-as-late-life-neuropsychiatric-disorder model are not mutually exclusive and may act synergistically. It has repeatedly been shown that depression increases the risk of developing Alzheimer’s disease later in life (
24). Studies in animal models of Alzheimer’s disease show that chronic stress accelerates amyloid deposition in mice (
25). There may also be a common genetic predisposition for the adverse effects of stress and the development of Alzheimer’s disease. For instance, gene-environment interaction studies indicate that apolipoprotein E (APOE) ε4 carriers are more vulnerable to the adverse effects of prolonged stress on cognitive aging (
26).
Thus far, support for the depression-as-late-life-neuropsychiatric-disorder model comes mainly from longitudinal studies in which often considerable time elapsed between the depression and incident dementia or neuropathological examination. Hence, based on the available evidence, it remains difficult to determine whether hippocampal atrophy in late-life depression represents an early sign of Alzheimer’s disease or is due to another cause. With the advent of positron emission tomography (PET) amyloid imaging, it has become possible to detect preclinical Alzheimer’s disease pathology in vivo (
27,
28). Amyloid PET imaging has been used to study whether a history of depression in the elderly (
29,
30) or varying degrees of cognitive impairment in late-life depression (
31) are associated with amyloid pathology, yielding mixed results. However, the relationship between hippocampal volume and amyloid load has not yet been addressed in individuals who are depressed at the time of assessment. In this study, we investigated prospectively whether hippocampal volume in elderly patients with a current diagnosis of major depressive disorder was related to brain amyloid levels as measured by [
18F]flutemetamol PET.
Method
Participants
Patients with late-life depression.
A consecutive series of 55 patients with late-life depression was recruited from the Department of Old Age Psychiatry of the University Psychiatric Center, KU Leuven, Belgium. Ultimately, 51 of these patients participated in the study (two withdrew, one was excluded because of a large intracerebral vascular lesion, and one was excluded because of a technical difficulty during PET scanning). To be included, patients had to be over age 60, have major depressive disorder according to DSM-IV criteria, and not have been primarily referred for assessment of cognitive impairment. Exclusion criteria were comorbid major psychiatric illness, previous or current alcohol or drug dependence, neurological illness (including stroke, transient ischemic attacks, and dementia), illness or medication precluding cognitive testing, metal implants precluding MRI scanning, and ECT in the past 6 months.
Healthy comparison subjects.
We included 53 age- and gender-matched comparison subjects who had no current or prior depressive illness or cognitive impairment, as determined by formal clinical and neuropsychological assessment (details below). Exclusion criteria were the same as for the patient group. Part of this cohort (N=46) was recruited from a larger [
18F]flutemetamol study conducted at our center (
32). This subset fulfilled additional inclusion criteria: they had a Clinical Dementia Rating score of 0 and Mini-Mental State Examination (MMSE) score >26, and they were stratified for APOE ε4 allele. The APOE ε4 status of the stratified comparison subjects did not differ from those of the patient group or the nonstratified comparison group. Recruitment was done through an existing departmental database and advertisement in a local newspaper.
All participants were genotyped to determine APOE status and provided written informed consent prior to enrollment in the study in accordance with the Declaration of Helsinki. The study was approved by the ethical committee of the University Hospitals Leuven (protocol S52151) and registered as a clinical trial (EudraCT Number 2009-018064-95).
Assessment of Mood and Cognition
The diagnostic status of patients and comparison subjects was assessed using the Structured Clinical Interview for DSM-IV Axis I Disorders. We used the Geriatric Depression Scale to score depression severity and the MMSE for global cognition. An extensive neuropsychological examination including the Rey Auditory Verbal Learning Test was used to study the association between episodic memory and the imaging measures. Other neuropsychological tests are listed in the data supplement that accompanies the online edition of this article.
Structural MRI
Acquisition.
High-resolution T1-weighted images were acquired on a 3-T Philips Intera scanner (Best, the Netherlands) with an eight-channel head coil using a three-dimensional turbo field echo sequence (TR=9.6 seconds, TE=4.6 seconds, flip angle=8°, in-plane voxel size=0.98×0.98×1.2 mm3, 182 slices). Because the scanner was decommissioned during the study, 19 of the comparison subjects underwent scanning with identical sequence parameters on a 3-T Philips Achieva scanner.
Hippocampal volume measurement.
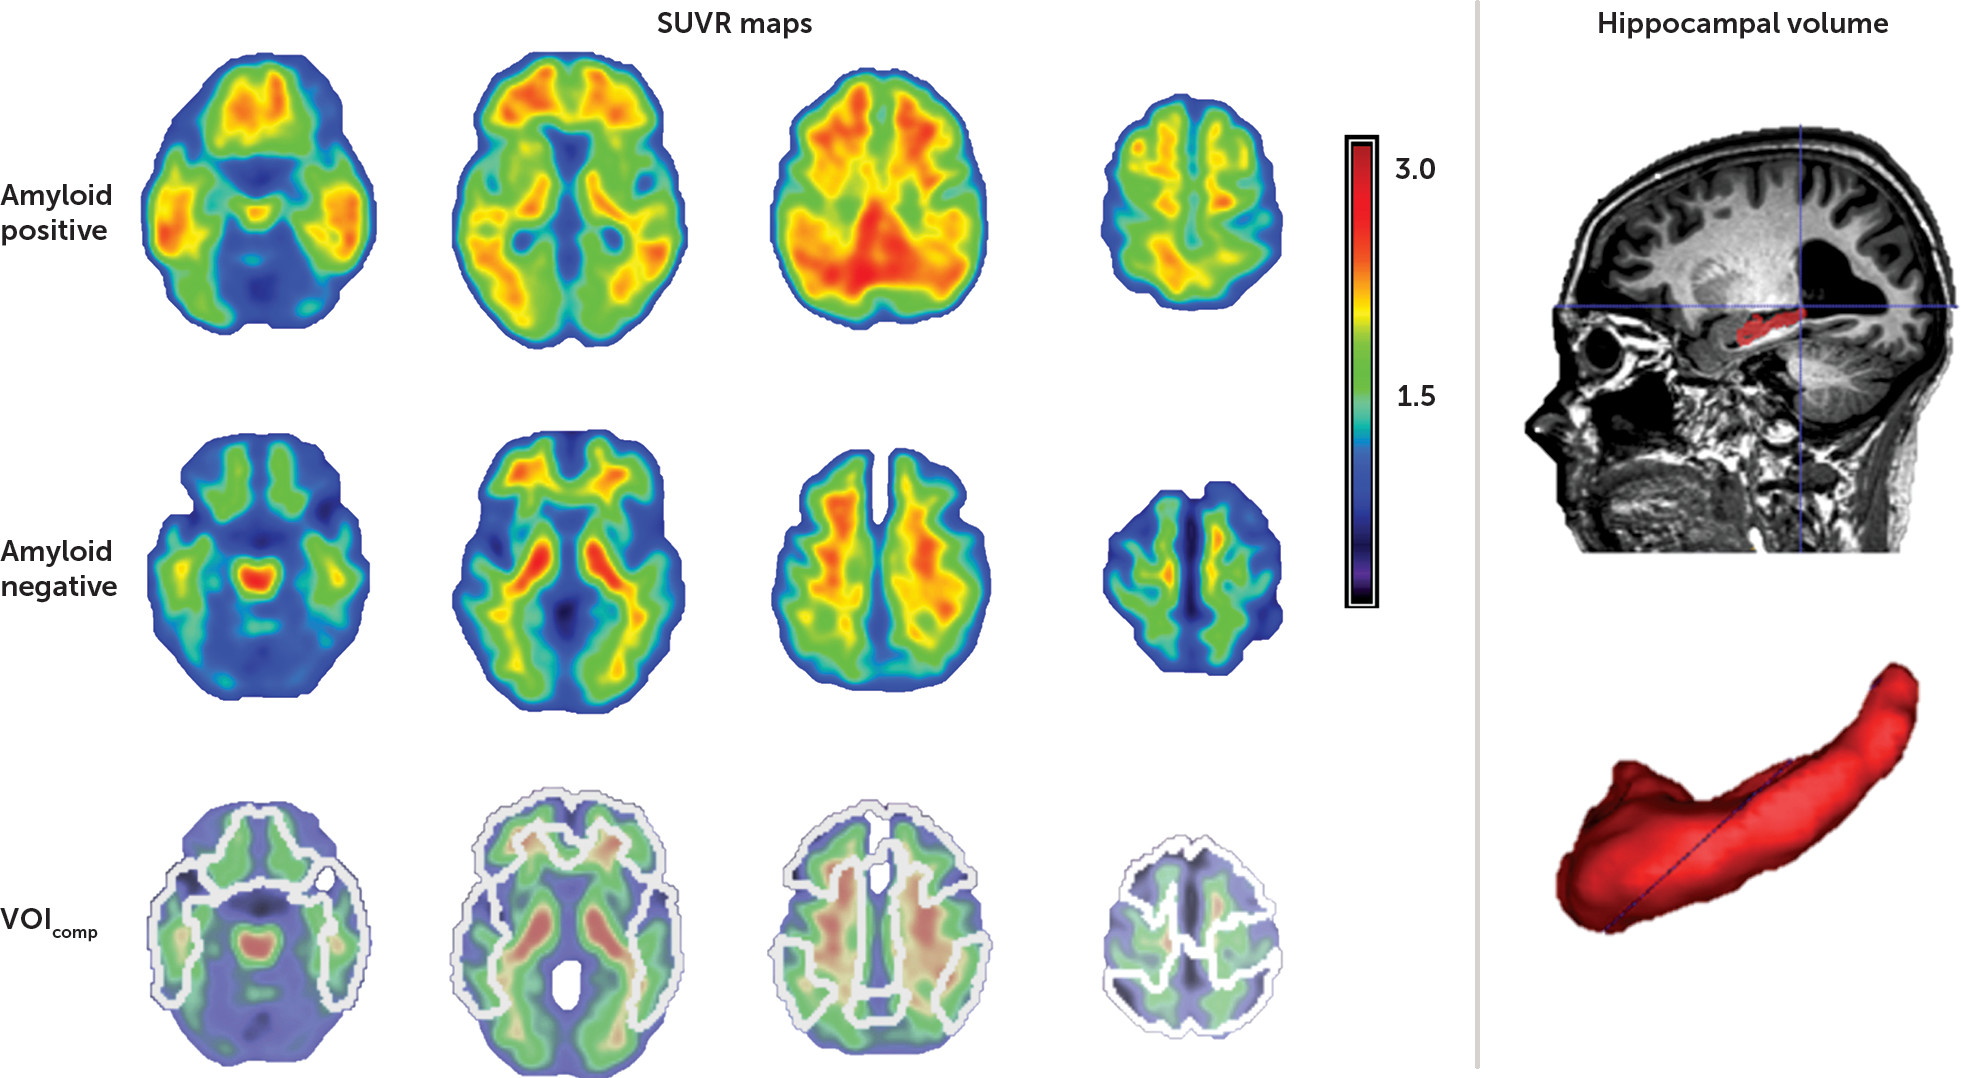
Hippocampal volumes were defined manually in native space after an initial automatic segmentation step based on that described by Jain et al. (
33), using training labels based on the Harmonized Protocol (
34). Manual editing was performed by a single trained rater blind to participant diagnosis, using ITK-SNAP (
http://www.itksnap.org/pmwiki/pmwiki.php) in accordance with the Harmonized Protocol guidelines (
34) (
Figure 1). Hippocampal volumes were normalized using the linear regression coefficient obtained by regressing total brain volume with gray matter volume, entered into the following equation: normalized hippocampal volume = original hippocampal volume − coefficient × (total intracranial volume − mean total intracranial volume) (
34). Total intracranial volume was obtained from an automated segmentation of gray matter, white matter, and CSF (
35). Intrarater reliability was determined using randomly selected scans delineated twice, at least 1 month apart. The intraclass correlation coefficient (Cronbach’s alpha) was 0.96 for the left hippocampus and 0.95 for the right hippocampus.
White matter hyperintensities.
Given the association between late-life depression and white matter disease, we also quantified total white matter hyperintensity volume using a validated automatic segmentation approach (
35). T
1 and fluid-attenuated inversion recovery (FLAIR) data were combined in a probabilistic model in which white matter hyperintense lesions are detected as outliers when segmenting brain tissue into gray matter, white matter, and CSF compartments. White matter hyperintensity volume was normalized for total intracranial volume.
Amyloid Imaging
Acquisition.
[
18F]Flutemetamol PET imaging was performed at the University Hospitals Leuven, as described previously (
28,
36). Images were acquired on a 16-slice Siemens Biograph PET/CT scanner (Siemens, Erlangen, Germany). The tracer was injected intravenously as a bolus (mean activity, 149.5 MBq, SD=4.7, range=139–159) in an antecubital vein. Image acquisition started 90 minutes after tracer injection and lasted for 30 minutes in list mode. Prior to the PET scan, a low-dose CT scan was performed for attenuation correction. Random and scatter corrections were also applied. Images were reconstructed to six frames of 5 minutes, using an ordered subsets expectation maximization algorithm (4 iterations × 16 subsets).
Processing.
All reconstructed images were analyzed using SPM8 (Wellcome Trust Centre for Neuroimaging, University College London) in the MATLAB environment (MathWorks, Natick, Mass.). All six PET frames were realigned to the first frame to correct for potential head motion. Subsequently, the realigned frames were summed to create one PET summed image. Individual T
1-weighted MRI images were coregistered to this PET summed image. These MRI images were then normalized to Montreal Neurological Institute space, after which the normalization matrix was applied to the coregistered PET summed images. Standardized uptake value ratio (SUVR) images were calculated from the normalized PET summed image using cerebellar gray matter as reference region. The cerebellar gray matter volume of interest was derived from the Automated Anatomical Labeling Atlas (AAL) (
36) and was masked with the normalized subject-specific segmented gray matter map to exclude white matter content.
The mean SUVR value was calculated in five bilateral volumes of interest derived from the AAL atlas: lateral frontal, parietal, and temporal cortex and anterior and posterior cingulate cortex (
Figure 1). A composite cortical SUVR value (SUVR
comp) was calculated by averaging across these five volumes of interest. As with the cerebellar gray matter volume of interest, cortical volumes of interest were masked by the normalized subject-specific gray matter map (
36). A SUVR
comp threshold of 1.38 was used to discriminate between a positive and a negative amyloid scan, as this threshold was recently determined as the most appropriate for our gray matter-based analytic methodology (
36).
Statistical Analysis
Our primary goal was to study whether hippocampal volume was related to amyloid deposition in late-life depression. After data quality control procedures, 48 of 51 patients and 52 of 53 comparison subjects had both suitable PET and hippocampal volume data available for analysis (MRI data sets for three patients and one comparison subject were excluded because of motion artifacts). All analyses were performed using IBM SPSS Statistics, version 23 (IBM, Armonk, N.Y.).
Group differences in hippocampal volume and amyloid binding.
We compared total hippocampal volume and SUVRcomp between patients with late-life depression and comparison subjects using a two-sample t test and a nonparametric Mann-Whitney U test, respectively (as SUVRs were nonnormally distributed). We assessed the proportion of positive to negative amyloid scans between groups using the predefined SUVRcomp threshold. To investigate hippocampal volume changes in the depression group relative to comparison subjects with subthreshold amyloid binding, we repeated these analyses excluding the amyloid-positive subjects in both groups. In addition, we ran an analysis of variance (ANOVA) to test for an interaction between depression diagnosis and amyloid status in the whole sample. Finally, we investigated differences in the association between amyloid binding, hippocampal volume, and white matter hyperintensity volume in patients and comparison subjects using both Spearman correlations and partial correlations (Pearson) controlling for age.
To examine an association with APOE genotype, we performed a multivariate analysis of covariance (MANCOVA) with hippocampal volume and SUVRcomp as dependent variables and APOE genotype (ε4 carrier status) and depression diagnosis as fixed factors.
Secondary analyses in patients.
To investigate any associations between regional amyloid binding in each cortical volume of interest and hippocampal volume, we used Spearman correlations and partial correlations controlling for age. To control for multiple comparisons, a Bonferroni correction was applied such that p values <0.01 were considered statistically significant (alpha=0.05/5 volumes of interest).
To examine potential associations between clinically relevant factors, hippocampal volume, and amyloid binding, we performed a series of exploratory MANCOVA analyses. These included 1) late versus early onset of depression (i.e., after or before age 55, respectively), 2) the presence of psychotic features, and 3) episodic memory performance (Rey Auditory Verbal Learning Test total learning score, delayed recall, and recognition [i.e., recognition minus false positives]). In all analyses, total hippocampal volume and SUVRcomp were dependent variables, and age was included as a covariate. To account for possible violations of the assumption of normality for SUVRcomp, we performed bootstrapping (1,000 samples) to assess the results. To control for multiple comparisons, p values <0.01 were considered statistically significant (alpha=0.05/5 MANCOVA analyses).
Results
Hippocampal volume was normally distributed, whereas SUVR
comp values were not. Participants’ demographic characteristics, APOE genotype, cognitive and clinical characteristics, and imaging data are summarized in
Table 1.
Group Differences in Hippocampal Volume and Amyloid Binding
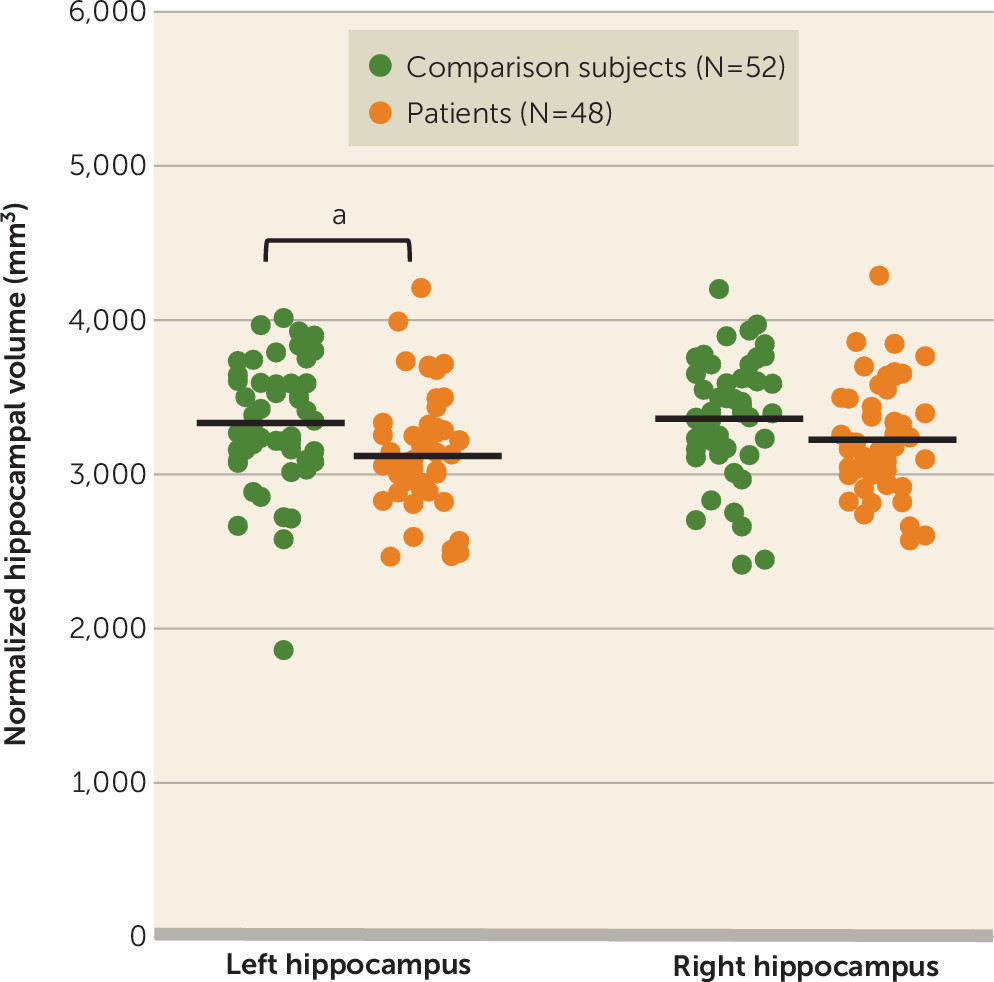
Mean normalized total hippocampal volume was significantly lower in patients relative to comparison subjects (t=2.218, df=98, p=0.029; Cohen’s d=0.44), but there was no group difference in the distribution or median amyloid load. The hippocampal volume difference could be attributed to a decrease in both the left (t=2.423, df=98, p=0.017; d=0.485) and right (t=1.785, df=98, p=0.077; d=0.357) hippocampi (
Figure 2). There was no difference in the proportion of participants with a positive versus a negative amyloid scan between groups at an SUVR
comp threshold of 1.38. A two-by-two factorial ANOVA with the between-subject factors depression diagnosis and amyloid status and hippocampal volume as outcome measure did not show a significant interaction.
Group differences in hippocampal volume excluding amyloid-positive subjects.
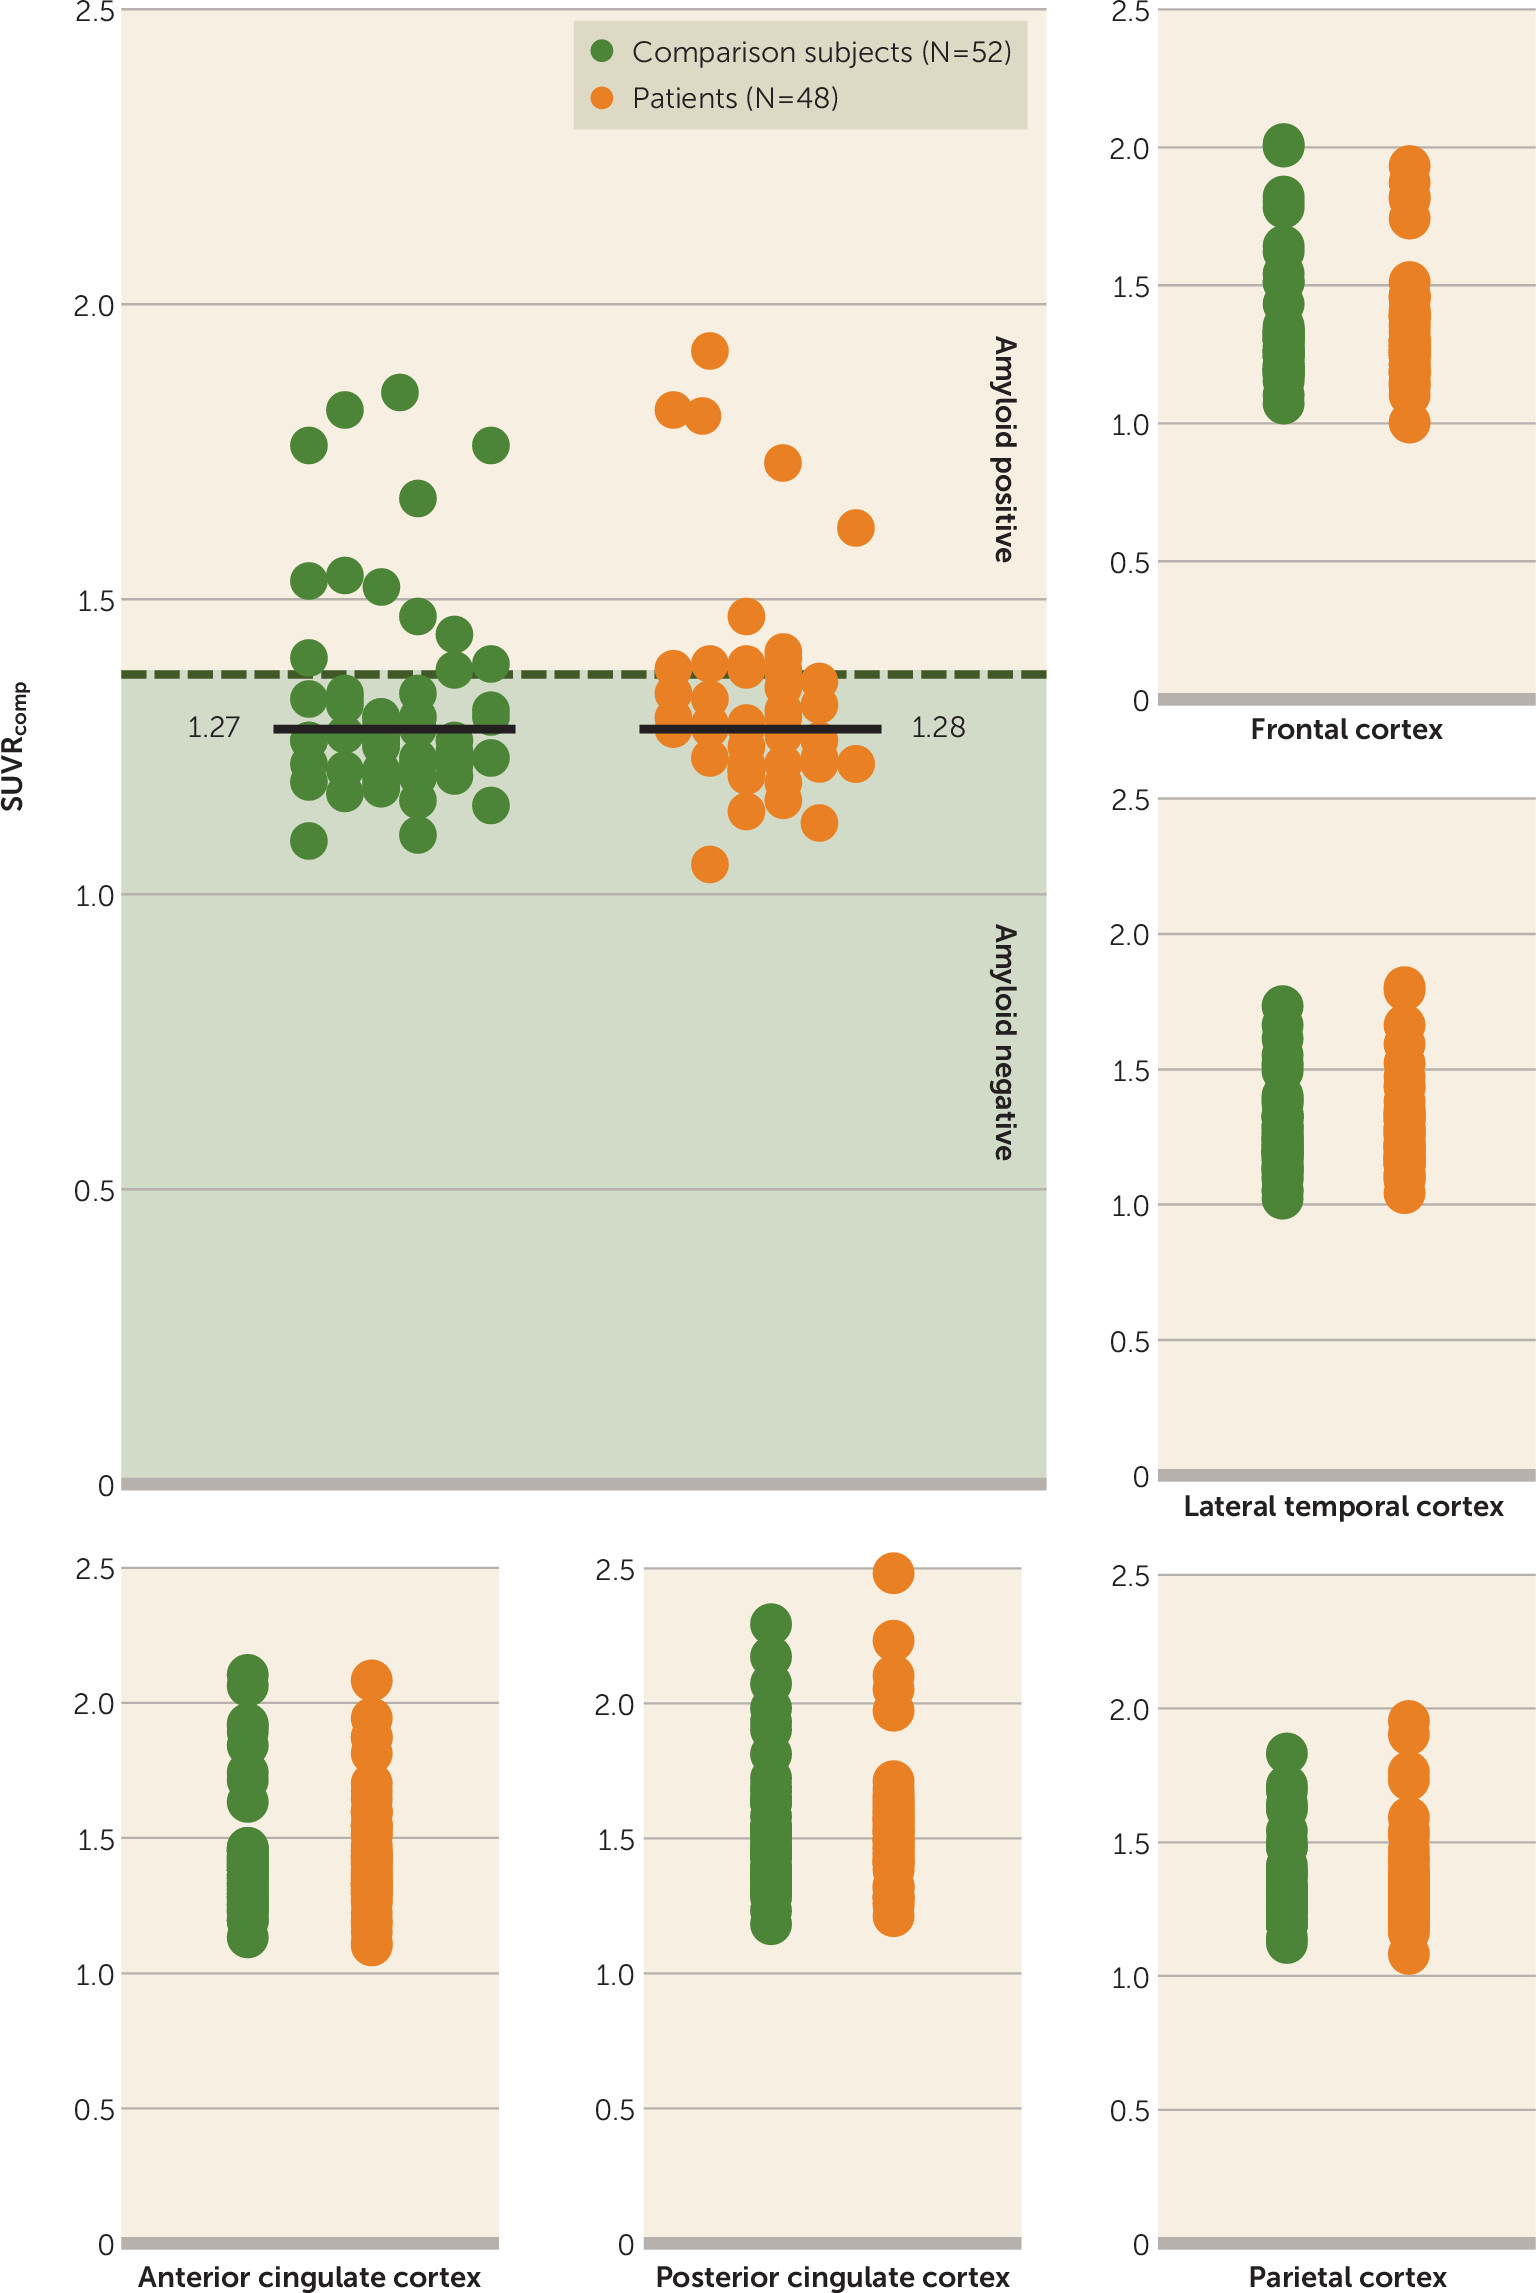
Below a threshold of 1.38, the difference in mean normalized total hippocampal volume between 38 amyloid-negative patients and 40 comparison subjects remained significant (t=2.145, df=76, p=0.035; d=0.486). There were no group differences in the distribution of SUVR
comp values (
Figure 3).
Association between amyloid binding and hippocampal volume.
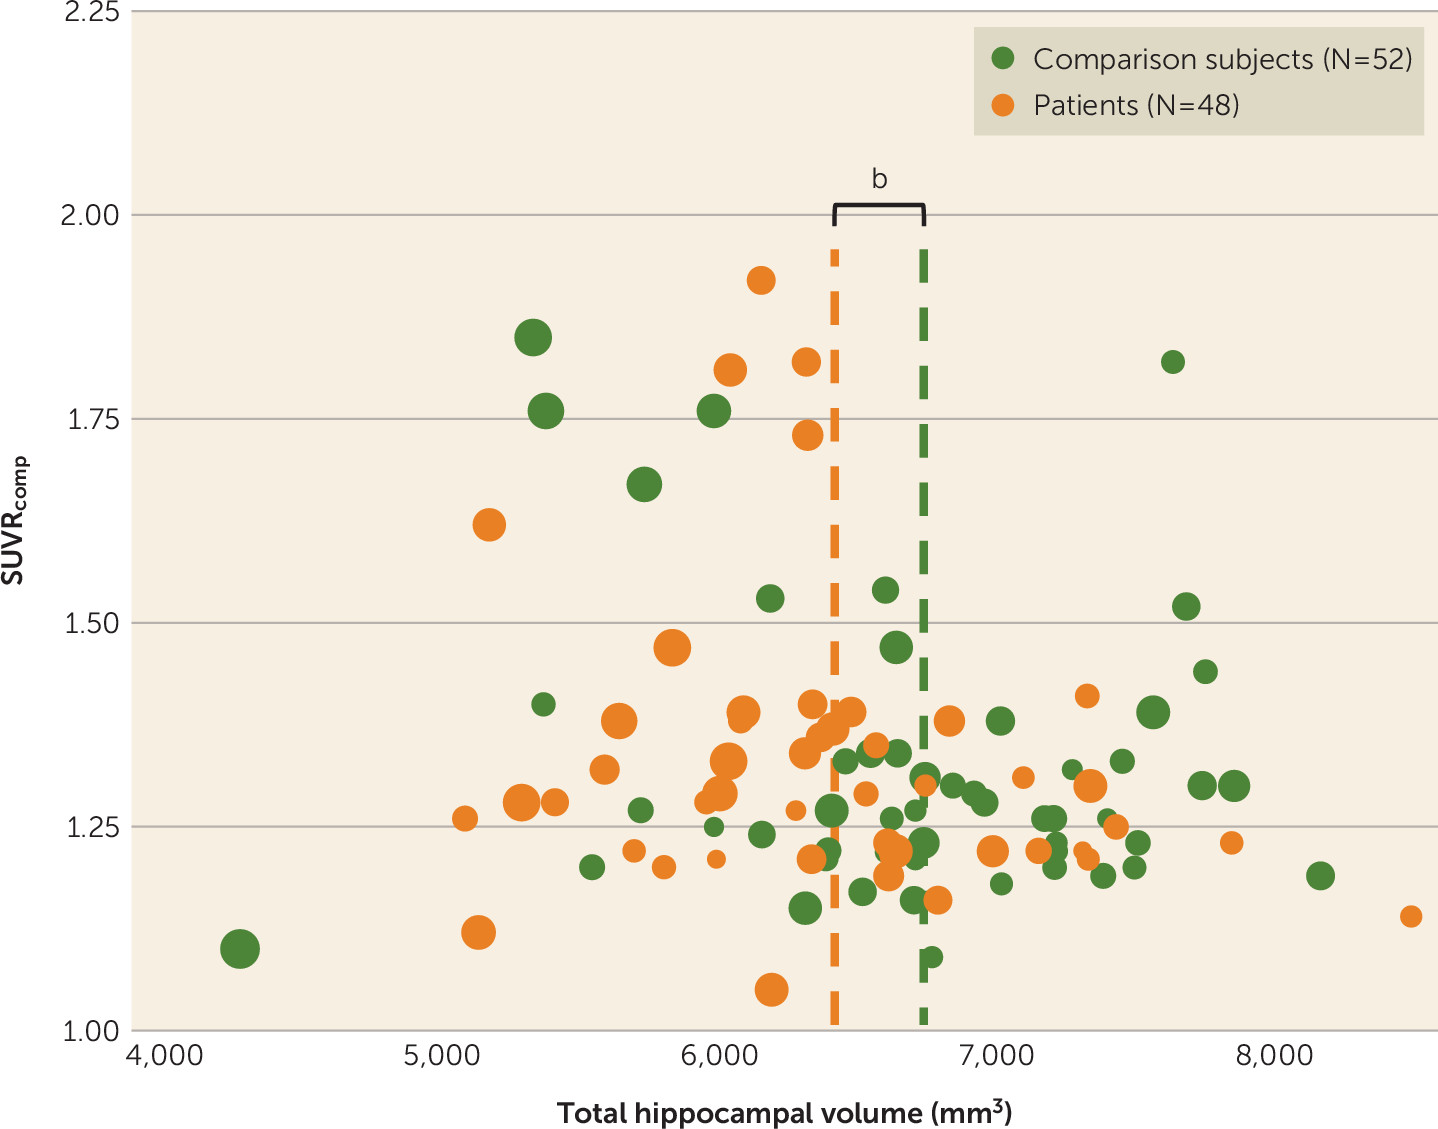
There were no significant associations between hippocampal volume and amyloid deposition in the composite volume of interest (
Figure 4).
Association between white matter hyperintensities, hippocampal volume, and amyloid binding.
There was no association between total hippocampal volume and white matter hyperintensity volume in either patients or comparison subjects. Likewise, there was no association between amyloid load and white matter hyperintensity volume in either patients or comparison subjects.
Association between APOE genotype, amyloid binding, and hippocampal volume.
A main effect of APOE genotype was observed for amyloid load (F=14.350, df=98, p<0.001), but not for hippocampal volume. APOE ε4 carriers had a higher amyloid load than non-ε4 carriers. There was no diagnosis-by-APOE genotype interaction with regard to either amyloid load or hippocampal volume. Post hoc analysis in patients with late-life depression confirmed a main effect of APOE genotype for amyloid load (F=8.683, df=1, 46, p=0.005) but not for hippocampal volume.
Secondary Analyses in Patients
Regional associations between amyloid binding and hippocampal volume in patients.
There were no significant associations between amyloid load and hippocampal volume in any volume of interest as assessed by Spearman correlation coefficients and Pearson partial correlations controlling for age.
Associations between clinical factors, hippocampal volume, and amyloid binding in patients.
No main effects were detected for onset of depression or the presence of psychotic features. No main effects were detected for measures of episodic memory, including total learning, delayed recall, and delayed recognition.
Discussion
Our data confirm that hippocampal volume is smaller in patients with late-life depression relative to healthy comparison subjects. The main and novel finding of our study, however, is that lower hippocampal volume was not due to a higher degree of amyloid deposition in the late-life depression group. We did not find any correlation between hippocampal volume and amyloid deposition in patients, and hippocampal volume remained significantly lower when the comparison was restricted to amyloid-negative individuals. This finding was independent of the SUVR
comp threshold used (see the
online data supplement). Similar to other studies in late-life depression (
37), we found significant cognitive impairment, including episodic memory deficits, but no relationship between memory impairment and hippocampal volume or amyloid binding, suggesting that amyloid pathology may not be the cause of memory problems in our patient cohort. This finding supports neuropathological evidence showing that cognitive impairment in late-life depression is not associated with Alzheimer-type pathology (
38). In agreement with other studies (
4,
8), lower hippocampal volume in late-life depression was not associated with APOE ε4 carrier status despite our finding of higher amyloid binding in patients with APOE ε4 carrier status. Furthermore, there was no significant association between amyloid levels and onset of depression. Taken together, these findings suggest that Alzheimer’s pathology is unlikely to be the main cause of lower hippocampal volume in our patient cohort.
Although this study does not support Alzheimer’s disease as cause of hippocampal volume decrease in late-life depression, our findings do not necessarily refute the depression-as-late-life-neuropsychiatric-disorder model. It has recently been shown that hippocampal atrophy as a marker of neuronal injury may be present in the absence of amyloid pathology, a condition that has been called suspected nonamyloid pathology (
39). Individuals with mild cognitive impairment associated with suspected nonamyloid pathology have an increased risk of cognitive deterioration comparable to that in individuals with mild cognitive impairment who have markers of neuronal injury in the presence of amyloid pathology (
39). This could explain why patients with late-life depression who have hippocampal atrophy have an increased risk of developing dementia. Although vascular impairment may contribute to nonamyloid brain changes and the occurrence of late-life depressive symptoms, we did not find an association between white matter hyperintensities and hippocampal volume in our cohort.
Stress-related mechanisms were not the focus of this study, and we did not find evidence of significant hippocampal volume decrease in early-onset compared with late-onset depression, despite the absence of a relationship with amyloid pathology in the late-onset group. The lack of association with illness onset may be compatible with the vulnerability hypothesis, which predicts increased stress sensitivity and proneness to depression due to preexisting lower hippocampal volume (
23).
As far as we know, this is the first prospective study using amyloid imaging in patients who were depressed at the time of scanning. In a small sample of remitted patients with late-life depression who underwent
11C-PIB PET (
31), approximately half of the patients demonstrated increased amyloid binding. However, the majority of patients fulfilled the criteria for mild cognitive impairment after remission. A study examining the effect of a lifetime history of depression on cortical amyloid level using [
18F]florbetapir in elderly subjects without cognitive impairment (
30) showed increased amyloid binding in the precuneus and parietal cortex, but no global increases relative to comparison subjects and no association with age at onset. Another study using
11C-PIB PET in nondemented individuals with prior depressive episodes (
29) did not find elevated cortical amyloid binding or specific changes in patients with late-onset depression relative to comparison subjects. However, remission as an inclusion criterion is associated with a selection bias and may not be representative of all patients with late-life depression.
Our findings may have important clinical implications. Differentiating between early Alzheimer’s disease and late-life depression is often challenging for clinicians. A significant proportion of depressed individuals have cognitive impairment, including episodic memory and attention deficits, overlapping with the cognitive profile of Alzheimer’s disease (
40). In these circumstances, neuroimaging markers of neuronal injury, such as hippocampal atrophy, are commonly used to support a diagnosis of Alzheimer’s disease. However, hippocampal atrophy has mainly been validated as an imaging marker of Alzheimer’s disease in comparison with healthy subjects. In view of our data, hippocampal volume decrease as a diagnostic measure may be less reliable for assessing Alzheimer’s disease pathology in patients with late-life depression, compared with amyloid imaging.
Some limitations of the study need to be addressed. First, although the data used here are part of a longitudinal study, we only report cross-sectional findings because our objective was to determine whether hippocampal volume decrease was associated with amyloid levels at the time of diagnosis. However, it will be interesting to investigate what lower hippocampal volume in the absence of amyloid pathology means in terms of prognosis or risk of cognitive deterioration. Second, referral to our academic hospital may be associated with a selection bias toward more severe, therapy-resistant, and psychotic depressions or a lower likelihood of Alzheimer’s disease–related pathology according to the referring clinician. Finally, genetic stratification according to APOE status was present in some comparison subjects but not in the patient group, which could constitute a bias. However, we did not detect any group-by-APOE ε4 status interaction for hippocampal volume or SUVRcomp.
In summary, our study challenges the idea that lower hippocampal volume in late-life depression is due to Alzheimer’s disease and encourages the investigation of alternative models.
