Little is known, however, about the neurobiology underlying the associations between maternal depressive symptoms and cognitive, emotional, and behavioral problems in offspring. Previous neuroimaging studies on prenatal or postnatal depression have focused primarily on offspring limbic system development, in particular the structure and function of the amygdala and the hippocampus (
5–
10). A few other studies adopted an exploratory whole-brain approach and suggested that prenatal and postnatal maternal depressive symptoms predict offspring cortical thinning in childhood, particularly in the frontal lobe (
11,
12). Recent studies have also suggested associations between perinatal maternal depression and child brain microstructure in various developmental phases (
13). However, these findings have not been consistent, and several important gaps remain. First, the critical period during which offspring brain development is most vulnerable to maternal depressive symptoms remains unclear. Second, although persistently high levels of depressive symptoms in mothers are associated with offspring internalizing and externalizing problems (
14,
15), few studies have addressed whether persistence of depressive symptoms in mothers affects offspring brain development.
Our aim in this study was to explore whether maternal depressive symptoms, assessed repeatedly from the perinatal period until child age 10 years, are associated with offspring brain development. We also examined the associations between empirically defined groups of maternal depressive symptom trajectories and child brain development. And, finally, we investigated whether any observed brain differences mediated the association of maternal depressive symptoms with child problems.
Methods
Setting
This study was embedded in the Generation R Study, a population-based cohort from fetal life onward in Rotterdam, the Netherlands (
16). Women with an expected delivery date between April 2002 and January 2006 were eligible. The study was approved by the Medical Ethics Committee of the Erasmus Medical Center, Rotterdam. Written informed consent was obtained from all participants.
Study Population
The children participating in Generation R were invited for a neuroimaging session at age 10. A total of 4,245 children visited the research center, and of these, 3,992 children underwent the neuroimaging assessment. We excluded 134 children without data on maternal depressive symptoms, and another 389 children were excluded because of insufficient quality of neuroimaging data, leaving 3,469 mother-child pairs for the final analyses (see Figure S1 in the online supplement).
Maternal Depressive Symptoms
Information on maternal psychopathology was obtained during pregnancy (on average at 20.6 weeks of gestation), the postnatal period (child age 2 months), early childhood (age 3 years), and preadolescence (age 10 years) with the Brief Symptom Inventory (BSI) (
17), a validated self-report questionnaire containing 53 items. A weighted score for the depressive symptom scale (six items, each ranging from 0 to 4 points) was calculated by summing the item scores and dividing by the number of completed items. In line with the literature on the chronicity of maternal depressive symptoms (
18), the depressive symptom scores across the assessments were moderately correlated (Spearman correlation coefficients ranging from 0.26 to 0.44), with the strongest correlation between depressive symptom scores at 20 weeks of gestation and those at child age 2 months. Cronbach’s alpha values for the BSI depressive symptom scale at the four assessments ranged from 0.82 to 0.85. Mothers also completed the Edinburgh Postnatal Depression Scale (EPDS) at child age 2 months. Using the validated BSI cutoff of 0.75, we compared the dichotomized score with the EPDS (validated cutoff of 13) and found a sensitivity of 0.62 and a specificity of 0.97 (
19), demonstrating moderate to good quality of the BSI’s measurement of clinical depression.
Scores on “interpersonal sensitivity,” “anxiety,” and “hostility,” also measured repeatedly with the BSI, were used to test the specificity of any observed association.
Neuroimaging
The children were first familiarized with MRI scanning during a mock scanning session. All images were acquired using the same sequence on the same scanner (a 3-T GE 750w Discovery). After a three-plane localizer scan, a high-resolution T1-weighted inversion recovery fast spoiled gradient recalled sequence was acquired with the following parameters: TR=8.77 ms, TE=3.4 ms, TI=600 ms, flip angle=10°, FOV=220 mm×220 mm, acquisition matrix=220×220, slice thickness=1 mm, number of slices=230. Diffusion tensor imaging (DTI) data were acquired using an echo-planar sequence with three b=0 scans and 35 diffusion-weighted images (b=1000 s/mm2) with the following parameters: TR=12,500 ms, TE=72.8 ms, FOV=240 mm×240 mm, acquisition matrix=120×120, slice thickness=2 mm, number of slices=65.
Cortical reconstruction and volumetric segmentation were performed with FreeSurfer, version 6.0.0 (
http://surfer.nmr.mgh.harvard.edu/). FreeSurfer procedures have shown good test-retest reliability across manufacturers and field strengths (
20). The quality of FreeSurfer output was visually inspected, and data with insufficient quality were eliminated. Metrics of volume, including total gray matter volume and total white matter volume and volumes of the specific limbic structures, were extracted. DTI data were processed using the Functional MRI of the Brain (FMRIB) Software Library (FSL) and the Camino Diffusion MRI Toolkit (
21,
22). The diffusion tensor was fitted using the RESTORE method implemented in Camino. Common scalar maps, including fractional anisotropy (FA) and mean diffusivity (MD), were computed. FA and MD are common measures to quantify white matter microstructure. FA describes the degree of anisotropic diffusion, and MD describes the average diffusion in all directions. Fully automated probabilistic fiber tractography was performed using the FSL plugin AutoPtx (
https://fsl.fmrib.ox.ac.uk/fsl/fslwiki/AutoPtx) (
23). Diffusion image quality was assured by a combination of manual and automated checks, including the examination of slice-wise variation in the diffusion signal, the sum-of-square error of the tensor calculation, and intersubject registration accuracy.
Covariates
The following demographic variables were selected as potential confounders, based on the literature (
10,
14,
24): maternal ethnicity, marital status, education level, smoking, alcohol use, monthly household income, age at intake, number of individuals living in the household, child age at scan, sex, birth weight, and presence of siblings. In addition, information on maternal lifetime history of depression was collected during pregnancy, and seeking professional help for depression postnatally was assessed by questionnaire. These variables were not considered as confounders but aided interpretation of the results. Maternal prenatal use of antidepressants was assessed by self-report and pharmacy records and was explored in sensitivity analyses. Emotional and behavioral problems in children at age 10 were measured with the validated Brief Problem Monitor (BPM) for mediation analyses (
25).
Statistical Analysis
A hierarchical approach was used to examine the association of maternal depressive symptoms and offspring brain outcomes. In primary analyses, we examined global volumetric measures, including total gray matter and total white matter volume, and overall white matter microstructure measures, including global FA and MD. If an association with a global metric was observed, we performed post hoc analyses of the cortical thickness of specific brain lobes and the microstructure of predefined tracts: forceps major, forceps minor, uncinate fasciculus, inferior longitudinal fasciculus, superior longitudinal fasciculus, and cingulum bundle. Based on previous studies, volumes of specific limbic structures, including the thalamus, amygdala, and hippocampus, were examined independently of global findings in supplementary analyses. Additionally, we tested for the presence of indirect effects, as suggested by Hayes and Rockwood (
26), to examine whether the potential differences in brain measures mediated the association of maternal depressive symptoms with child emotional and behavioral problems.
The association between maternal depressive symptoms at four specific time points (referred to as single-time-point analyses) and offspring brain neuroimaging measures was examined separately with linear regression analyses to avoid inflated standard errors and unstable estimations due to collinearity of the repeated measures (
27). Likewise, the models with total gray matter and white matter volume as the outcome were not adjusted for intracranial volume given the high correlation (r>0.89). We present initial unadjusted analyses and analyses adjusted for covariates selected using a change-in-estimate criterion of 5%.
Because heterogeneity has been described (
28) in the timing of the onset and persistence of maternal depression during the perinatal period, we aimed to identify between-group differences rather than within-group variability. Hence, a latent class growth analysis was used to account for the interrelation of repeatedly measured maternal depressive symptoms. Trajectories of depressive symptoms were modeled in mothers for whom data were available from two or more time points (N=3,071). Because the distribution of maternal depressive symptoms was skewed, the developmental trajectories were modeled with censored normal distribution. The full-information maximum-likelihood algorithm was used to handle missing data. Based on previous experience (
14), models with two to five trajectories were estimated and compared. Model selection was further based on the bootstrap likelihood ratio test, the Lo-Mendell-Rubin test, and the Bayesian information criterion (
29). As a supplementary reference, a low Akaike information criterion and high entropy were used to define good model fit. Interpretability of the groups was taken into account to decide on the number of groups. Models were not adopted if an additional group failed to provide substantive information. Subsequently, the associations between maternal depressive symptom trajectory group membership and offspring brain neuroimaging measures were assessed with linear regression analyses. Individuals’ posterior probability of trajectory membership was corrected in regression models to account for the uncertainty of the classification.
We additionally explored interaction by child sex in the above analyses. In sensitivity analyses, we excluded 86 mothers who reported prenatal antidepressant use, as exposure to maternal antidepressants has been associated with altered neonatal brain outcomes (
30).
On average, 5.8% of the data on the covariates were missing (missing at random, as indicated by Little’s test) and were accounted for by multiple imputation. Determinants and outcomes were not imputed; 10 imputed data sets were generated.
In this exploratory study, a false-discovery-rate correction was applied to the primary volumetric and white matter microstructure outcomes in the adjusted models to minimize false positive findings due to multiple comparisons. The number of tests was eight for single-time-point analyses and six for trajectory analyses. Statistical significance was set at an alpha of 0.05 (two-sided). Mplus, version 7.1.0, was employed to perform latent class growth analysis, and SPSS, version 24.0 (including the PROCESS macro, version 3.1, for mediation analysis) was used for all other analyses.
Nonresponse Analyses
The characteristics of the 3,469 participants were compared with those of the 523 participants for whom data were not available on maternal depressive symptoms or child neuroimaging. Analysis of variance or the Kruskal-Wallis test was used for continuous variables and the chi-square test for categorical variables. The results showed that mothers with missing data were younger on average (mean=30.6 years [SD=5.4] for nonresponders and mean=31.2 years [SD]4.8] for responders), more often non-Dutch (42.9% and 58.8%), more often single (17.6% and 11.3%), and less likely to be highly educated (38.9% and 51.7%). Excluded children had a lower birth weight on average than participating children (mean=3,359 grams [SD=572], compared with mean=3,423 grams [SD=573]).
Results
Descriptive Statistics
Table 1 summarizes the demographic and exposure information of the study population. The mean age of the children at scanning was 10.1 years. Half (50.5%) of the children were girls, and 58.8% had a Dutch national origin. The mean scores for maternal depressive symptoms at four time points ranged from 0.12 to 0.20.
Maternal Depressive Symptoms at Specific Time Points and Child Brain Development
Table 2 shows that higher maternal depressive symptom scores at all four time points were associated with smaller total gray matter volume in unadjusted models. After adjusting for covariates, only exposure to maternal depressive symptoms at child age 2 months was associated with smaller total gray matter volumes in offspring at age 10. Specifically, a 1-point increase on the BSI depressive symptom scale corresponded to a 7.29 cm
3 (0.96%) reduction in total gray matter; thus, children exposed to the highest BSI score had up to 29.16 cm
3 (3.8%) less gray matter. The Cohen’s f
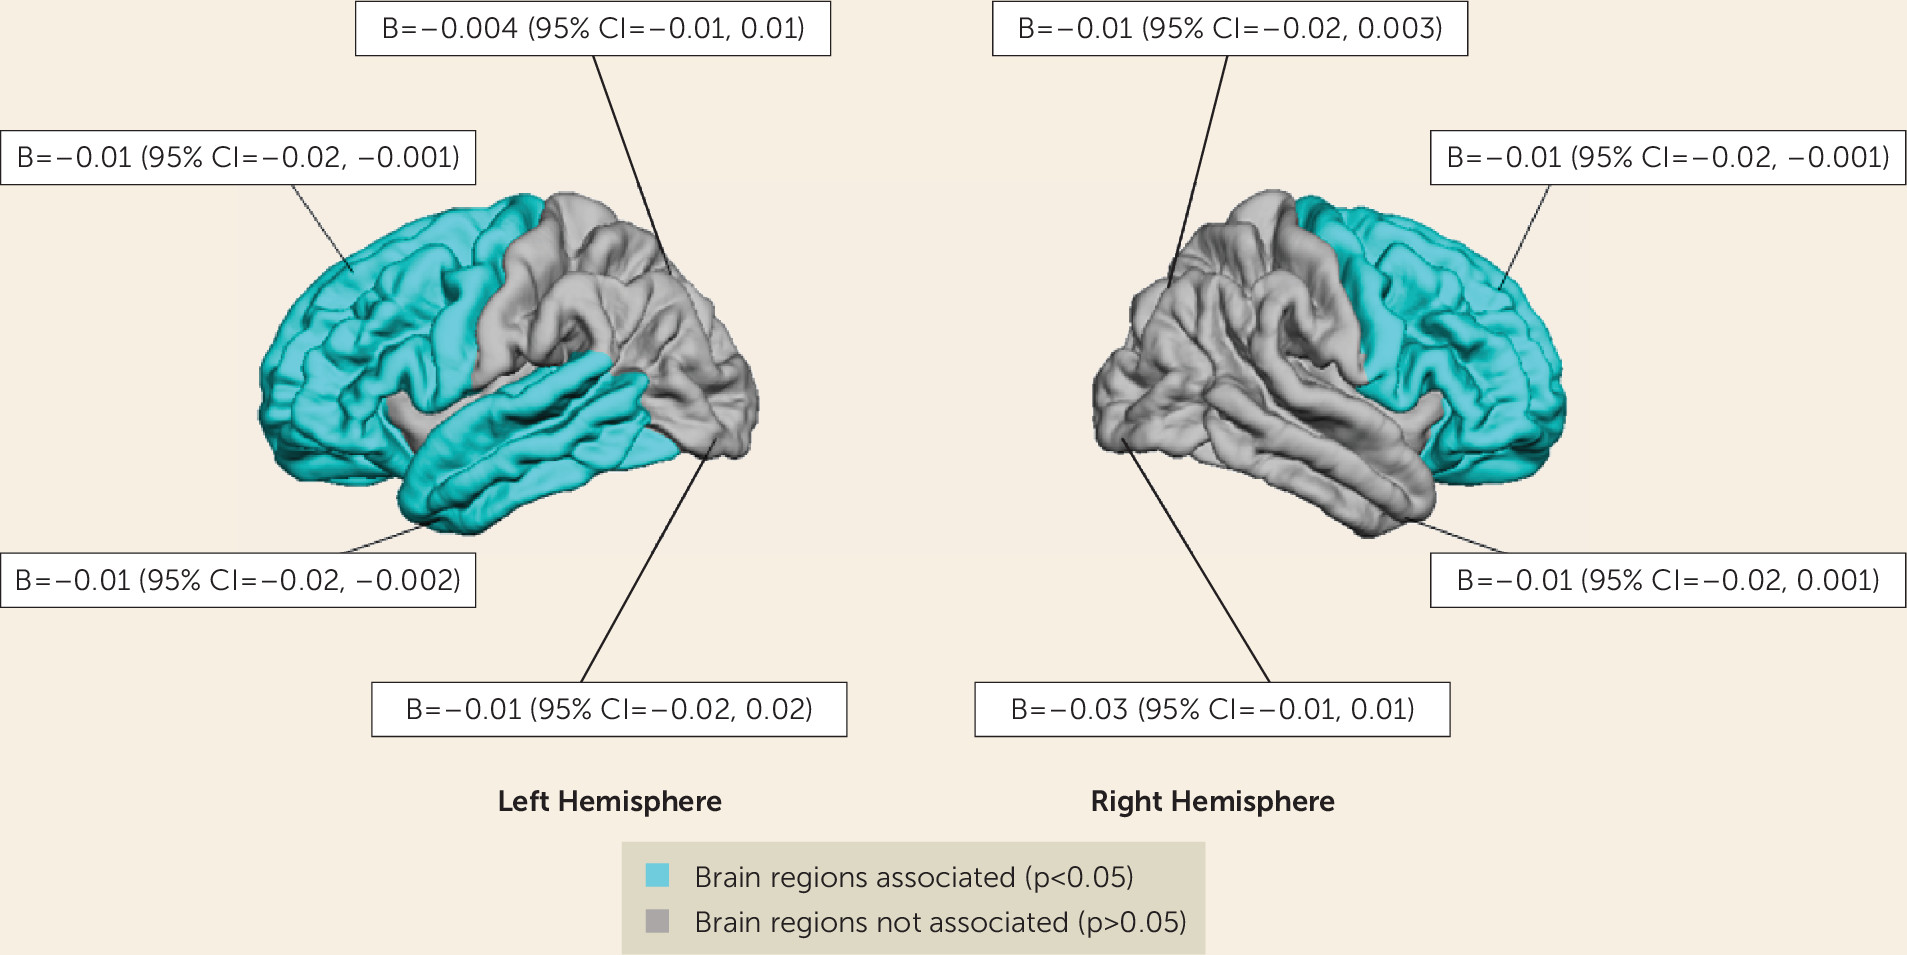
2 measure was 0.004, indicating a small effect size. Post hoc analyses showed that maternal depressive symptoms at 2 months were associated with thinner cortices in the left and right frontal lobe and in the left temporal lobe (
Figure 1). No association was found with total white matter volume. Maternal depressive symptoms at other time points were not associated with total gray matter or white matter volume after taking into account the covariates.
In the supplementary analyses, no association was found between maternal depressive symptoms at any time point and volumes of the thalamus, amygdala, or hippocampus (see Table S1 in the online supplement).
Table 2 also shows that maternal depressive symptoms at child age 2 months predicted lower offspring white matter FA, but the association did not survive correction for multiple comparisons. The Cohen’s f
2 was 0.003, indicating a small effect size. Post hoc analyses of specific tracts demonstrated that maternal depressive symptoms at 2 months were related to lower FA in the forceps minor (b=−0.01, 95% CI=−0.01, −0.001, p=0.008) after correcting for the covariates. Again, maternal depressive symptoms at other time points were not associated with white matter microstructure.
No associations were observed between maternal symptoms of interpersonal sensitivity, anxiety, or hostility and child brain outcomes at any time point. No interaction by child sex was observed in any association tested.
We found evidence suggesting that the child’s total gray matter volume mediated the association of maternal depressive symptoms at child age 2 months with child attention problems at 10 years (covariate-adjusted unstandardized indirect effect=0.04, bootstrapped 95% CI=0.01, 0.07; direct effect=−0.12, 95% CI=−0.17, 0.40; see Figure S2 in the online supplement). This mediating association was not driven by cortical thickness of any specific brain lobe. The association of maternal depressive symptoms with internalizing or externalizing problems was not mediated by child brain morphology.
Maternal Depressive Symptom Trajectories and Child Brain Development
The four-class model with quadratic and cubic terms was found to be the optimal model, with the lowest Bayesian information criterion and p values <0.05 for the bootstrap likelihood ratio test and the Lo-Mendell-Rubin test (see Table S2 in the
online supplement). The average posterior probabilities of the trajectories ranged from 0.79 to 0.89, which were satisfactory.
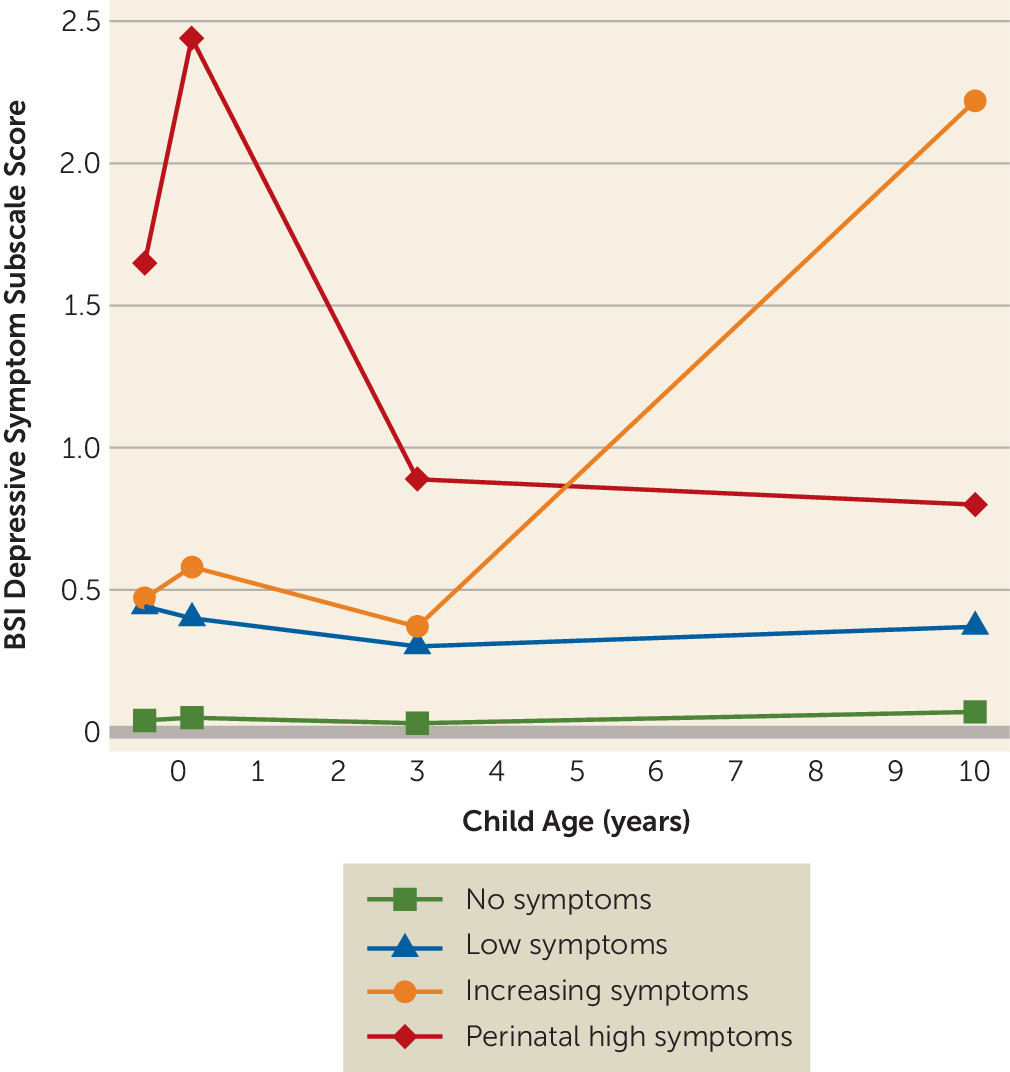
Figure 2 shows the trajectory groups; the first and largest class (N=2,120, 69.0%), termed “no symptoms,” consisted of mothers reporting no or very few depressive symptoms at all time points. The second class (N=845, 27.5%), termed “low symptoms,” included mothers with a modest and stable level of depressive symptoms. In the smallest group (N=43, 1.4%), maternal depressive symptoms sharply increased from moderate levels prenatally and at 3 years to high levels at age 10, so this group was labeled “increasing symptoms.” Finally, there was a group of mothers (N=63, 2.1%) with already high symptom levels during pregnancy that peaked in the early postnatal period. In these mothers, depressive symptom levels were lower but remained above the clinical cutoff score at child ages 3 and 10 years. This group was labeled “perinatal high symptoms.” Interestingly, a larger proportion of mothers in the perinatal high symptoms group had a history of depression (71.2% compared with 20.6% for mothers with no symptoms, p<0.001), and more sought professional help for depression postnatally (41.9% compared with 0.4%, p<0.001).
Table 3 lists the adjusted associations of the trajectory groups and child brain development. Children whose mothers were in the perinatal high symptoms group had smaller total gray matter and total white matter volumes than the children whose mothers were in the no symptoms group. Specifically, children of mothers with perinatal high symptoms had 21.09 cm
3 (2.7%) less total gray matter volume and 15.57 cm
3 (3.4%) less total white matter volume than those in the reference groups. No differences in cortical thickness between groups were found. Children whose mothers were in the low symptoms or increasing symptoms groups did not differ from the reference groups in gray matter or white matter volumes.
There were no differences in volumes of the thalamus, amygdala, and hippocampus between the maternal depressive symptom trajectory groups (see Table S1 in the online supplement).
Children whose mothers were in the perinatal high symptoms group showed lower white matter FA than the reference group. Post hoc analyses further indicated that exposure to perinatal high symptoms was associated with lower FA in the forceps major (b=−0.01, 95% CI=−0.02, −0.0003, p=0.04), the forceps minor (b=−0,01, 95% CI=−0.02, −0.001, p=0.03), and the uncinate fasciculus (b=−0.01, 95% CI=−0.02, −0.002, p=0.02). No associations were found between maternal depressive symptom trajectories and MD. Again, no interaction by child sex was detected in any of these analyses.
Results obtained in the sensitivity analyses excluding mothers who reported prenatal antidepressant use were similar to the main analyses (see Table S3 in the online supplement).
Discussion
In this population-based study, maternal depressive symptoms in the postnatal period were associated with smaller gray matter volumes in offspring. Children exposed to persistently high maternal depressive symptoms across the perinatal period had smaller gray and white matter volumes. Consistently, alterations (i.e., lower FA) in white matter microstructure were observed, particularly in the forceps minor. Notably, the gray matter volume differences mediated the association of postnatal maternal depressive symptoms with child attention problems.
Few studies have focused on the associations of maternal depressive symptoms with child brain development, and results have been inconsistent. In line with previous studies (
7,
10,
11,
30), we found no associations of prenatal maternal depressive symptoms with volumes of gray and white matter, amygdala, or hippocampus in the offspring, although some studies observed associations between prenatal maternal depression and amygdala or hippocampus volume in children at younger ages (
10,
31). Similarly, no relation was reported between postnatal maternal depression and amygdala volumes in offspring (
10). In contrast, a longitudinal study suggested that persistent maternal depressive symptoms from birth until late childhood were related to greater amygdala volume in 10-year-old children (
6). However, these findings should be interpreted with caution given the small sample size and limited adjustment for relevant confounding factors. Recent studies have reported associations between prenatal maternal depression and white matter structure in 1-month-old infants or 8-year-old children (
5,
13). In addition, Lebel et al. (
12) reported that postnatal maternal depressive symptoms were associated with white matter microstructure in preschool children. Although our results also suggested associations between perinatal maternal depressive symptoms and child global FA in white matter, these findings should be interpreted cautiously because they did not survive correction for multiple comparisons. Additionally, unlike a few previous studies that suggested sex-dependent effects of perinatal depression on amygdala volume or brain microstructure (
10,
13), we observed no sex-specific associations. Possibly differences in age and confounder adjustment explain these discrepancies. Finally, our post hoc analysis showing that postnatal maternal depressive symptoms may be associated with thinner cortices in the frontal lobes is consistent with findings from a previous study (
12).
Our study extends the literature on maternal depression and child brain development with trajectory analyses, which provide information beyond the single-time-point analyses and account for patterns of depressive symptoms over time. Maternal depressive symptoms in the perinatal period, in particular the postnatal period, are more likely to affect offspring brain development, which suggests a critical period of sensitivity. Furthermore, our study suggests that gray matter volume may be involved in the neurobiological mechanism underlying the association of maternal depression with child attention problems, which has rarely been reported, highlighting the possibility that interventions reducing maternal depression may have lasting effects on child development.
The finding that maternal depressive symptoms at child age 2 months were associated with offspring brain development in childhood is very interesting, because much of postnatal brain development is experience dependent (
32). Previous studies have suggested the postpartum months as a critical period for child behavioral outcomes, such as internalizing problems and responsiveness disturbance in those exposed to maternal depression (
33,
34). Our results suggest that this is also true for brain development. In the postnatal period, the brain undergoes rapid growth in gray matter, mainly as a result of synaptogenesis and dendritic arborization (
35). The postnatal period is also when the primary myelination process in white matter occurs (
36). White matter volume, on the other hand, increases steadily in both the prenatal and postnatal periods (
37). This may explain why smaller white matter volumes were observed only in children exposed to persistently high maternal depressive symptoms across the perinatal period.
Several potential mechanisms underlying our results deserve discussion. First, impaired mother-infant interaction may have a mediating role. For the infant, neural architecture must be formed within the embedding context of the parents’ support (
38). There is evidence showing that postpartum maternal depression predicts poor mother-infant attachment and parenting (
1,
39,
40), which have both been related to smaller gray matter volumes and abnormal white matter microstructure development (
41,
42). Second, early postnatal exposure to maternal depression has been shown to predict elevated cortisol levels in offspring (
43), possibly as a result of the cortisol synchrony in mother-infant dyads through breastfeeding or physical interactions (
44), which have been associated with altered brain structure, such as smaller limbic regions (
45). Third and perhaps foremost, mothers in the perinatal high symptoms group suffered more from lifetime depression and were more likely to have sought professional help for depression, suggesting an inherent vulnerability that increases the risk of developing depression particularly in the perinatal period (
46). Thus, the genetic susceptibility to depression, which in turn may be related to offspring brain differences (
47), could underlie the association observed in the perinatal period.
Most probably, more chronic and severe maternal depressive symptoms exert cumulative effects on offspring brain development across the perinatal period or childhood. Indeed, the depressive symptom scores were correlated from fetal life to childhood, in particular between depressive symptom scores in the perinatal period. Women in the “perinatal high symptoms” group had the most chronic and severe depressive symptoms from their pregnancy onward, even though these symptoms decreased over time. Thus, we must be careful when interpreting the timing of effects, because depression is a chronic and recurrent disorder. The correlation of maternal depressive symptoms over time makes it difficult to attribute any effect to a particular time point in development. Also, we cannot infer causality from this study; we can only speculate that the perinatal environment and genetic susceptibility together mediate the association of maternal depressive symptoms with child brain development.
The strengths of this study are the relatively large sample size, repeated assessments of depressive symptoms, and the combination of single-time-point analyses and trajectory analyses. Moreover, the population-based nature of the study enhances the generalizability of the results. A few limitations must also be discussed. First, only cross-sectional neuroimaging data were used, so we cannot determine whether the effects are permanent or transient. Second, although we adjusted for a number of potential confounding factors, unmeasured residual confounding by extraneous factors, such as breastfeeding, diet, and maternal externalizing symptoms, cannot be ruled out. Third, since the prevalence of depression was low in this study population, the power to detect an association may have been more limited than suggested by the sample size, and the results must be generalized carefully to more vulnerable populations.
In conclusion, this study shows that exposure to perinatal maternal depressive symptoms, but not to maternal depressive symptoms in childhood, is associated with brain morphological differences in offspring assessed at age 10. These findings suggest that the perinatal period, particularly the postnatal period, may be critical for prevention of maternal depressive symptoms in view of the long-term association with child brain development.


