A major challenge in understanding and treating posttraumatic stress disorder (PTSD) is its clinical heterogeneity (
1), which may be driven by different neurobiological abnormalities in different patients. Identifying more homogeneous, biologically defined subgroups within the broad clinical diagnosis of PTSD may help disentangle this heterogeneity, thus improving diagnosis and treatment. To date, most efforts to characterize PTSD subtypes have involved identifying clusters of symptoms and testing these clinically determined subtypes for corresponding distinct neurophysiological patterns (e.g., references
2,
3). However, a specific clinical phenotype may itself be driven by several different neurobiological factors. Therefore, an alternative to subgrouping patients based on symptom patterns would be to seek shared signatures of brain dysfunction within patients that could reveal clinically meaningful neurophysiological subgroupings (
4,
5). Such an approach has already provided insights into how different neurophysiological patterns may lead to heterogeneity within the broad clinical phenotype of psychotic disorders (
5–
7). Neuroimaging-based biomarkers have been identified for several neuropsychiatric disorders (
4,
8) and have shown promise in predicting treatment response (
4,
9–
12) and informing treatment selection (
13).
Resting-state functional MRI (rsfMRI) is a useful modality for studying brain function in clinical populations (
8). The functional connectivity profiles estimated from rsfMRI data, within and between known functional brain networks, are closely related to structural and synaptic measures of connectivity (
14,
15). Group-level comparisons of rsfMRI data from individuals with PTSD and healthy control subjects have shown connectivity abnormalities within the default mode network and within the ventral attention network and between the default mode network and both the ventral attention and frontoparietal control networks (
16–
18), some of which were associated with individual differences in specific behavioral measures. These findings suggest that connectivity measures extracted from rsfMRI may be a basis for identifying novel neurobiological subtypes within the broad group of individuals who meet criteria for PTSD (
4). However, the challenge of extracting the relevant features that would best parse neurobiological heterogeneity within PTSD remains. Specifically, it should be noted that a significant case-control difference at the level of the mean (as would be detected using a two-sample t test) may not reflect any discriminability at the level of the individual. On the other hand, a feature that does not show a significant case-control difference at the level of the mean may carry discriminability power at the individual level, if many values fall far from the group mean. An example of such a feature is illustrated in
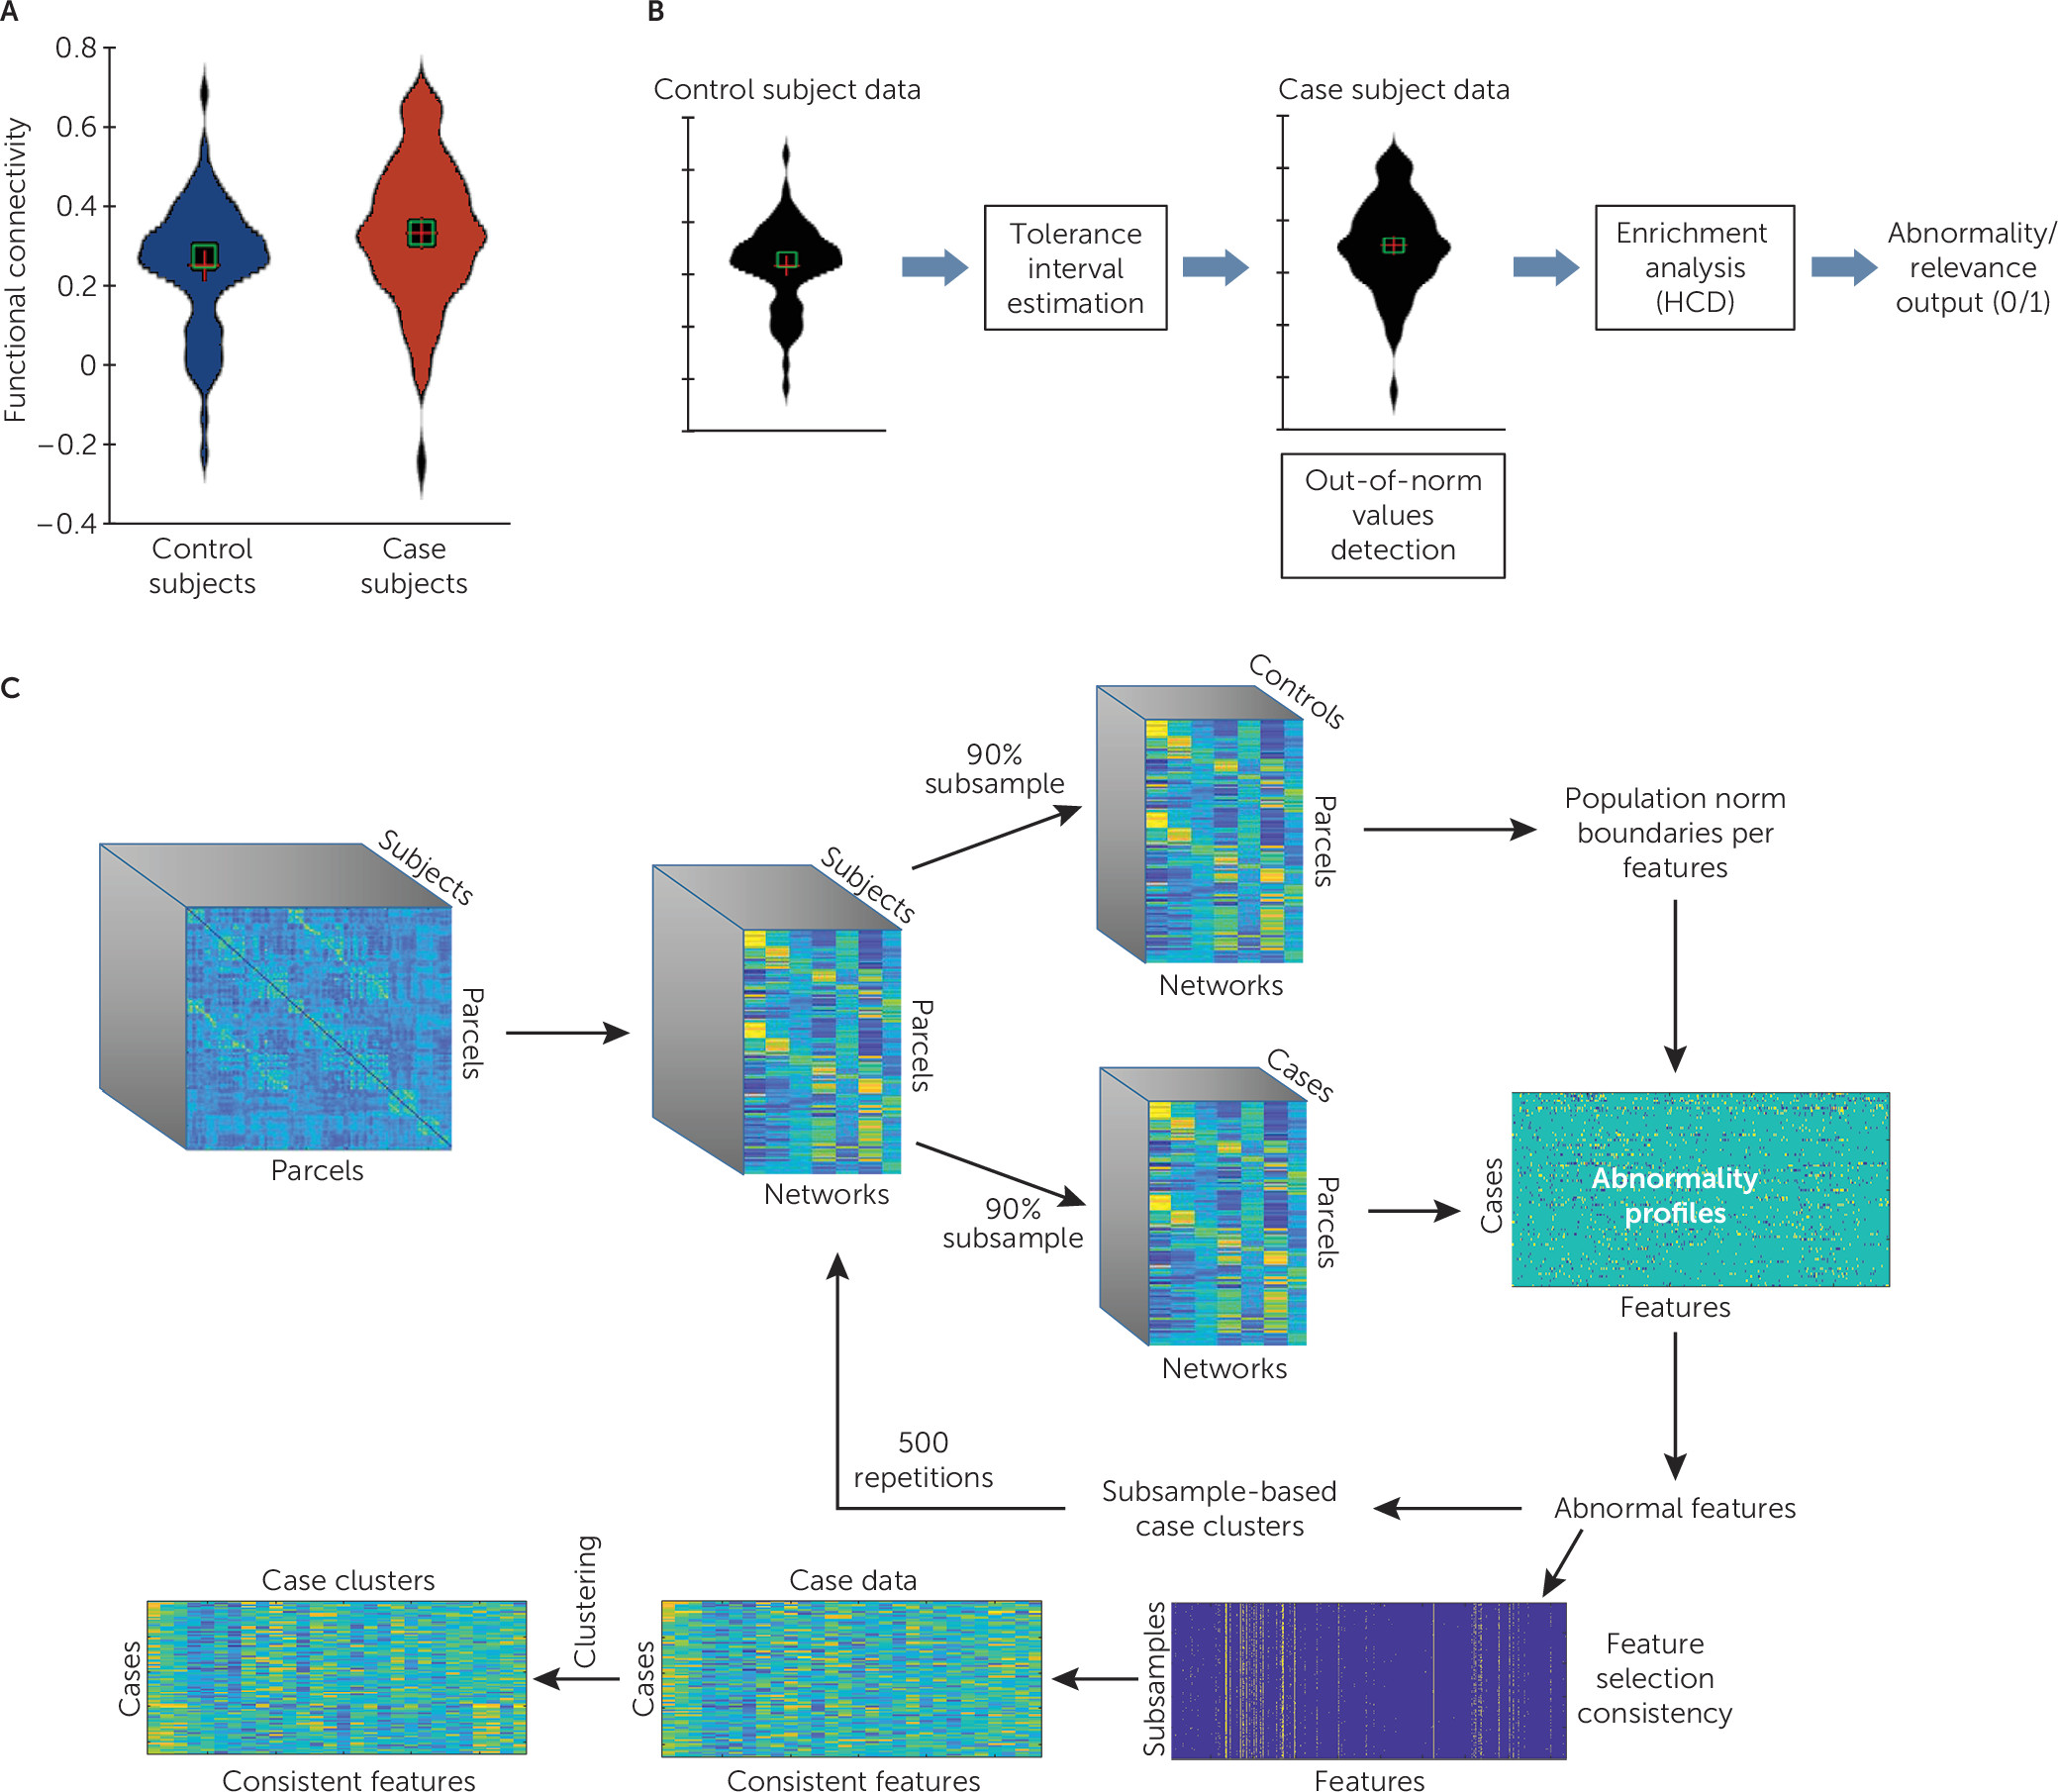
Figure 1A, where although the distributions are similar at the level of the mean, the feature seems to have high discriminability due to a much larger number of extreme values in one group. Identifying such features may hold great potential in studying heterogeneity within patient populations, especially because we expect extreme behavioral abnormalities to be driven by extreme or out-of-norm neurobiological patterns rather than small deviations from the mean. However, to the best of our knowledge, there is no off-the-shelf statistical test that captures this property.
In this study, we adopted a normative modeling approach to examine neurobiological heterogeneity within PTSD patients, using a tolerance interval–based method. A tolerance interval is an interval that covers a certain proportion of the population at a specific level of confidence. Tolerance intervals have been used in other areas of medicine for mapping individual abnormalities with respect to a reference population (
19,
20). (For more information on tolerance intervals, see the Supplementary Methods section in the
online supplement.) Here, we calculated tolerance intervals of rsfMRI connectivity features in a population of healthy control subjects and searched for features in which abnormal values are highly prevalent in PTSD case subjects. We used a large population of well-matched U.S. military Iraq and Afghanistan combat veterans, calculating tolerance intervals for healthy control subjects exposed to war zone trauma to determine the distribution of normative connectivity measures. We then identified connectivity features where abnormality was highly prevalent within a group of war zone–exposed veterans with PTSD who were not taking psychiatric medications. This second step is also called “enrichment analysis” because we are testing the enrichment of extreme values within cases. Finally, we applied a clustering analysis to identify biologically similar subgroups of patients with distinct patterns of abnormality. We validated the significance of these subgroups using internal cluster-stability analysis, as well as their relation to clinical and behavioral data. We also examined their utility in classification of PTSD cases.
Methods
Participants
The study involved 210 participants who were not taking psychiatric medications, including 97 with PTSD and 113 war zone–exposed healthy participants. All participants were combat veterans who had been deployed during Operation Iraqi Freedom (Iraq), Operation Enduring Freedom (Afghanistan), and Operation New Dawn. Participants were recruited and underwent scanning at either Stanford University or New York University after providing written informed consent. The study was approved by the universities’ institutional review boards, in accordance with the ethical principles in the Declaration of Helsinki. Psychiatric diagnoses were based on DSM-5 criteria using the Clinician-Administered PTSD Scale (CAPS; full or subthreshold PTSD) (
21). Diagnoses of other comorbid conditions, such as major depressive disorder, were assessed using the Structured Clinical Interview for DSM-IV. All diagnoses were confirmed in consensus clinician meetings. A history of traumatic brain injury (TBI) was determined by whether loss of consciousness occurred with a war zone–related head injury. General exclusion criteria for both groups included a lifetime history of psychotic or bipolar disorder or active substance dependence (within 3 months for case subjects, and lifetime for control subjects). Of the 210 participants, seven (four case subjects and three control subjects) were excluded for excessive motion in the scanner, and 11 (six case subjects and five control subjects) were excluded for insufficient image coverage. Our analysis covered the 192 remaining participants (see Table S1 in the
online supplement).
Clinical and Behavioral Assessments
Questionnaires and clinical scales.
Participants completed several self-report questionnaires. Quality of life was measured using the World Health Organization’s Quality of Life-BREF survey (
22), and symptoms of depression were measured using the Beck Depression Inventory–II (
23). IQ was estimated using the Wechsler Abbreviated Scale of Intelligence (
24). TBI was diagnosed if loss of consciousness occurred with head injury (
25).
Neurocognitive test battery.
We administered a standardized computer-based neurocognitive test battery (
26) to all participants. This battery, which we have used in research on depression (
9), assesses multiple cognitive domains, including memory, attention, response inhibition, flexibility, and processing speed as well as emotion identification and bias. Impairments in some of these domains are common in PTSD (
27). (For additional details, see the Supplementary Methods section in the
online supplement.)
fMRI Connectivity Feature Extraction
fMRI data acquisition and preprocessing are described in the Supplementary Methods section in the
online supplement. The mean time series was extracted for 133 brain regions based on a cortical parcellation of 100 parcels derived from an independent rsfMRI cohort (
28), which was combined with a set of 33 subcortical parcels that include 14 cerebellar parcels (
29), as well as 13 striatal parcels (
30), the right and left amygdala, the right and left hippocampus (
31), and the right and left thalamus (
32). More details about time series extraction is provided in the Supplementary Methods section in the
online supplement. Pairwise connectivity was calculated using Pearson correlation, and Fisher’s z-transformed connectivity values were averaged for each region to obtain a measure of connectivity to each of seven previously defined resting networks (
33) to further reduce data dimensionality. This resulted in a set of 931 connectivity strength values representing a whole-brain resting-state connectivity profile for each subject.
Identifying Abnormal rsfMRI Connectivity Features in PTSD Case Subjects
We used the “tolerance” package in R (
https://cran.r-project.org/web/packages/tolerance/tolerance.pdf) for nonparametric estimation of two-sided tolerance intervals for each node-to-network connectivity measure to obtain a range within which 90% (proportion=0.9) of the healthy control population is expected to fall, with a 10% confidence level (alpha=0.1). Parameters were chosen while accounting for the required sample size using the SSNORM function provided in the tolerance package to best suit the number of subjects. Next, informative features were selected based on enrichment in abnormality within PTSD cases. This process of enrichment analysis was done using the hypergeometric cumulative distribution function (
34). This function is often used in genomics for estimating the significance of enrichment of gene groups with previously identified genomic annotations (
34,
35). It has also been used in the field of neuroimaging for interpreting large-scale connectivity findings with respect to previously identified functional networks (
36,
37).
This process was repeated 500 times, with 90% of the subjects randomly subsampled each time to obtain for each feature the consistency rate, which represents the fraction of repetitions in which it was selected and is a reliable estimate of disorder relevance or abnormality. Analyses were performed while controlling for site, age, gender, years of education, and two subject-level motion variables (mean and maximum absolute displacement). This feature selection process is illustrated in
Figure 1.
Detecting Abnormality-Based Clusters Within PTSD Case Subjects
The CLICK clustering algorithm (
35) was used to search for clusters of PTSD cases across the subset of selected features, that is, features with a consistency rate exceeding a predefined threshold (70%).
Notably, because 70% was an arbitrary choice, we also examined the effect of varying this threshold. Importantly, CLICK determines the number of clusters based on the data and allows for unclustered elements. (For further details, see the Supplementary Methods section in the
online supplement.) The use of this type of advanced clustering approach allowed us to avoid “artificial” cluster detection in continuous data with no clear separation, as may happen through k-means clustering (which enforces a predefined number of clusters; CLICK allows for the existence of no or one cluster). Clustering was also performed within-loop for each of the subsampling iterations (i.e., 500 times), and stability was estimated based on the consistency of cluster co-occurrence for each pair of patients. More information on cluster stability estimation is provided in the Supplementary Methods section in the
online supplement. This entire process is illustrated in
Figure 1C.
Cluster Validation Using Clinical and Behavioral Measures
A nonparametric Wilcoxon rank sum statistical test was used to identify intercluster differences in clinical and behavioral assessments. We focused on a subset of 24 measures that are core clinical or self-report measures used for characterizing PTSD populations and 49 measures that represent the key behavioral metrics from the neurocognitive battery. Analyses were performed after regressing out age, gender, and education, while controlling for the false discovery rate (false-discovery-rate-corrected p<0.05).
Results
Consistently Selected Abnormal Connectivity Features
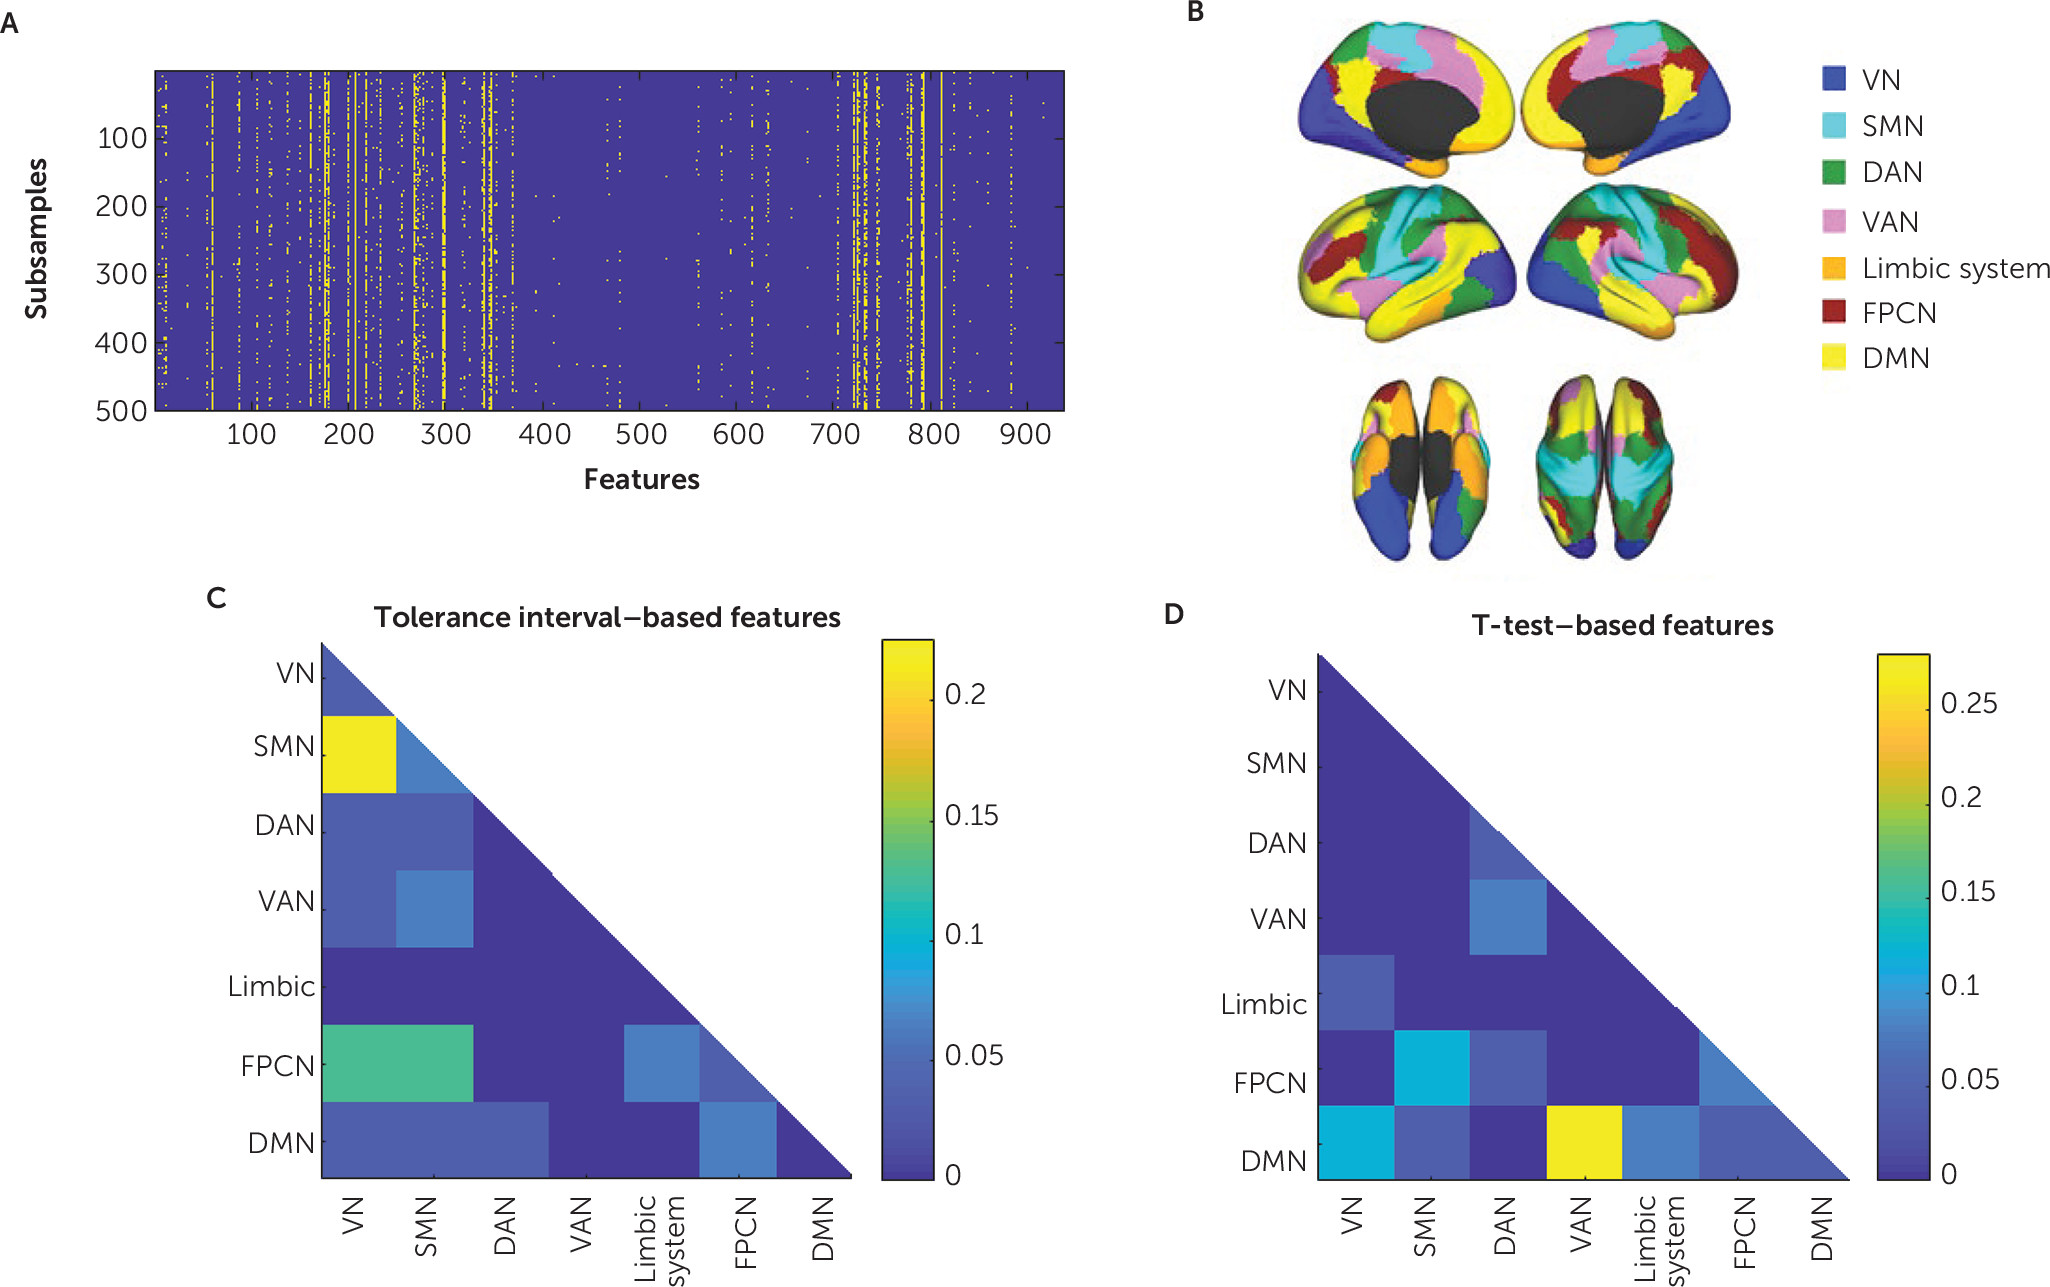
Feature selection was performed repeatedly in 500 subsamples, each containing 90% of the subjects. We recorded each feature’s consistency rate, that is, the proportion of subsamples in which it was identified as abnormal in case subjects (
Figure 2A). Of 931 features, 31 exhibited a consistency rate greater than 70% (
Figure 2). Abnormalities in connectivity patterns in case subjects with respect to healthy control subjects were evident mostly in connections between the frontoparietal control network and the sensorimotor and visual networks and between the sensorimotor network and the visual network (
Figure 2B and
2C). A more detailed visualization of each of the 31 consistently selected features is shown in Figure S1 in the
online supplement. As a point of comparison to our tolerance interval approach, we also used standard t tests for feature selection (p<0.05), yielding 28 features consistently selected in >70% of the runs, mostly of connections involving the default mode, frontoparietal control, and ventral attention networks (
Figure 2B and
2D). Notably, only three features from the set of abnormality-based features were also selected based on group-level t tests. It is thus evident that the kind of network features that were expected, based on previous comparisons of healthy and PTSD groups (
16–
18), were detected using a t test but not with the approach using the tolerance interval feature selection. Because the consistency rate threshold of 70% was an arbitrary choice, we also examined the effect of varying this threshold. The results are shown in Figure S2C and S2D in the
online supplement.
Clustering Patients Based on Abnormal Connectivity Features
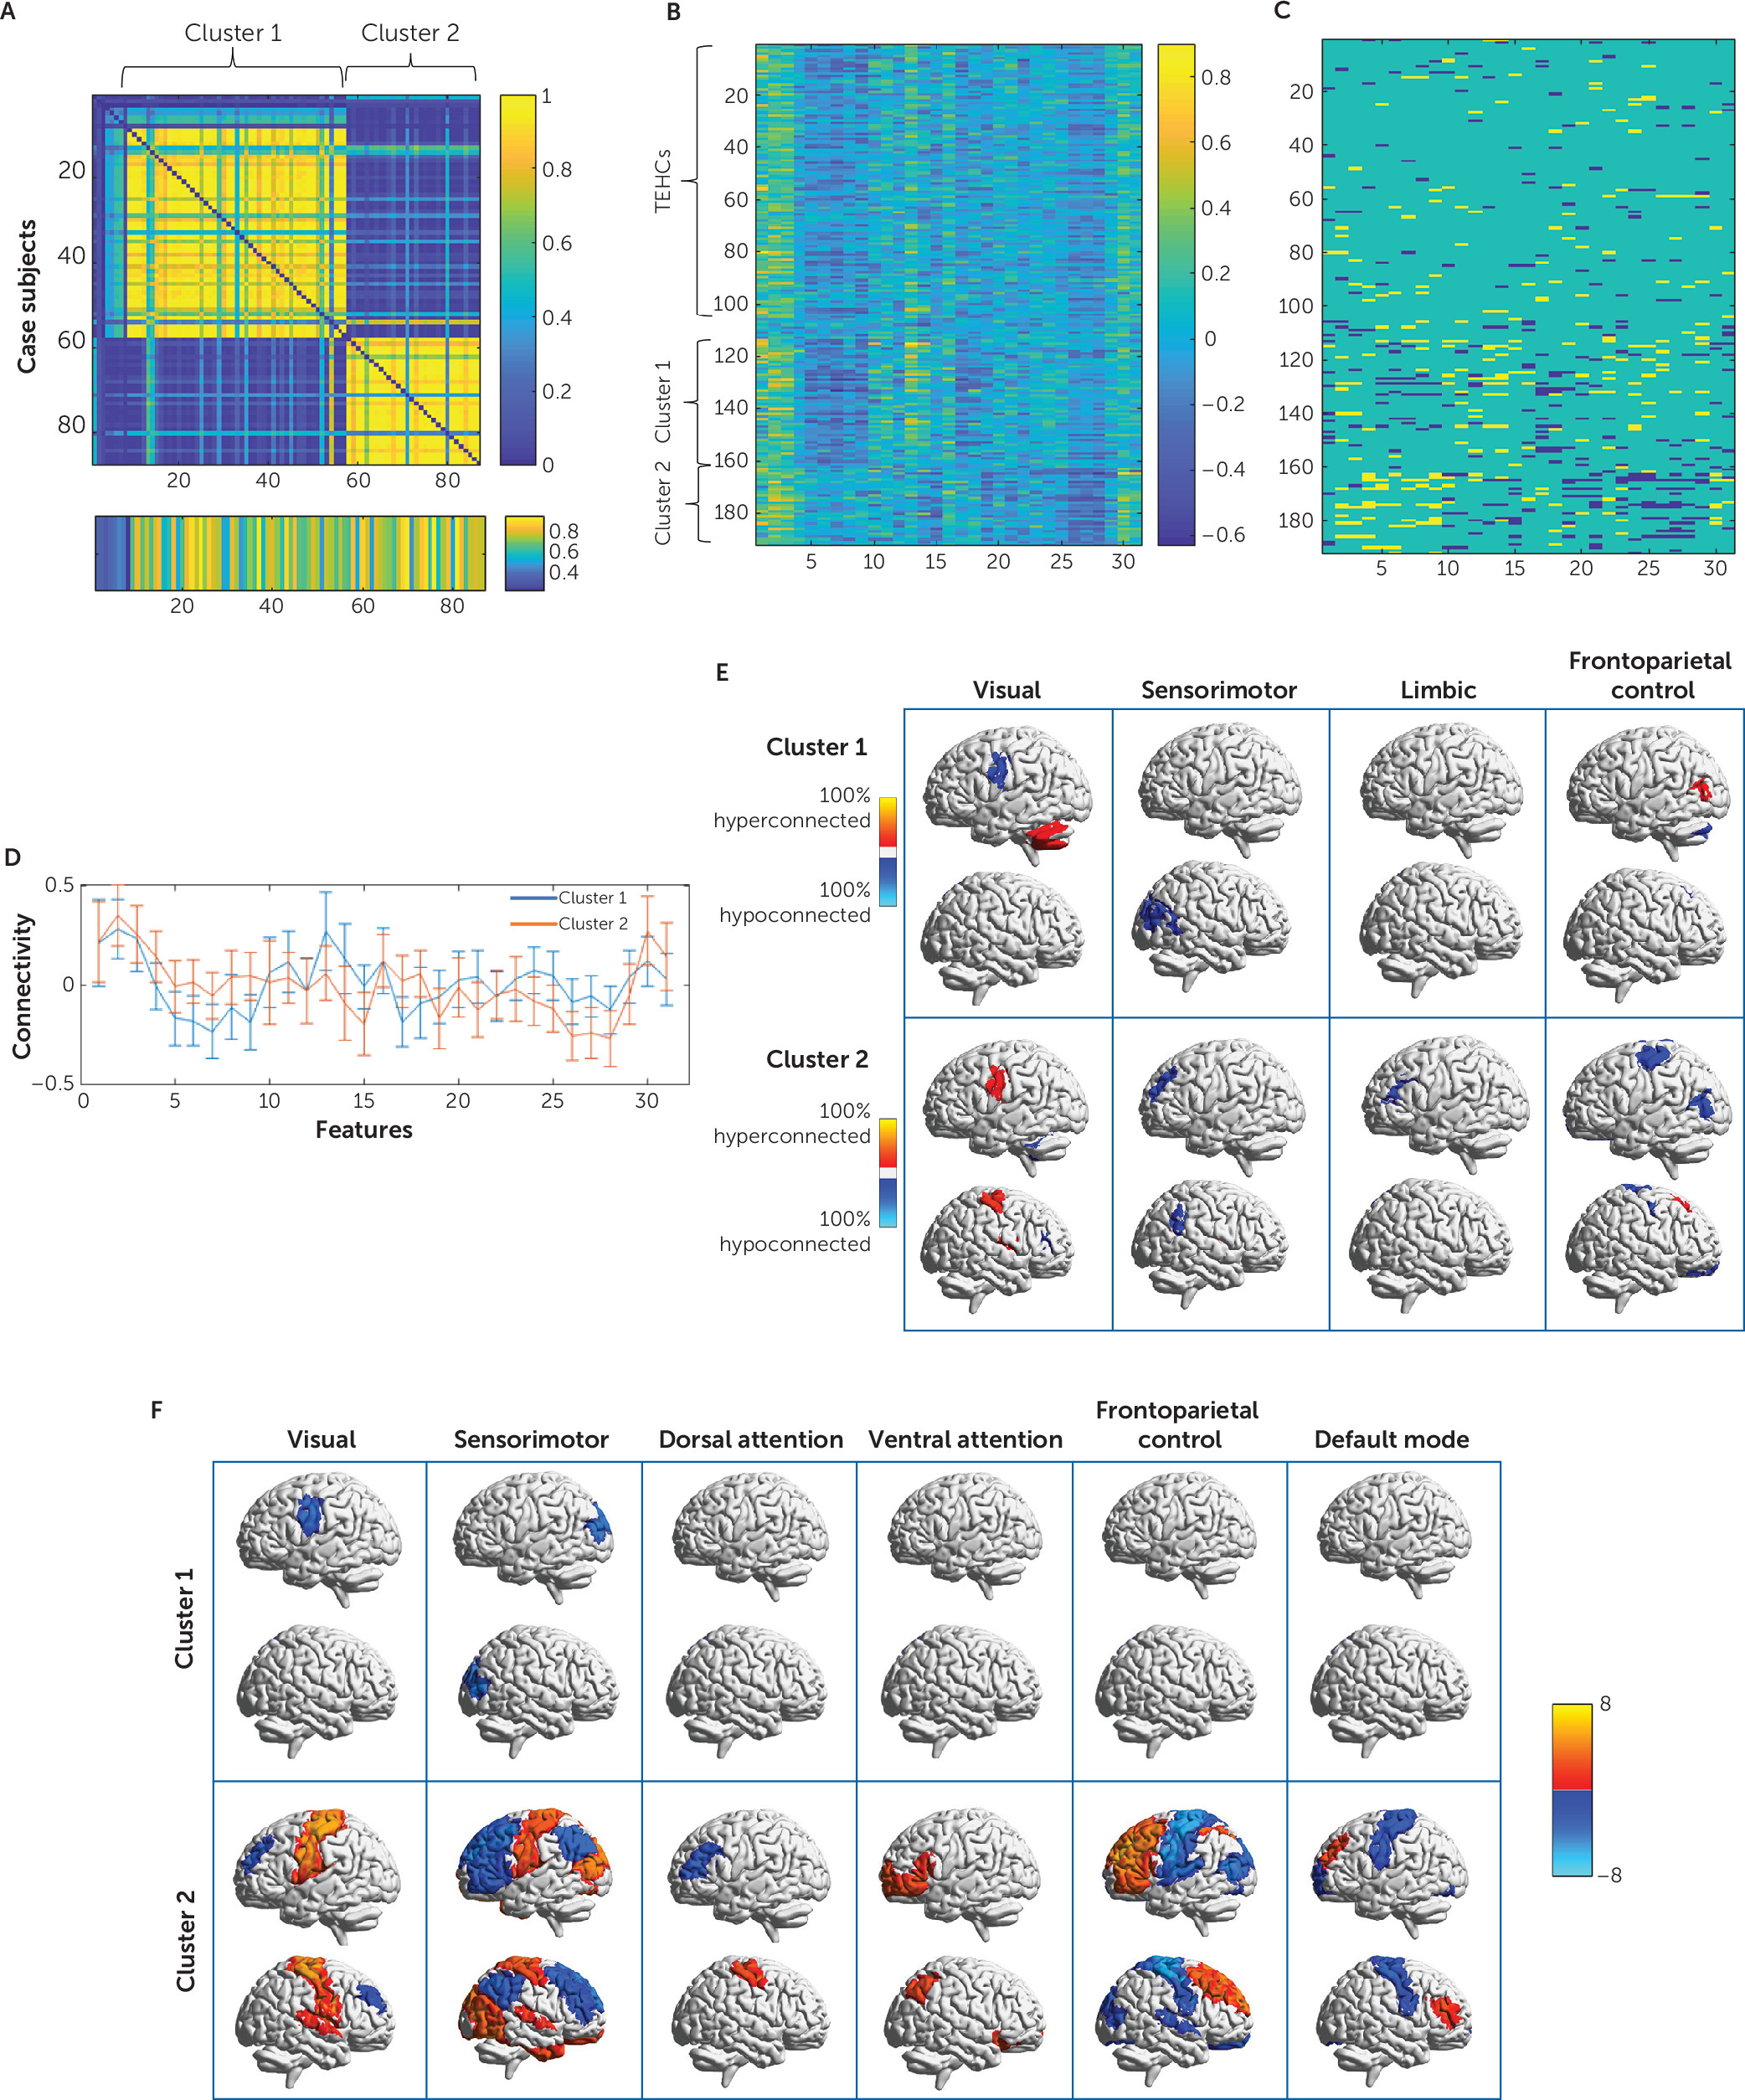
To identify subgroups of case subjects who share similar patterns of disorder-related connectivity abnormalities, we applied the CLICK clustering algorithm to all patients across the 31 connectivity features that were consistently identified as abnormal within patients with respect to healthy control subjects. This procedure identified two clusters. To estimate cluster stability, we also applied this procedure within each of the 500 subsampling iterations described above. Stability was estimated based on the consistency of cluster co-occurrence for each pair of patients across subsamples. The average patient co-occurrence matrix for the clustering solution is shown in
Figure 3A. It is evident that the stability of the clustering assignments across subsamples was very high. The matrix was summarized into a single stability index of 0.7068 (p<0.01). The two CLICK-identified clusters showed distinct connectivity-abnormality patterns (
Figure 3B through
3F). Cluster 1 (N=49) showed abnormally low connectivity between parcels of the visual and the sensorimotor networks, and cluster 2 (N=30) showed an opposite pattern of abnormally high connectivity between the visual and sensorimotor networks alongside an abnormally low connectivity between these two networks and the frontoparietal control network, within which the connectivity was also abnormally high (
Figure 3E). Demographic and clinical characteristics, as well as scan site and motion for each cluster, are presented in Table S2 in the
online supplement. Clusters did not differ significantly in site representation, age, gender, years of education, or subject-level motion in scanner. However, TBI prevalence was significantly higher in cluster 2 than in cluster 1.
To test the extent to which this clustering result is sensitive to parameter choice, we repeated the process of feature selection and clustering analysis across a range of tolerance interval alpha and tolerance interval proportion values and looked at features that were selected when averaging the consistency rate across a range of parameter values. This process yielded a set of nine features that had an average consistency rate of >70% and led to a similar two-cluster grouping with highly overlapping cluster content (agreement=72%; see Figure S2A and S2B in the online supplement). We also tested the effect of consistency rate threshold on the results by clustering across features selected using a threshold of 65%−90% in increments of 5%. Results show high consistency across thresholds (see Figure S2C and S2D in the online supplement).
Finally, for comparison, we also applied CLICK clustering to the PTSD case subjects using the features that were consistently selected by a two-sample t test. Here, too, we detected two clusters. However, these showed a lower stability across runs (see Figure S3A in the online supplement), with a stability index of 0.2641 and a low (52.9%) agreement with the clusters identified using tolerance intervals.
The utility of the identified clusters in case-control discrimination was tested using K-nearest-neighbor classification in a 10×10-fold cross-validation framework. The identified subgroups, but not the selected features, were useful and led to an improvement of more than 10% in classification accuracy. More details about this analysis and result are provided in the online supplement.
Clinical and Behavioral Correlates of the Abnormality-Defined Clusters
To examine the clinical and behavioral relevance of the identified abnormal connectivity patterns, we compared the two clusters on symptom and cognitive measures, correcting for the false discovery rate (see Table S2 in the
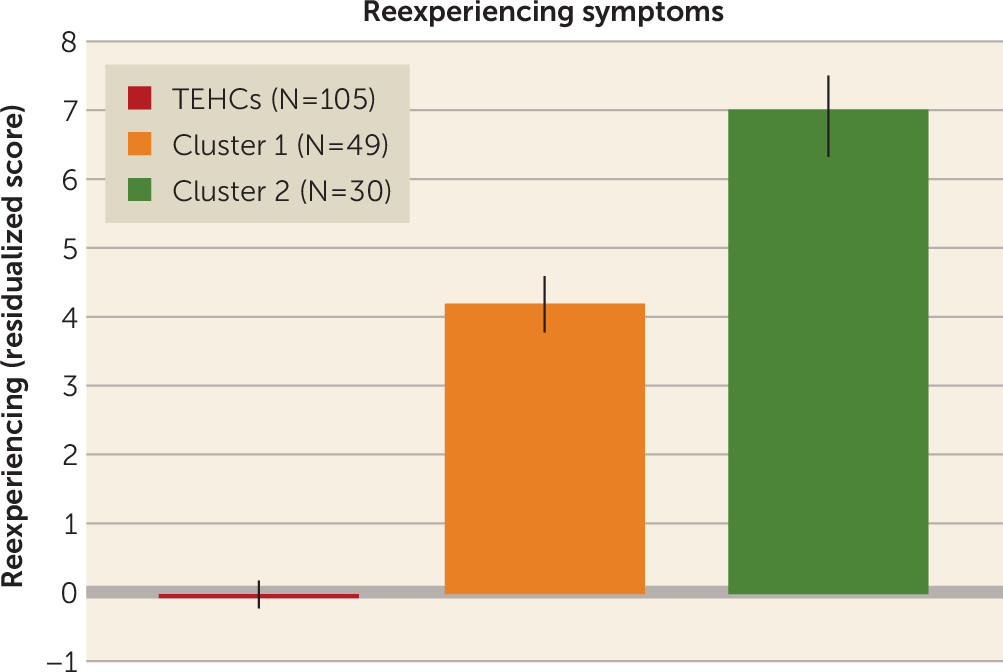
online supplement). We found a significant difference in the reported current level of reexperiencing symptoms (criterion B items in the CAPS), which were higher in cluster 2 than in cluster 1. As expected, both clusters showed higher levels of reexperiencing symptoms than were observed in control subjects. After this finding, we further examined the relationship between each of the 31 selected features and reexperiencing across patients and identified a marginally significant association with two of the features involving connectivity between the visual network and a node of the right-motor cortex, and between the sensorimotor network and a node located in the left prefrontal cortex. Results are summarized in
Figure 4.
We also found a marginally significant difference in performance in a choice reaction time task, a measure of information processing speed, such that reaction times were longer in members of cluster 2 than in members of cluster 1. Reaction time was also longer in members of cluster 2 compared with healthy control subjects. Of note, reaction times did not differ between cluster 1 members and control subjects.
With respect to psychiatric comorbidities, no significant difference was found between clusters in rates of major depressive disorder comorbidity. However, a significantly higher number of individuals with TBI comorbidity was found in cluster 2 (see Table S2 in the online supplement). Finally, we did not find clinical or behavioral differences between the two clusters identified on features that were consistently selected using a t test (false-discovery-rate-corrected p>0.05).
Cluster Discriminability Using Resting-State EEG Data
To further validate the finding that the identified clusters indeed reflect PTSD subtypes with distinct neurobiological correlates, we trained a nearest-neighbor model to distinguish between the two clusters using resting-state EEG power envelope connectivity features that were available for 35 patients from cluster 1, 20 from cluster 2, and 67 healthy control subjects. Performance was estimated using 10×10-fold cross-validation. Our classifier was able to distinguish between the two patient clusters with an accuracy of 68% (p<0.005), with a sensitivity of 73% in detecting cluster 2 and 62% in detecting cluster 1 (see Figure S3A and the Supplementary Methods section in the online supplement).
Discussion
We have identified two subgroups of PTSD case subjects characterized by different patterns of rsfMRI network connectivity abnormalities, with both clinical and neurocognitive relevance and with distinct neurophysiologic signatures. Equally important, the approach used here to detect disorder-related abnormal connectivity patterns can be generalized to other data sets, including nonimaging data (
6). Our work thus provides a proof of concept for an approach to biologically defined, data-driven subgroup detection in a way that may identify potentially high-value targets for personalized diagnosis or treatment.
Identified Abnormalities
The identification of features that may be most relevant for understanding heterogeneity in a clinical population is a fundamental challenge in studying complex disorders. Unlike other cases where this was done based on a priori regions of interest or on clinical data (e.g., reference
4), here we make no such a priori choices and use only the diagnostic labels (PTSD in comparison with control subjects) to identify a set of connectivity features with high-magnitude, individual-level abnormalities within subgroups of PTSD cases. Thus, we avoided bias from a restrictive focus on brain regions that are already thought to subserve the clinical condition but that may not provide the best avenue for subgroup identification. Indeed, the subgroups identified here involve brain regions not typically assumed to be central to PTSD. Likewise, by avoiding feature selection based on the correlation of features with clinical symptoms, we avoid bias from the arbitrariness of particular symptom-based conceptualizations of psychiatric disorders (
1,
39) while still allowing for the discovery of relationships to aspects of the clinical presentation.
The features identified in this study as abnormal in PTSD subgroups consist mostly of connectivity between the sensorimotor network and the frontoparietal and visual networks. Although abnormalities in frontoparietal connectivity and activity within PTSD cases have been reported in several studies (
16,
18), abnormalities in connectivity and activity of sensory motor and visual regions in this population have been reported more rarely (
17,
40,
41). These unexpected findings would not have been detected had we used a traditional hypothesis-driven approach for feature selection, focusing on networks that have been shown to differ in connectivity patterns in PTSD cases, such as the default mode or ventral attention networks (
16–
18). We suspect that the reason we did not detect the involvement of these networks in this study is that previous studies focused on mean differences between case and control subjects and did not specifically look for individual-level abnormalities within the PTSD group. This conclusion is underscored by the fact that many of the features detected when examining case-control differences using a two-sample t test feature selection strategy involved the default mode and ventral attention networks (
Figure 2D).
The Two Subgroups
The two different patterns of abnormalities in resting-state connectivity were associated with different clinical and cognitive phenotypes. Case subjects in cluster 2 reported higher levels of reexperiencing symptoms. Notably, although they represent one specific aspect of the disorder, reexperiencing symptoms were found to be a highly central component in a network analysis of CAPS symptoms in both acute and chronic PTSD, suggesting that these symptoms play a key role in shaping the clinical phenotype and presentation (
42). Moreover, the updated ICD-11 criteria for PTSD removed symptoms thought to be common to PTSD and other psychiatric disorders and focused on distinguishing symptoms, which notably include reexperiencing (
43). Our findings suggest a relationship between reexperiencing symptom severity and increased visual-sensorimotor functional connectivity alongside decreased connectivity between these two networks and the frontoparietal control network.
Although some studies have reported aberrations in visual and motor functions in PTSD (
41,
44–
46), to date, few studies have examined resting-state activity patterns of these two functional networks in the context of PTSD and stress (
47,
48); thus, it is hard to make any mechanistic hypothesis about the nature of this relationship. One piece of evidence, however, that links these functional connectivity abnormalities to psychopathology was reported recently (
49) in a study in which a multivariate data-driven approach was used to identify latent components linking a large set of clinical, cognitive, and personality measures to rsfMRI connectivity across 110 healthy control subjects and 114 patients spanning several types of psychopathology (schizophrenia, schizoaffective disorder, bipolar disorder, and attention deficit hyperactivity disorder). The study reported three psychopathology latent components, each associated with a unique rsfMRI connectivity pattern. While all three components involved connectivity alterations of the somatosensory-motor network, increased visual-sensorimotor connectivity alongside decreased connectivity between each of these networks and the frontoparietal control networks was associated with two of the three. The study did not include PTSD patients; however, it may be hypothesized that reexperiencing is related to increased levels of general distress that is reflected in the identified brain abnormalities of cluster 2 members. Furthermore, the suggestion that the two clusters indeed represent two biologically distinct subgroups is further supported by their discriminability using independently collected EEG data. Further work will be needed to understand the relevance of these subgroups to treatment outcome as well as their relevance to other measures.
Limitations
In this study, we focused on a population of primarily male veterans with war zone–related trauma. Alongside the advantage of using war zone–exposed healthy individuals as control subjects, we note that the lack of an additional control arm not exposed to trauma is a limitation of the study, as it leads to norms that do not represent the general healthy population. That said, it has been shown that many of the differences detected between PTSD case subjects and healthy control subjects are in fact also evident when comparing healthy controls based on trauma exposure in the absence of symptoms and that the differences also account for apparent distinctions between PTSD and control subjects (
50–
52). This may be related to the fact that healthy control subjects are individuals who are resilient to the psychological effects of trauma. The separate influence of trauma to normative functional connectivity patterns would be important to explore in future work. Furthermore, the extent to which the reported results can be generalized to different trauma-exposed populations, or to females, is unclear.
The limited sample size did not allow for a within-study external validation using a sample split. Although the EEG analyses can be viewed as exploratory validation outcomes of the fMRI-derived clusters, further investigation is needed to determine the generalizability of the identified abnormalities and clusters. Notably, the primary findings reported here relating the ability to identify a consistent set of features, and from there, clusters, were carefully tested for robustness. The method we used for abnormality detection is based on a mass univariate analysis and examines each data feature independently. Although a univariate approach yields more interpretable and translatable findings, it has the disadvantage of potentially missing patterns of abnormality that are multivariate in nature and can only be tracked using a multivariate approach.
Implications
First, our study provides a proof of concept for the utility of abnormality-based approaches in analyzing data from heterogeneous clinical populations. Doing so revealed a pattern of behavioral and clinical abnormalities that could not have been anticipated a priori, illustrating the critical need for an unbiased, data-driven approach for discovering subgroupings within the broader clinical diagnosis of PTSD (as well as in psychiatric disorders more broadly). Second, our study may now allow us to identify individuals as defined by their neurophysiology rather than by arbitrary clinical criteria, such that further mechanistic investigations of what processes are perturbed in these patients can be invested in more biologically homogeneous samples. Indeed, conflicting or negative findings in PTSD may be due to differences in the prevalence of these two clusters in the sample. Finally, it is important to note that interventions may differentially affect patients who are defined based on functional connectivity subgroups. For example, given the important role of the frontoparietal network in differentiating between the two clusters in our study, repetitive transcranial magnetic stimulation targeting the dorsolateral prefrontal cortex may result in different clinical outcomes in these two subgroups.
