Greater Variability of Excitatory Input Strength Across PVIs in Schizophrenia
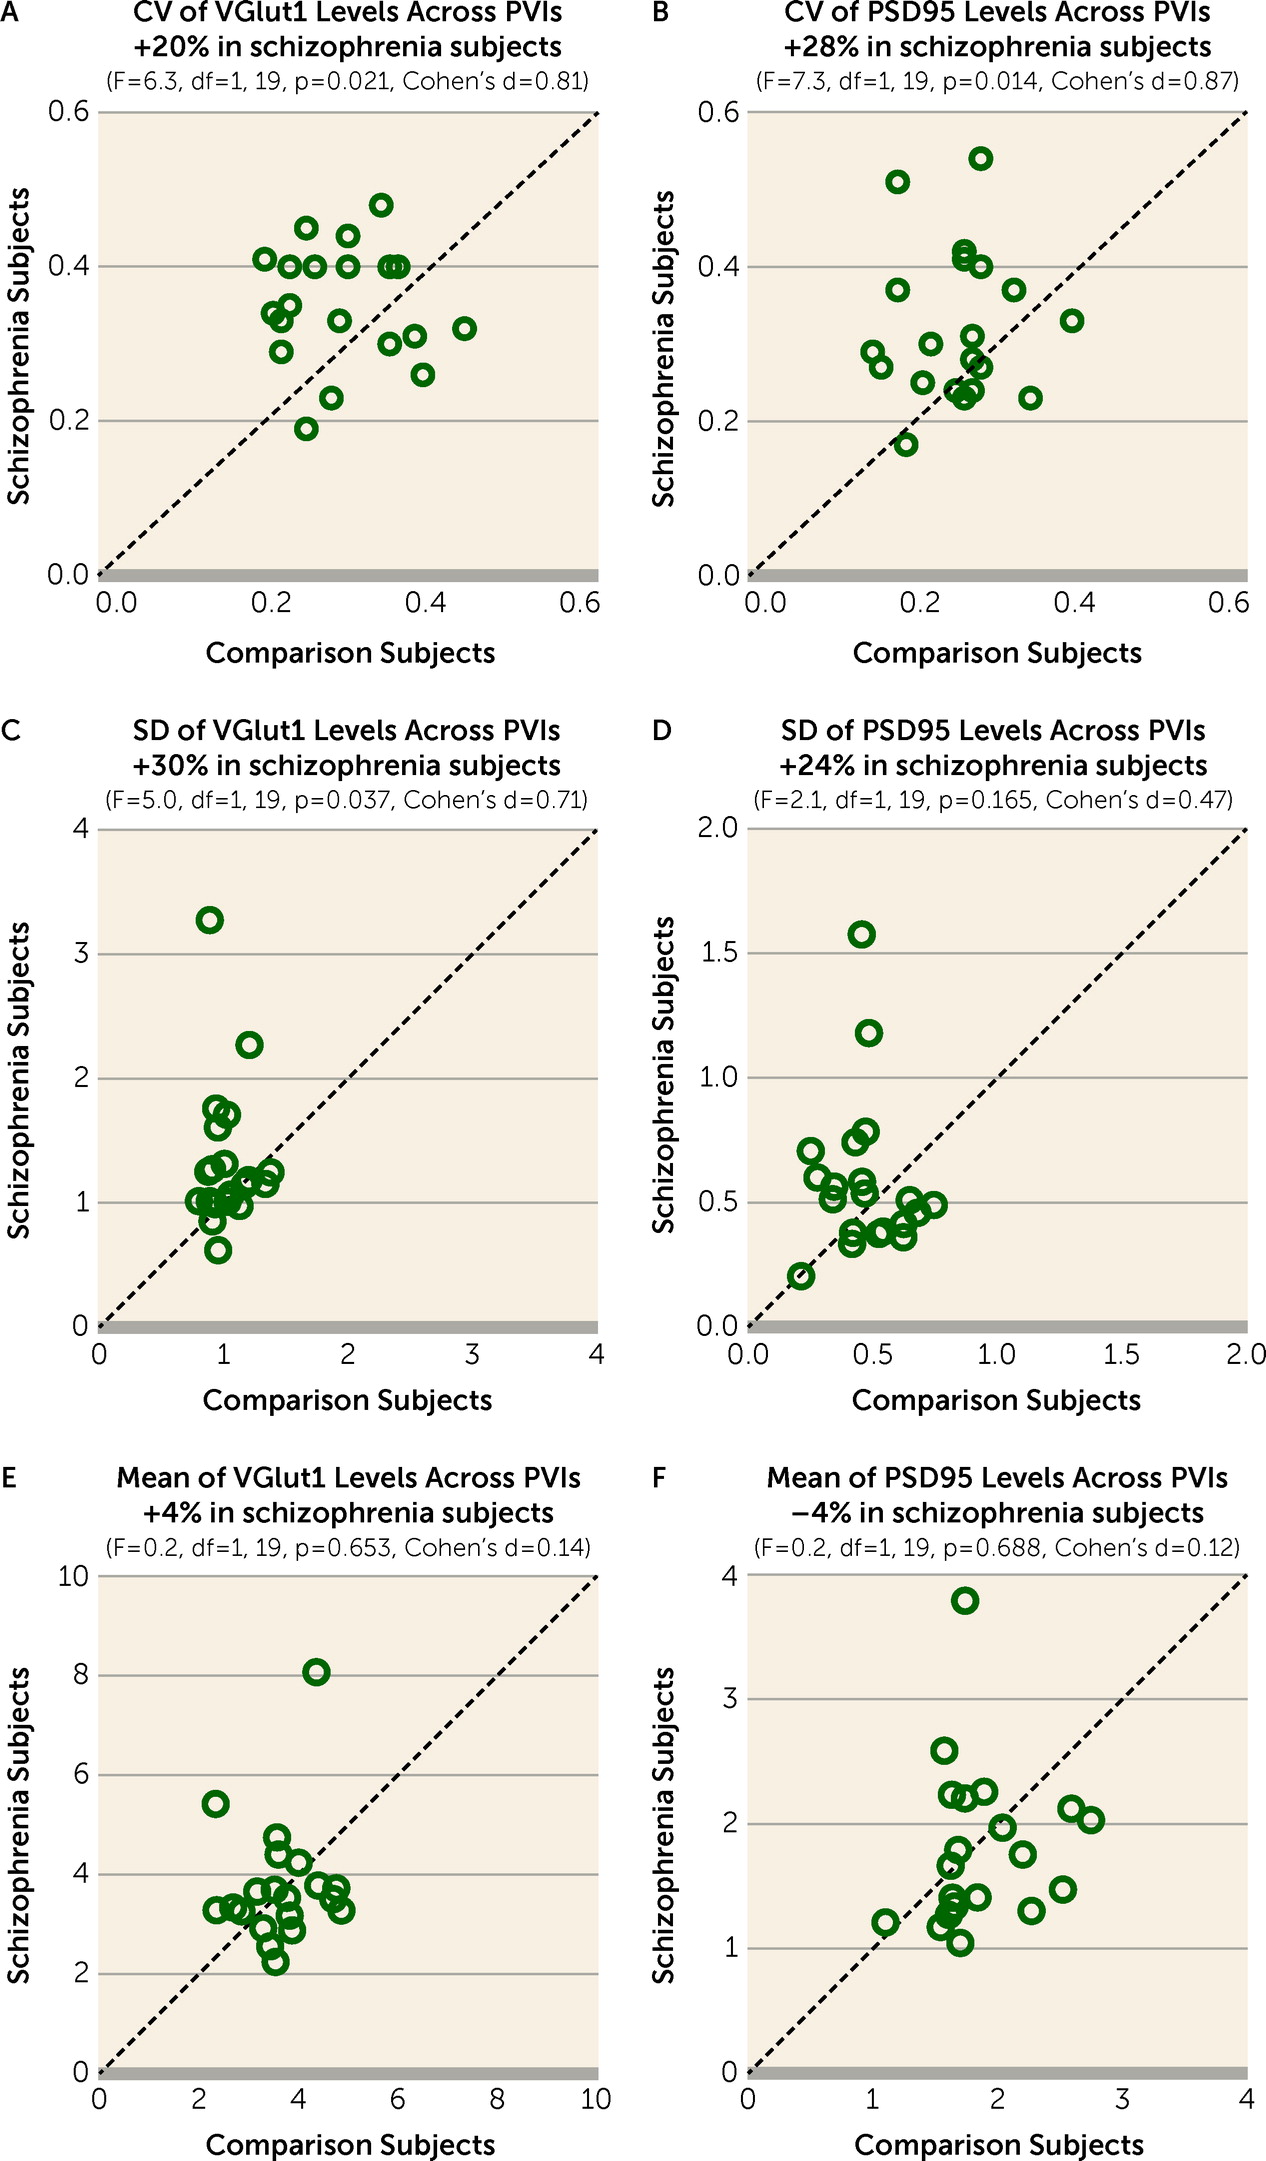
The CV of VGlut1 or PSD95 levels across PVIs was significantly higher by 20% (
Figure 2A) or 28% (
Figure 2B), respectively, in the PFC of schizophrenia relative to unaffected comparison subjects. The greater CV in schizophrenia was due to a higher standard deviation of VGlut1 and PSD95 levels (
Figure 2C,D), and not to differences in their mean values (
Figure 2E,F). These findings support the idea that schizophrenia is associated with greater variability in excitatory synaptic strength across PVIs in the PFC.
Next, we investigated whether greater synaptic variability across PVIs in schizophrenia might be due to other factors commonly associated with the illness. Neither diagnosis of schizoaffective disorder; nor history of substance abuse or nicotine use at the time of death; nor use of antidepressants, benzodiazepines, or valproic acid at the time of death; nor death by suicide had a significant effect on the CV of VGlut1 or PSD95 levels across PVIs among schizophrenia subjects (see Figure S2 in the
online supplement). Moreover, the CV of VGlut1 or PSD95 levels across PVIs did not differ between monkeys chronically exposed to olanzapine or sham treatment, although the CV of VGlut1 appeared to be lower in monkeys exposed to haloperidol, perhaps suggesting a normalizing effect of this medication on the variability of excitatory synaptic strength onto PVIs (see Figure S3 in the
online supplement). These findings suggest the absence of effects from comorbid factors or antipsychotic medications on greater synaptic variability across PVIs in schizophrenia.
Finally, we assessed variability in excitatory synaptic strength across calretinin neurons, a subclass of inhibitory neurons that do not share local excitatory inputs with PVIs (
11,
44) and do not directly contribute to the generation of gamma oscillations (
31,
32). The CV of VGlut1 or PSD95 levels across calretinin neurons did not significantly differ between subject groups (see Figure S4A,B in the
online supplement). These findings suggest that variability in excitatory synaptic strength is not altered across calretinin neurons in schizophrenia, consistent with previous studies demonstrating that these neurons are relatively unaffected in the illness (
28,
42,
45–
47).
Simulated Effect of Greater Synaptic Variability Across PVIs on Prefrontal Gamma Power
Based on these findings of greater variability in excitatory synaptic strength across PVIs in schizophrenia, we explored how synaptic variability affects the generation of gamma oscillations in a computational model network of regular-spiking excitatory (RSEs) and fast-spiking inhibitory (FSIs) neurons that can robustly generate network gamma oscillations (
Figure 1A–D). We first characterized how changes in mean excitatory synaptic strength from RSEs to FSIs (ḡ
ei) influence gamma power in our model network when variability in excitatory synaptic strength across individual FSIs (CV
g) is 0. Gamma power sharply increased as ḡ
ei increased from 0 and reached a peak at ḡ
ei=2, which was maintained as ḡ
ei was further increased from 2 to 4 (
Figure 1E). Gamma power sharply decreased with ḡ
ei>4 and reached a stable nadir at ḡ
ei≥7. Thus, our model network replicated the inverted U relationship between ḡ
ei and gamma power observed in a previous study (
48).
Next, we assessed how shifts in CV
g regulate gamma power in the model network. To simulate biologically relevant shifts in CV
g, we utilized the VGlut1 and PSD95 levels within excitatory inputs to PVIs in our 20-pair human cohort. To obtain a single molecular index to model excitatory synaptic strength onto each FSI (g
ei), the mean VGlut1 and the mean PSD95 levels, measures of synaptic strength in pre- and postsynaptic compartments (
29,
30), respectively, at excitatory inputs onto each PVI were summed (VGlut1 + PSD95 levels). The mean VGlut1 levels and the mean PSD95 levels within excitatory inputs onto PVIs (N=723) sampled from all 40 subjects were significantly positively correlated (
Figure 3A), supporting the use of a single index to simulate g
ei. Further analyses showed that the VGlut1 + PSD95 levels onto each PVI sampled from comparison subjects conformed to a normal distribution (
Figure 3B) (Shapiro-Wilk test: W=4.7, p=0.062), whereas those sampled from schizophrenia subjects had a distribution with skewness of 1.58 and kurtosis of 7.57 (
Figure 3C) (Shapiro-Wilk test: W=0.8, p<0.001). Also, the mean for the CV of VGlut1 + PSD95 levels across PVIs was 0.24 (SD=0.05) in unaffected comparison subjects and 0.30 (SD=0.07) in schizophrenia subjects. Finally, the CV of VGlut1 + PSD95 levels across PVIs ranged from 0.1 to 0.5 across all subjects (
Figure 3D). Based on these empirical findings, we generated values for g
ei from either a normal distribution for comparison subjects (
Figure 3E) or a skewed distribution for schizophrenia subjects (
Figure 3F). In each distribution, we varied the standard deviation without changing the mean value to introduce shifts in CV
g from 0.1 to 0.5 in the model network.
We first assessed how CV
g generated from the normal distribution regulates gamma power and frequency. Shifting CV
g from 0.1 to 0.5 progressively reduced peak gamma power (
Figure 4A) but had a minimal effect on peak gamma frequency (
Figure 4B). The effect of CV
g on gamma power was observed over a wide range of background noise levels (see Figure S5 in the
online supplement), demonstrating that the effect of CV
g on gamma power is robust to noise in the model network. Furthermore, CV
g generated from the skewed distribution showed differences of similar magnitudes in peak gamma power and frequency (see Figure S6 in the
online supplement), suggesting that the effect of CV
g is comparable between the distributions found in the comparison and schizophrenia subject groups. Based on these findings, CV
g generated from the normal distribution was used for subsequent analyses.
Finally, to investigate the network properties affected by CV
g, we assessed the effect of CV
g on network synchrony and activity, measured by the coefficient of variation of the interspike interval (CVISI) and the firing rates, respectively, of RSEs and FSIs. Shifting CV
g from 0.1 to 0.5 increased the CVISI of RSEs and FSIs (
Figure 4C) but had minimal effect on the firing rates of RSEs and FSIs (
Figure 4D). Together, these findings demonstrate that CV
g regulates gamma power by affecting the synchrony, while minimally affecting the activity, of the model network.
Simulated Interaction Between Greater Synaptic Variability and Other Synaptic Alterations in PVIs
These simulations suggested that lower prefrontal gamma power in schizophrenia could be due in part to greater synaptic variability across PVIs. Previous studies have shown alterations in other synaptic parameters of PVIs that may also contribute to lower prefrontal gamma power in schizophrenia. Thus, we utilized the model network to explore the impact of alterations in these synaptic parameters on gamma power and the interaction of these parameters with synaptic variability in the regulation of gamma power.
We first assessed how our model network simulated the effect of two synaptic alterations in PVIs previously reported in the PFC of subjects with schizophrenia. For example, the mean density of excitatory inputs onto PVIs in the PFC was reported to be 18% lower in schizophrenia (
28). Also, decreasing excitatory drive to PVIs was shown to lower cortical gamma power in animal models (
17,
49). Thus, we assessed how a lower mean probability of excitatory synapse connectivity on FSIs (Conn
ei) affects gamma power in the model network (
Figure 5A). At CV
g=0, maximal gamma power occurred at Conn
ei=1. Gamma power progressively declined to very low levels as Conn
ei decreased from 1 to 0.4 and reached a stable nadir at Conn
ei≤0.4. Thus, decreasing Conn
ei in the model network provided proof-of-concept evidence that fewer excitatory inputs to PVIs in schizophrenia could result in lower prefrontal gamma power.
Previous studies had reported that mean protein and mRNA levels of the GABA-synthesizing enzyme glutamic acid decarboxylase 67 (GAD67), a marker for GABA conductance, were 10% to 30% lower in the PFC of subjects with schizophrenia (
50–
53). Also, decreasing GABA conductance to pyramidal neurons was shown to lower cortical gamma power in animal models (
54,
55). Thus, we assessed in the model network the effect of lower mean GABA conductance (ḡ
ie) from FSIs to RSEs on gamma power. At CV
g=0, maximal gamma power occurred at ḡ
ie=0.8, with ḡ
ie and gamma power forming an inverted U relationship (
Figure 5B). Thus, decreasing ḡ
ie from 0.8 (i.e., shift from the peak to the left side of the inverted U) in the model network provided proof-of-concept evidence that lower GABA conductance from PVIs to pyramidal neurons, secondary to less GABA synthesis due to lower GAD67 levels, could result in lower prefrontal gamma power in schizophrenia.
Finally, we assessed whether greater CV
g, lower Conn
ei, and lower ḡ
ie interact to regulate gamma power in the model network. In this simulation, we utilized empirical findings from the previous and present postmortem studies of schizophrenia to simulate disease-relevant alterations in each parameter as follows: 1) CV
g was increased from 0.24 to 0.30 to reflect the observed greater value of CV of VGlut1 + PSD95 levels across PVIs in schizophrenia relative to unaffected comparison subjects (see Results above); 2) Conn
ei was decreased from 1 to 0.82 to reflect the 18% lower mean density of excitatory inputs to PVIs in schizophrenia (
28); and 3) ḡ
ie was decreased from 0.8 to 0.72 to reflect a 10% lower mean level of GAD67 in schizophrenia, which represents the smallest mean difference reported in previous studies (
50–
53). Simulations showed that these changes in CV
g, Conn
ei, and ḡ
ie individually reduced gamma power by 4%, 5%, and 3%, respectively (
Figure 5C). Consequently, the additive effect of all these parameter changes would be expected to be a 12% reduction in gamma power. However, when combined in the model network, these differences in CV
g, Conn
ei, and ḡ
ie reduced gamma power by 44% (
Figure 5C), demonstrating a synergistic interaction among these synaptic parameters. Thus, these simulations suggest that modest alterations in multiple synaptic parameters of PVIs might interact synergistically to produce a substantial reduction in prefrontal gamma power in schizophrenia.


