Epidemiological surveys of autism were first initiated in the mid-1960s in England and have since been conducted in more than 30 countries. In this chapter, we provide a comprehensive review of the findings and methodological features of published epidemiological surveys regarding the prevalence of ASD. This chapter builds upon previous reviews (Hill et al. 2014; Myers et al. 2018) and addresses two specific questions:
1.
What is the range of prevalence estimates for ASD?
2.
How should time trends in ASD prevalence be interpreted?

Study Design and Methodological Issues

Epidemiologists use several measures of disease occurrence, including incidence, cumulative incidence, and prevalence. Prevalence is used in ASD cross-sectional surveys (in which there is no passage of time) and reflects the proportion of subjects in a given population who have the disease at that point in time. When designing a prevalence study, three elements are critical: case definition, case identification (or ascertainment), and case evaluation methods (Fombonne 2017).

Case Definition

Starting with Kanner (1943), case definitions of autism have progressively broadened to include Rutter’s (1970) criteria and subsequently the ICD-10 (World Health Organization 1992) and DSM-IV-TR (American Psychiatric Association 2000). However, ASD in DSM-5 (American Psychiatric Association 2013) narrowed the concept.

Case Identification or Ascertainment

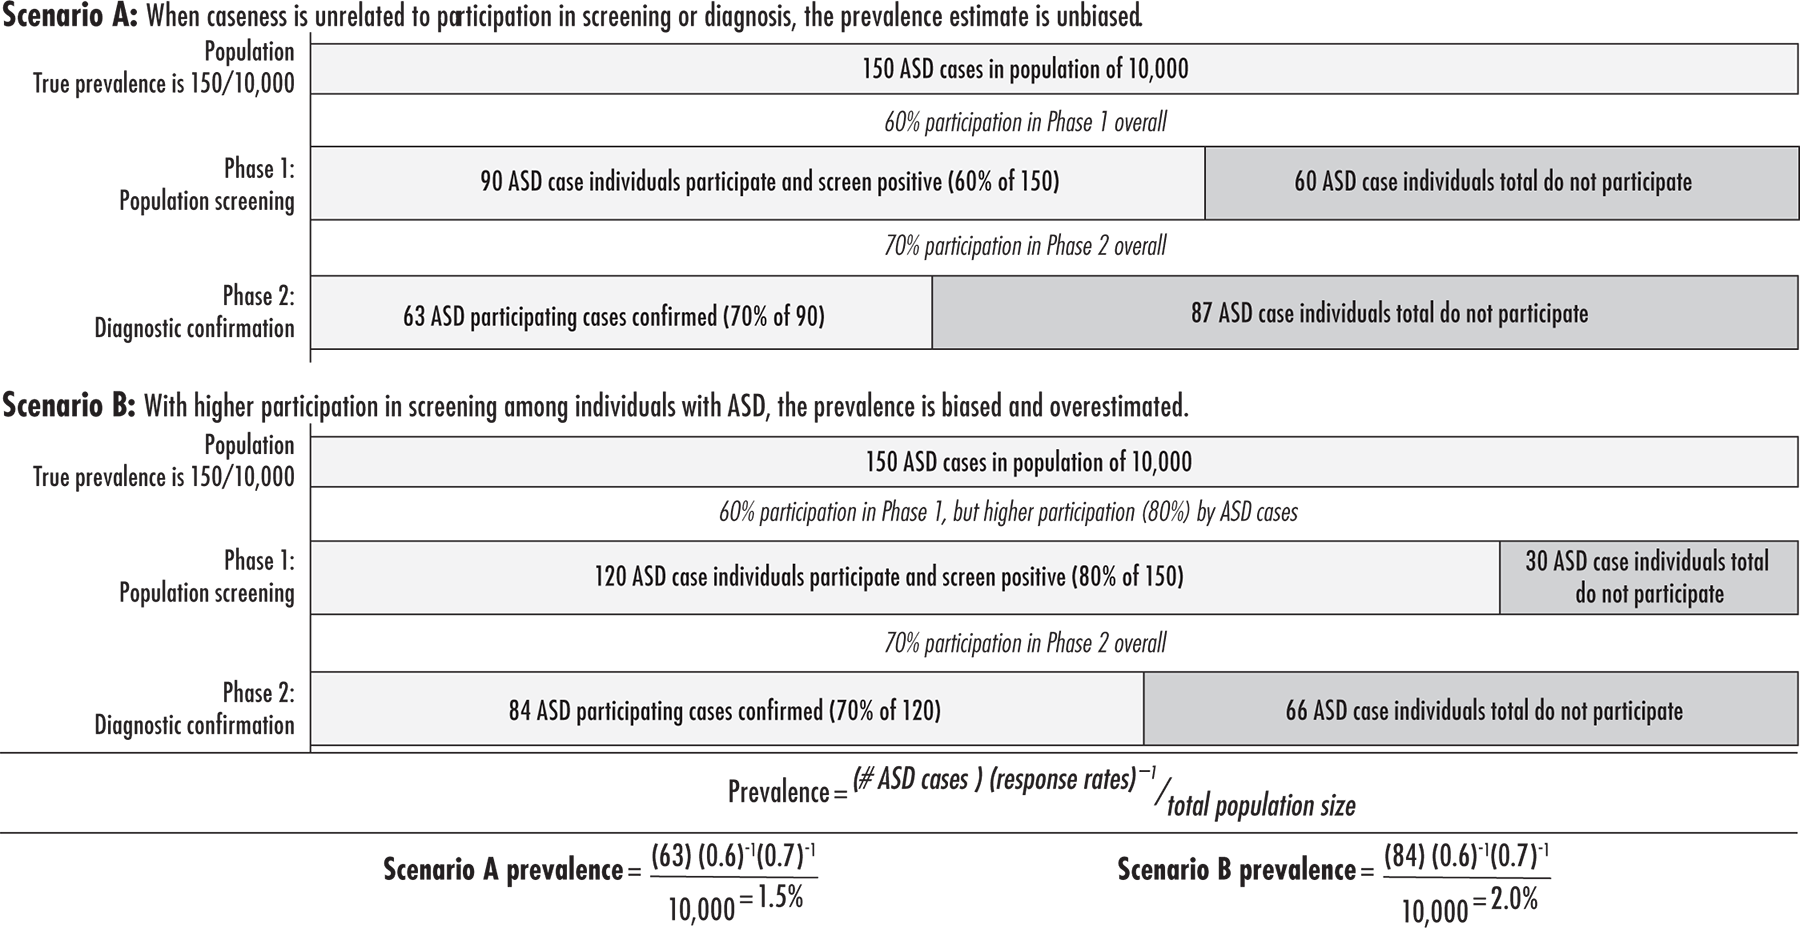
When a population is identified for a survey, different strategies are employed to find individuals matching the study case definition. Some studies rely solely on service-provider databases or national registers for case identification; these have a common limitation of relying on samples already identified and diagnosed. Persons with the disorder who are yet undiagnosed are not counted as cases, leading to prevalence underestimation—a particular problem in communities with few available services. Other investigations rely on a multistage approach to identify cases. In a first screening stage, a wide net is cast to identify possible ASD cases, with the final diagnostic status being determined at subsequent stages. This process often consists of sending letters or screeners to school and health professionals, searching for possible cases of ASD. Systematic sampling techniques that would ensure near-complete coverage of the population are seldom used, and screening varies substantially in the data sources ascertained. Surveyed areas also often differ in terms of educational or health care systems. Finally, uneven participation rates in the screening stage can lead to variation in screening efficiency and bias in prevalence estimation, as illustrated in the hypothetical example of Figure 1–1.
The sensitivity of the screening methodology is difficult to gauge in surveys because the proportion of children truly affected with the disorder but not identified at the screening stage (false-negatives) remains generally unmeasured. Random sampling of screen-negative subjects to adjust estimates is not routinely performed because the low frequency of ASD makes such a strategy both imprecise and costly. For example, the surveys conducted by the Centers for Disease Control and Prevention (CDC) rely, for case ascertainment, on scrutinizing educational and medical records. Children without such records cannot be included. Although surveys that systematically screen the general school population have consistently detected pools of unidentified cases (Alshaban et al. 2019; Fombonne et al. 2016; Kim et al. 2011), the relative contribution of that group to the total prevalence pool varies.
Refinements to this component of autism survey methodology are needed in future studies. Of note, the CDC methodology identifies about 20% of previously undiagnosed ASD cases (Baio et al. 2018), suggesting that underidentification is a widespread phenomenon. Because recent prevalence studies suggest that ASD can no longer be regarded as rare, estimation of false-negatives has become a necessary strategy. Currently, the prevalence estimates of most surveys are likely underestimates of the “true” prevalence rates, with the magnitude of this underestimation remaining unknown.
This assumes a true ASD prevalence of 150 per 10,000, a sensitivity of 100% for the screening process, and total accuracy in the diagnostic confirmation, weighting back phase-2 data results in an unbiased prevalence estimate when caseness is unrelated to participation in screening (Scenario A). However, when participation in screening is more likely for participants with ASD than for participants without ASD (Scenario B), prevalence will be overestimated.
Figure 1–1. Effect of differential participation in the screening stage on prevalence estimates.

Case Evaluation

After screening, screen-positive participants undergo a more in-depth diagnostic evaluation to confirm case status. The information used to determine diagnosis usually combines data from informants (e.g., parents, teachers, pediatricians) and other sources (e.g., medical records, educational sources), with direct assessment of the person with autism offered in some but not all studies. When subjects are directly examined, assessment methods vary from an unstructured examination by a clinical expert (but without demonstrated psychometric properties) to the use of batteries of standardized measures (e.g., Autism Diagnostic Interview–Revised [Lord et al. 1994], Autism Diagnostic Observation Schedule [Lord et al. 1989]). Many of these tools are also being adapted to be culturally appropriate for non-Western countries (Arora et al. 2018; Raina et al. 2015; Sun et al. 2019).
Obviously, surveys of very large populations (e.g., CDC surveys in the United States) or of national registers (e.g., Idring et al. 2012 in Sweden) cannot include direct diagnostic assessment of all participants. In those instances, the validity of diagnoses is evaluated in small, randomly selected subsamples who are given a more complete diagnostic workup (Rice et al. 2007).

Systematic Review of Prevalence Estimates

For earlier surveys (before 2000), we refer interested readers to reviews of surveys performed between 1966 and 2000 (Fombonne 2003; Hill et al. 2014).

Surveys Since 2000: Search Strategies

These surveys were identified from previous reviews (Elsabbagh et al. 2012; Fombonne et al. 2011; Hill et al. 2014) and through systematic searches using major scientific literature databases (Medline, PsycINFO, Embase, PubMed). When multiple surveys were based on the same or overlapping populations, the most detailed and comprehensive account was retained. For example, surveys conducted by the CDC are included in the chapter appendix, although additional accounts for individual states are available elsewhere. Criteria for inclusion in this review were 1) full article published in English; 2) a target population size of at least 5,000; and 3) independent validation of caseness by professionals. From published articles, we abstracted information about country and area of the survey, population size, participant age range, number of children affected, diagnostic criteria used in case definition, and prevalence estimate (per 10,000). We also report, when available, sex ratios and the proportion of individuals with an IQ in the normal range.

Prevalence Estimates for ASD Since 2000
The results of the 71 surveys meeting these criteria are summarized in the chapter appendix. Most (54%) were published in 2011 or later. Studies were performed in 25 different countries, with several countries contributing multiple studies (including 15 studies in the United Kingdom and 17 in the United States, with 10 published by the CDC). Sample sizes ranged from 3,9641 to 4.25 million (median 56,946), and participant ages ranged from 0 to 98 years (median 8 years). Two studies, both in England, specifically focused on adults and provided the only prevalence estimates thus far available for adults: 98.2 and 110 per 10,000 (Brugha et al. 2011, 2016). Surveys focusing on toddlers (Hoang et al. 2019; Nygren et al. 2012) and preschoolers (Christensen et al. 2019; Nicholas et al. 2009; Yang et al. 2015) together provided a mean estimate of 136 per 10,000.
The diagnostic criteria used reflected the reliance on modern diagnostic schemes (15 studies used ICD-10; 41 used DSM; 9 used both). Assessments were often performed with standardized diagnostic measures. Use of DSM-5 in recent surveys has resulted in lower prevalence than in surveys using DSM-IV or DSM-IV-TR (American Psychiatric Association 1994; Kim et al. 2014; Kulage et al. 2020; Maenner et al. 2014). In the most recent CDC study (Baio et al. 2018), there was an 86% overlap of diagnoses and only a 4% loss of ASD diagnosis between the case definitions in DSM-IV-TR and DSM-5, although this small effect could result from grandfathering existing pervasive developmental disorder diagnoses into the new DSM-5 criteria. This approach has been criticized by Fombonne (2018), who showed that, in that survey, use of DSM-5 criteria resulted in an 18% reduction in prevalence compared with DSM-IV.
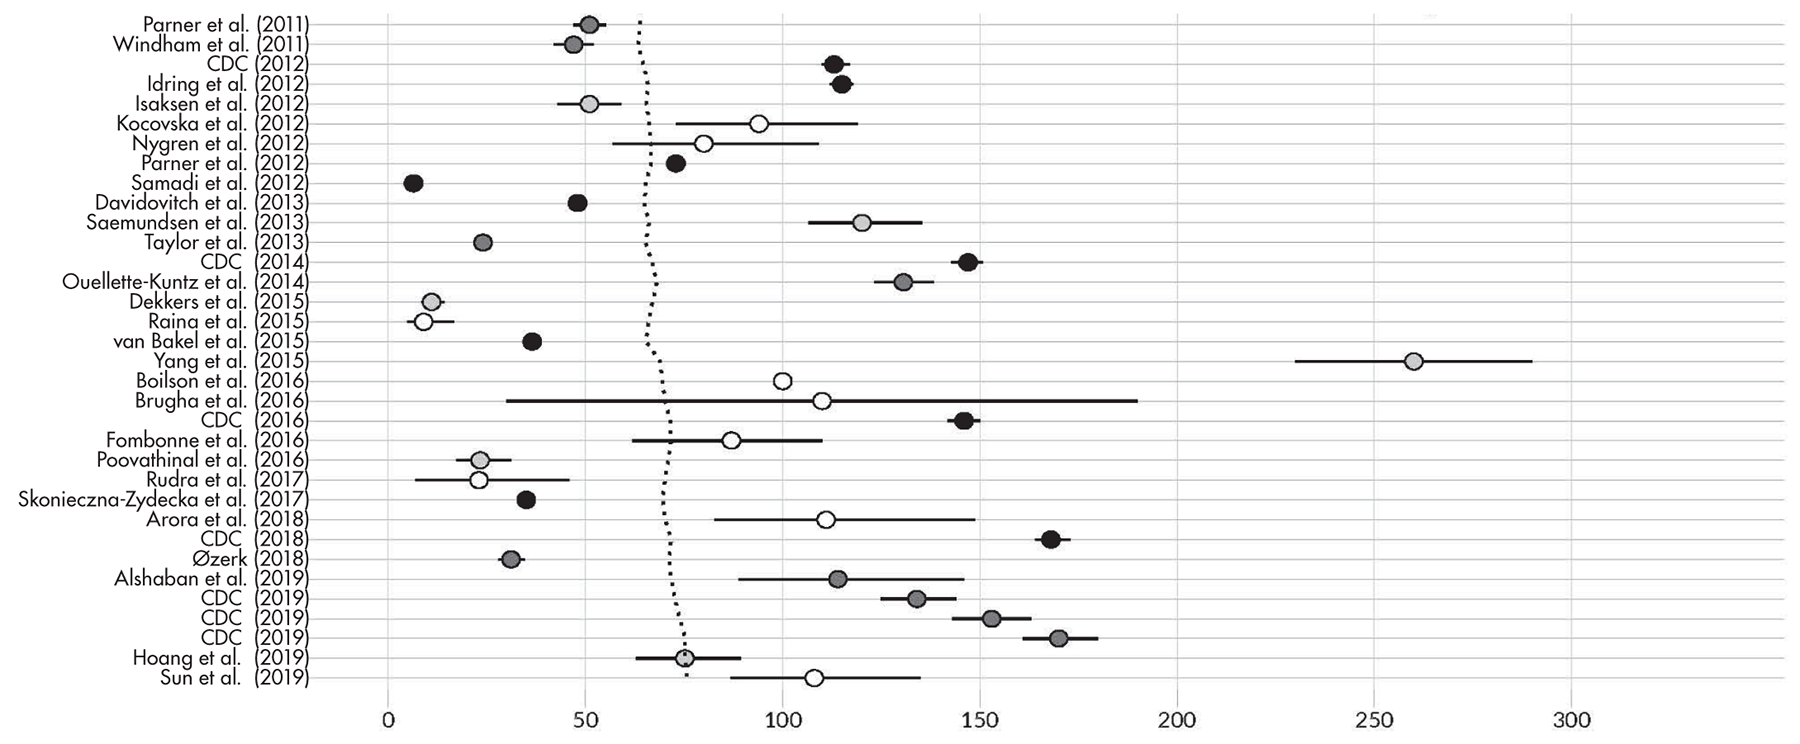
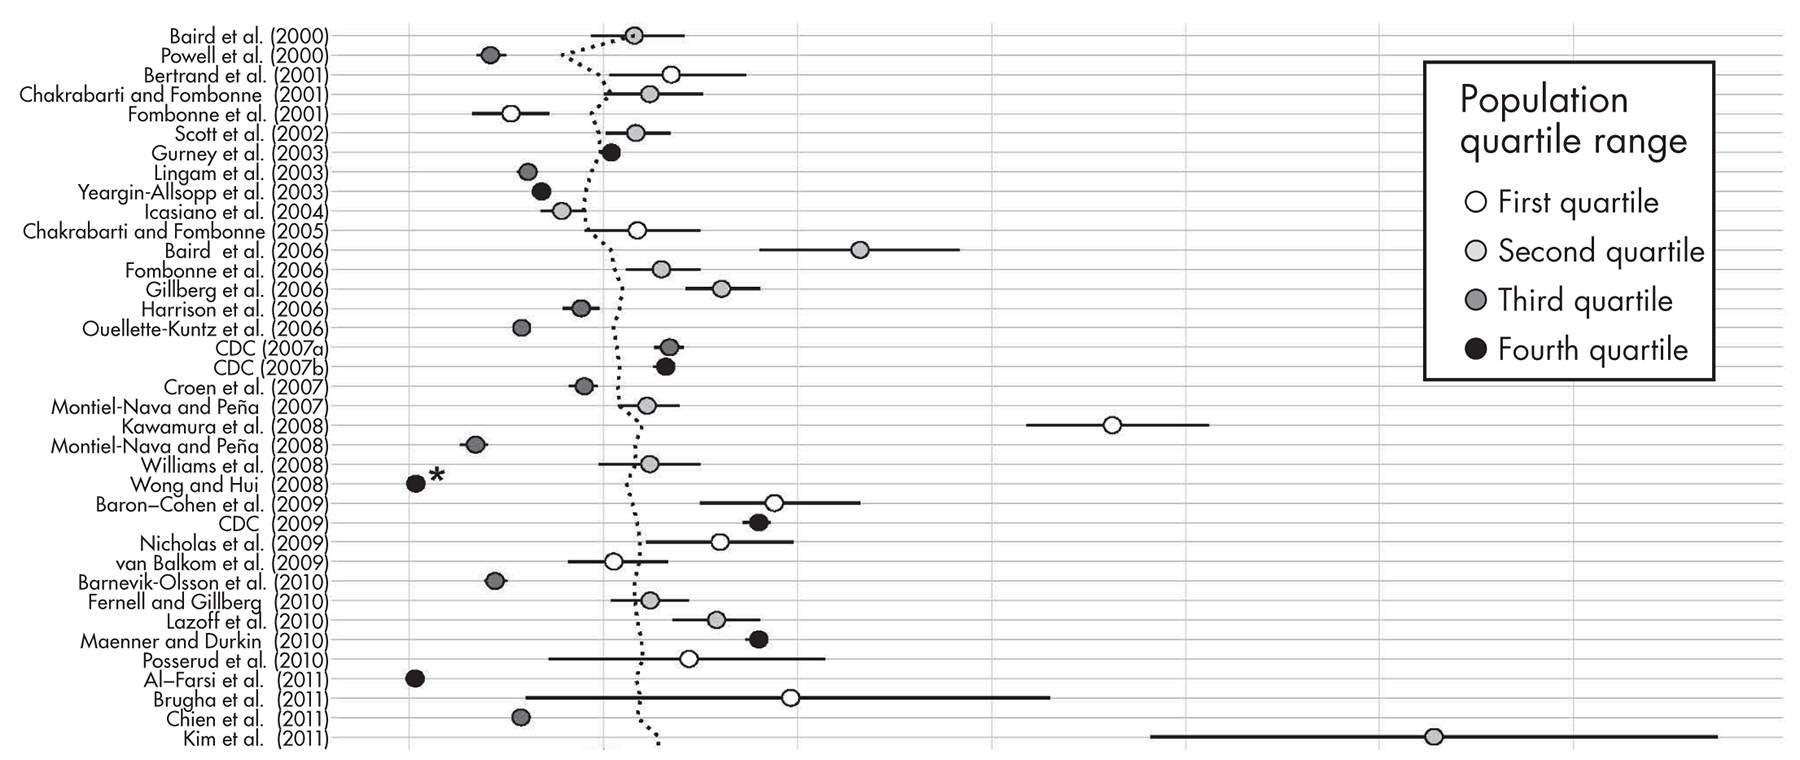
In 32 studies in which IQ scores were reported, the proportion of subjects within the normal IQ range varied from 0% to 100% (median 55.0%). Males were overrepresented in the 58 studies reporting sex ratios, with male-to-female ratios ranging from 1.4:1 to 15.7:1 (median 4.3:1). There was a 189-fold variation in ASD prevalence, ranging from 1.4 to 264 per 10,000 (Figure 1–2). Substantial variation in confidence interval width also was found, reflecting variation in sample sizes and in each study’s precision. However, some consistency in ASD prevalence is found in the center of this distribution, with a median rate of 64.9 per 10,000 and a mean rate of 75.8 per 10,000 (interquartile range 35.8–104.0 per 10,000). Prevalence was negatively associated with sample size (Kendall’s τ =  0.18, P = 0.03), with small-scale studies reporting higher prevalence. There was also a significant positive correlation between ASD prevalence estimates and publication year (Kendall’s τ = 0.25, P = 0.003), with higher rates in more recent surveys. The average prevalence for surveys published in 2010 and later (n = 43) is 87 per 10,000. When considering only the surveys conducted in the United States, the average prevalence for surveys published in 2000 and later (n = 17) was 98 per 10,000 and for surveys published in 2010 and later (n = 9) was 130 per 10,000.
The dashed vertical line denotes the cumulative mean prevalence of 76 per 10,000 across all 71 surveys. Data are grouped by population interquartile range: first quartile (3,964–13,585), second quartile (13,585–56,946), third quartile (56,946–255,592), and fourth quartile (255,592–4,247,206).
*A corrected prevalence is included, based on data reported in Wong and Hui (2008).
CDC = Centers for Disease Control and Prevention.
Figure 1–2. Prevalence estimates for ASD since 2000 (per 10,000 with 95% CI; see also the appendix to this chapter).
Eighteen studies since 2000 reported ASD prevalence estimates higher than 100 per 10,000, or 1%. Baird et al. (2006) and Kim et al. (2011) both employed proactive case-finding techniques, relying on multiple and repeated screening phases that surveyed different informants at each phase, which certainly enhanced the sensitivity of case identification. Multisource active surveillance techniques, as employed in the Stockholm Youth Cohort (Idring et al. 2012) and by the CDC’s Autism and Developmental Disabilities Monitoring (ADDM) Network, also improve identification of individuals with ASD. The most recent*2 CDC prevalence estimate (study year 2016, children age 8 years; Maenner et al. 2020) of 170 per 10,000 reflects the highest estimate to date across all of the previous ADDM Network reports.
Overall, results of recent surveys (n = 71) agree on an average figure of 76 per 10,000 (equivalent to 7.6/1,000 or 0.76%), translating to 1 child out of 132 having an ASD diagnosis. However, this estimate represents an average and conservative figure, and substantial variability exists between and within studies and across sites or areas.

Time Trends in Prevalence and Their Interpretation

The epidemic hypothesis emerged in the 1990s when, in most countries, increasing numbers of individuals received diagnoses of disorders on the autism spectrum, leading to an upward trend in children registered in service provider databases that was paralleled by higher prevalence rates in epidemiological surveys. These trends were interpreted as evidence that the actual population incidence of ASD was increasing. However, methodological factors must be considered before concluding that there is a true rise in the underlying incidence of ASD.

Reliance on Referral Statistics

Increasing numbers of children referred to specialist services or known to special education registers has been taken as evidence for increased incidence of ASD. Such upward trends have been seen in many different countries and datasets (Gurney et al. 2003; Shattuck 2006), all occurring in the late 1980s and early 1990s. However, trends over time in referred samples are confounded by referral patterns, availability of services, heightened public awareness, decreasing age at diagnosis, and changes over time in diagnostic concepts and practices.
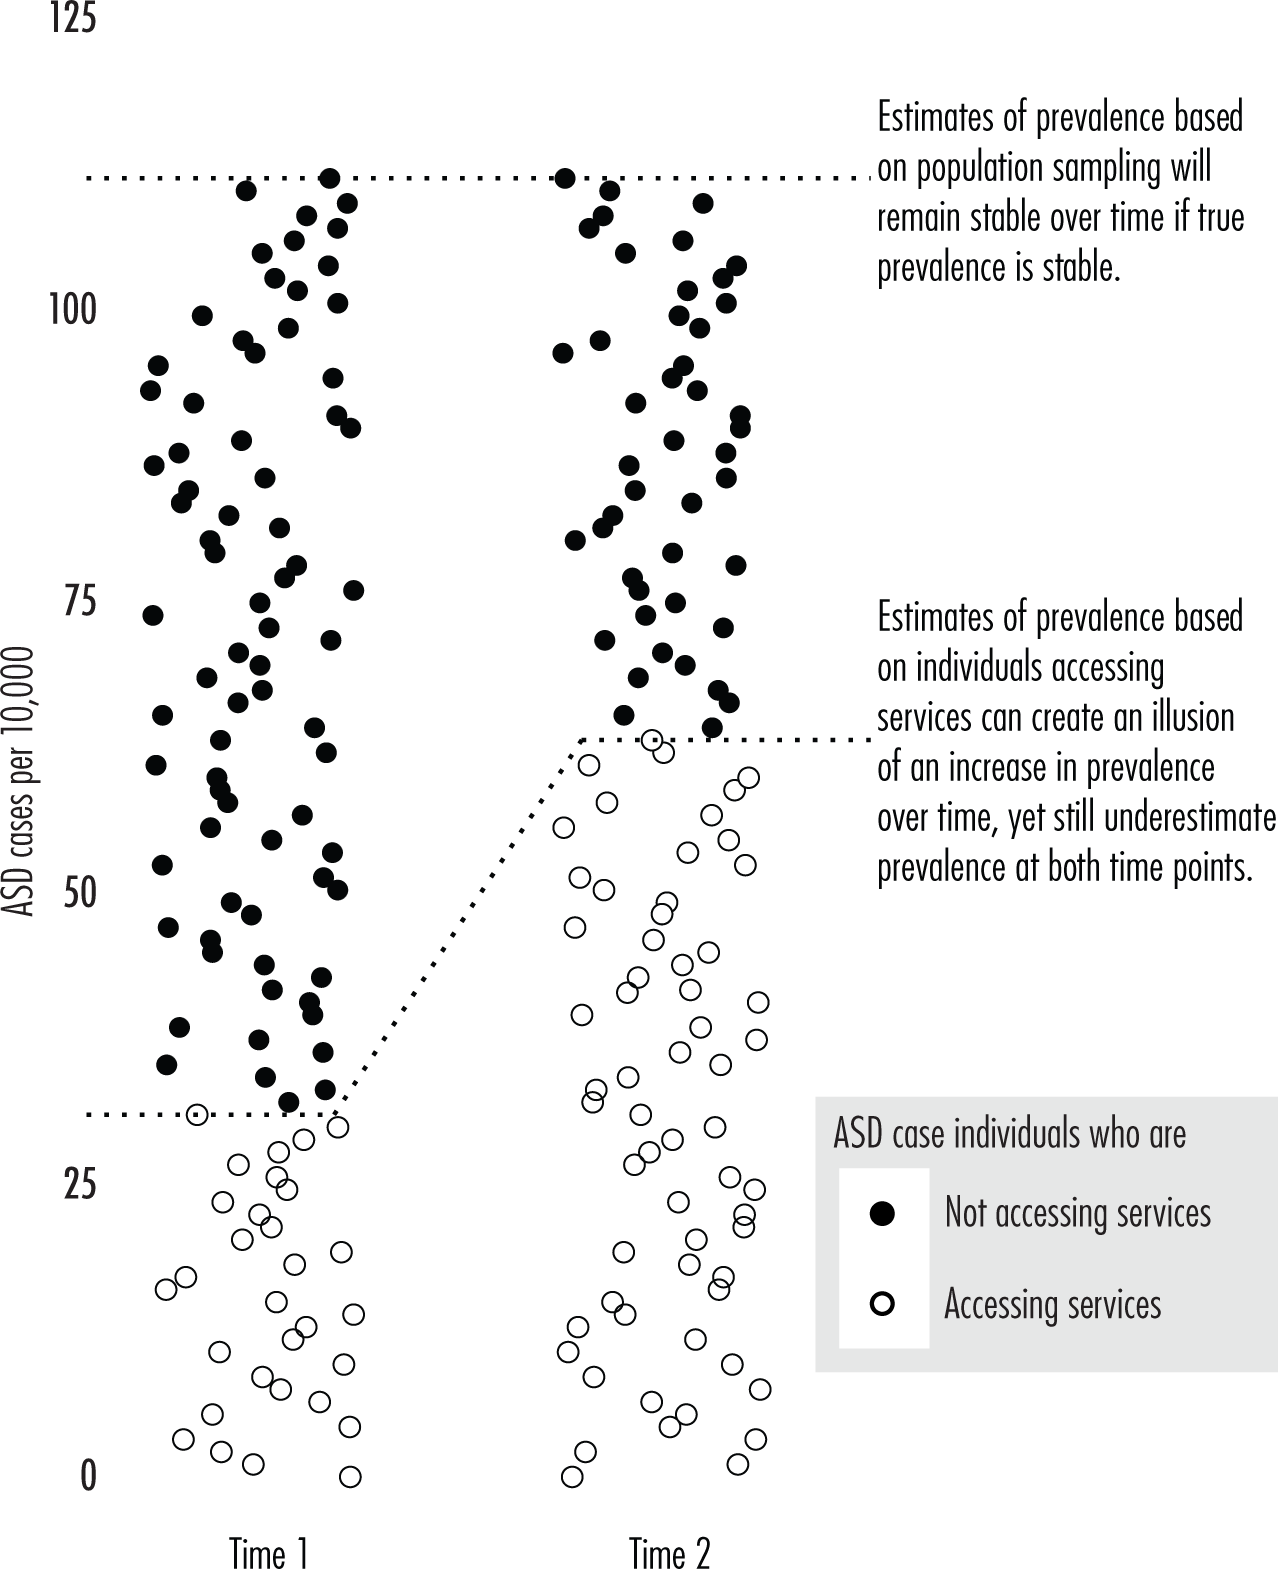
As an illustration, Figure 1–3 uses hypothetical data to contrast two methods for surveying ASD: one based on sampling from the total population, and the other relying solely on number of persons accessing services. The latter approach suggests a rise in disease occurrence that is not supported by population data. Such a pattern of results based on special education data was reported in Wisconsin (Maenner and Durkin 2010), where prevalence rates of ASD were stable between 2002 and 2008 in school districts with initially high baseline prevalence rates (approximately 120 per 10,000), whereas school districts with low baseline rates experienced significant increases in prevalence, as was seen in California (Fombonne 2001).
Assuming a constant incidence and prevalence of 100 per 10,000 between time 1 and time 2 (meaning there is no “epidemic”), prevalence estimates that rely solely on service access counts not only underestimate the true prevalence but also may create the illusion of rising prevalence over time.
Figure 1–3. Impact of sampling methodology on prevalence estimates.
The decreasing age at diagnosis also results in increasing numbers of young children being identified in official statistics (Christensen et al. 2019) or referred to specialist medical and educational services. Earlier identification of children from the prevalence pool therefore may result in increased service activity, leading to a misperception by professionals of an epidemic.

Diagnostic Substitution

Another possible explanation is that children presenting with the same developmental disability may receive one particular diagnosis initially and another diagnosis subsequently. Such diagnostic substitution (or switching) may occur when diagnostic categories become increasingly familiar to health professionals or when access to better services is ensured by using a new diagnostic category. The strongest evidence of diagnostic substitution contributing to ASD prevalence increase was shown in a complex analysis of U.S. Department of Education data in 50 U.S. states (Shattuck 2006) indicating that a relatively high proportion of children previously diagnosed with mental retardation were subsequently identified as having autism. Shattuck (2006) showed that the odds of receiving a diagnosis of autism increased by a factor of 1.21 per year between 1994 and 2003, whereas the odds of receiving a diagnosis of learning disability and mental retardation both decreased (0.98 and 0.97, respectively). Shattuck further established that the growing autism prevalence was directly associated with decreasing prevalence of learning disability and mental retardation within states.
Using individual rather than aggregate-level data, another study showed that 24% of the increase in the California Department of Developmental Services caseload was attributable to diagnostic substitution (from mental retardation to ASD) (King and Bearman 2009). Other types of diagnostic substitution are likely to have occurred as well for milder forms of ASD. For example, children with diagnoses of Asperger’s disorder may have been previously diagnosed with other psychiatric diagnoses (e.g., OCD, school phobia, social anxiety) in clinical settings before the developmental nature of their condition was fully recognized (Fombonne 2009).

Variability in Cross-Sectional Surveys

Evidence that method factors could account for most of the variability in published prevalence estimates comes from a direct comparison of eight surveys conducted in the United Kingdom and the United States (Fombonne 2005). In each country, four surveys conducted around the same year in similar age groups exhibited an unexpected 4- to 5.5-fold variation in rates, with higher rates found when intensive population-based screening techniques were used, and lower rates reported in studies relying on passive administrative methods for case finding. Because no passage of time was involved, the magnitude of this gradient in rates is likely to reflect methodological differences.
Likewise, in a CDC survey of 346,978 children age 8 years in 2012, in which an average prevalence of 146 per 10,000 was reported across 11 U.S. states (Christensen et al. 2016), a threefold variation in prevalence by state was observed (range 82–246 per 10,000; see Figure 1–4). It would be surprising if there were truly this much inherent state-to-state variability in the number of children with autism in the United States. Thus, these differences likely reflect ascertainment variability across sites in a study that was otherwise performed with the same methods, at the same time, with children of the same age, and within the same country.
Figure 1–4. Estimated prevalence of ASD (95% CI) among children age 8 years in the United States, by Autism and Developmental Disabilities Monitoring (ADDM) Network site and primary type of records access across ADDM Network survey years.

Repeated Surveys in Defined Geographical Areas

Studies conducted in Sweden (Gillberg et al. 1991) and in Toyota, Japan at different points in time (Honda et al. 2005; Kawamura et al. 2008) showed rises in prevalence rates that their authors interpreted as reflecting the effect of improved population screening of preschoolers, broadening of diagnostic concepts and criteria, and improved services. By contrast, two surveys of children born between 1992 and 1995 and between 1996 and 1998 in Staffordshire, United Kingdom (Chakrabarti and Fombonne 2001, 2005) and performed with rigorously identical methods for case definition and case identification suggested no upward trend in overall rates of ASDs, at least during the short time interval between studies.

Birth Cohorts

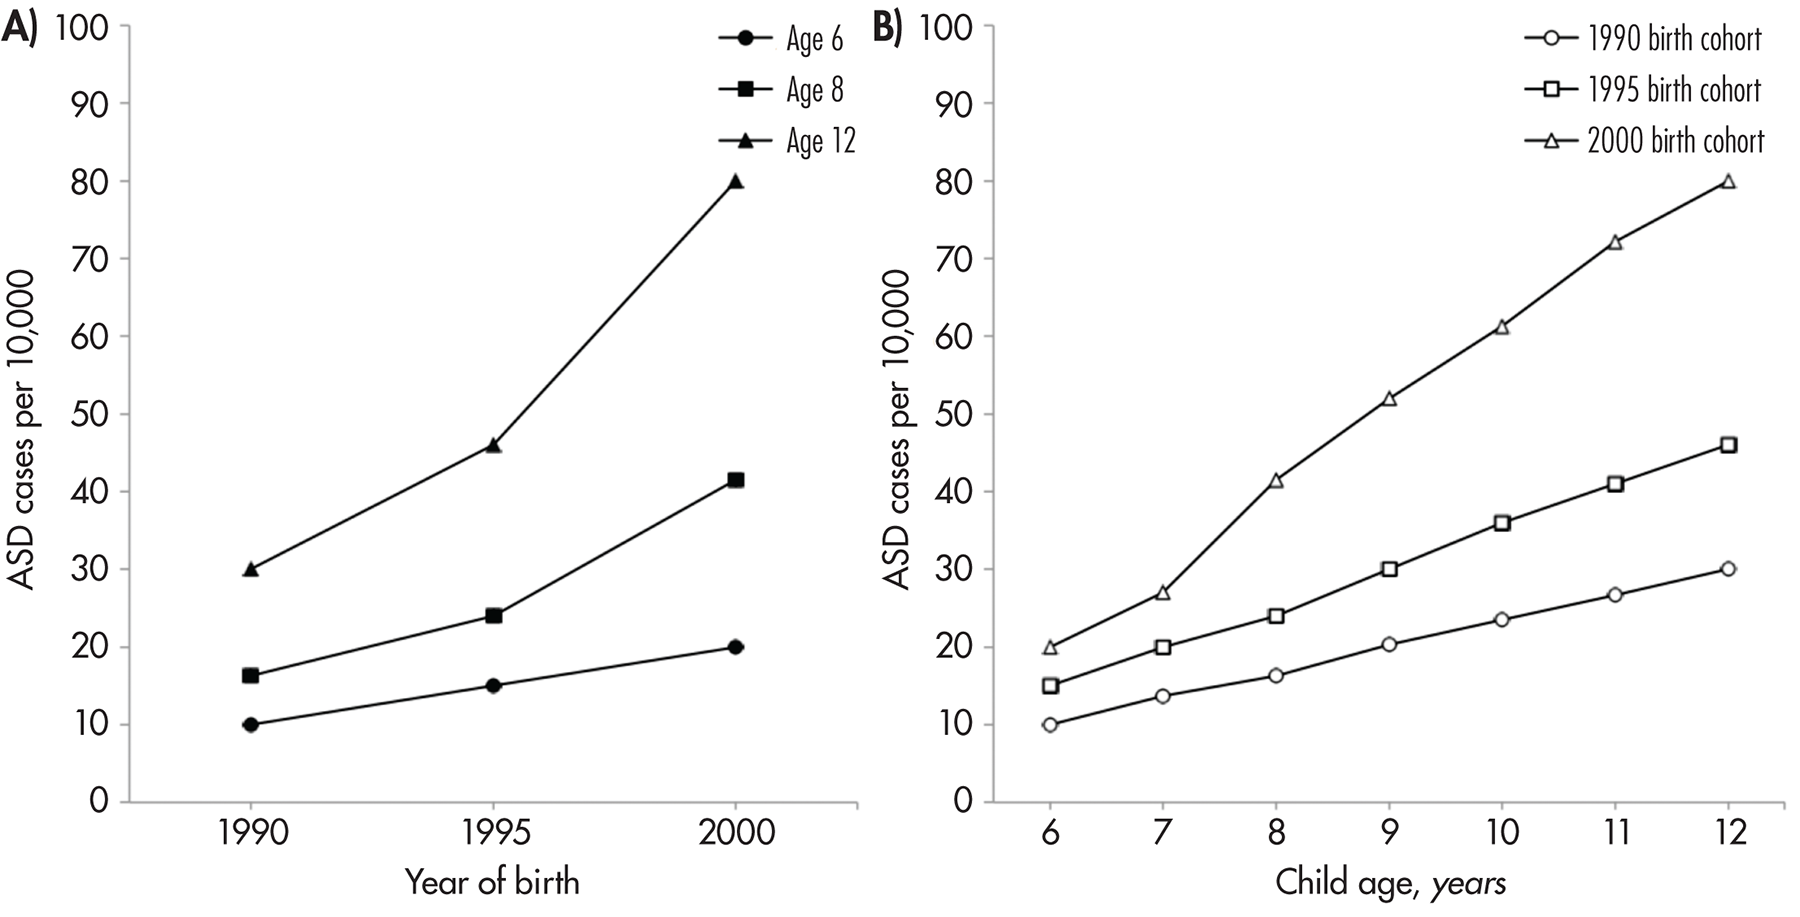
Two large French surveys including birth cohorts from 1972 to 1985 (735,000 children, 389 of whom had autism) showed no upward trend in age-specific rates (Fombonne and du Mazaubrun 1992; Fombonne et al. 1997). Two recent Australian studies examined the effect of birth cohort on diagnosis. Randall et al. (2016) found that ASD diagnosis before age 7 was higher in the later-born cohort (birth year 2004–2005: 2.5%) than in the earlier-born cohort (1999–2000: 1.5%). A follow-up study of the later-born cohort found that both teacher- and parent-reported prevalence rates held the same pattern of higher ASD prevalence into school age (May et al. 2017). However, data assessing birth cohorts can be problematic, as illustrated in Figure 1–5, which shows an increase in the prevalence of ASD by year of birth across three hypothetical successive birth cohorts (a cohort effect; Figure 1–5A). Within each birth cohort, followed longitudinally, prevalence increases as children age (Figure 1–5B): for children in the 2000 birth cohort, based on previous ASD prevalence estimates, age 6 prevalence was 20 per 10,000, whereas at age 12 we may expect a prevalence of 80 per 10,000 for the same birth cohort. Birth cohort and age effects cannot be disentangled because they both share time as a common factor. Rather than signaling an increased incidence in successive birth cohorts, the increasing prevalence rates in later childhood and early adolescence within birth cohorts cannot reflect new onset of ASD and have no biological meaning. Observed increases in prevalence with age more likely reflect underdiagnosis in the preschool years and changes in public awareness, service availability, diagnostic concepts and practices, and perhaps overdiagnosis during school age (Fombonne 2018).
A, Rising prevalence rates among 6-, 8-, and 12-year-old children across three different birth cohorts. B, Prevalence rates also increase within birth cohorts as they age, potentially coinciding with changes in patterns of referral, service availability, public awareness, and diagnostic concepts and practices.
Figure 1–5. Time trends in prevalence rates of ASD across and within birth cohorts (hypothetical data).
As an example, an analysis of special education data from Minnesota showed a 16-fold increase in children identified with ASD from 1991–1992 to 2001–2002 (Gurney et al. 2003). However, during the same period, a 50% increase was observed for all disability categories (except severe intellectual deficiency), especially ADHD. The large sample size allowed the authors to assess age, period, and cohort effects. Prevalence increased regularly in successive birth cohorts; for example, among 7-year-old children, prevalence rose from 18 per 10,000 among those born in 1989, to 29 per 10,000 among those born in 1991, to 55 per 10,000 in those born in 1993. Age effects were also apparent within the same birth cohorts; for example, among children born in 1989, the prevalence increased with age from 13 per 10,000 at age 6, to 21 per 10,000 at age 9, to 33 per 10,000 at age 11. As argued by Gurney et al. (2003), this pattern is not consistent with the natural etiology of ASD, which first manifests in early childhood. The analysis by Gurney and colleagues also showed a marked period effect because rates started to increase in all ages and birth cohorts in the 1990s. The authors noted that this phenomenon coincided closely with the inclusion of ASD in the federal Individuals with Disabilities Education Act (1990) in the United States. A similar interpretation of upward trends had been put forward by Croen et al. (2002) in their analysis of the California Department of Developmental Services data and by Shattuck (2006) in his analysis of trends in U.S. Department of Education data.

Social Class, Race, and Ethnic Minority Status

Studies of associations between ASD and socioeconomic status (SES), race/ethnicity, and immigrant status have shown variable results and face numerous technical challenges. In general, studies that base diagnosis rates on developmental service utilization may undercount minority and low-SES children due to less access to health services generally (Shi and Stevens 2005) and mental health services in particular (Kataoka et al. 2002). Cross-sectional prevalence studies based on parent report of ASD are problematic in this respect because parent report of ASD is more likely among families who have adequate access to ASD-related services. Minority and low-SES families may also participate in such research studies at disproportionately lower rates (Rajakumar et al. 2009), and many studies do not report on sociodemographic variables at all (Broder-Fingert et al. 2019). These groups also may be excluded from studies or incorrectly assessed if forms are not available in appropriate languages or if a language-congruent assessor is not available.

Socioeconomic Status

SES can be defined by parental education, income, parental occupation, or some combination of these factors. More than 20 studies have investigated associations between these factors and ASD prevalence. Recent U.S.-based studies suggest an association between higher SES and higher ASD prevalence. Using CDC ADDM Network data states, Durkin et al. (2017) found a dose-response relationship between SES (defined as parental education) and ASD prevalence in all recent survey years, in white, Black, and Hispanic children. This difference remained present regardless of sex, prior ASD diagnosis, and source of records (i.e., medical only versus medical and educational). However, no significant difference was found among those with co-occurring intellectual disability, and the difference appeared to lessen in non-Hispanic children over time. Similarly, Dickerson et al. (2017) used U.S. Census tract data to show a negative association between neighborhood poverty level (as defined by median household income or proportion in poverty) and ASD prevalence at ADDM Network sites.

Race and Ethnicity

Many studies of racial/ethnic minorities show lower rates of ASD compared with white or European populations, although these differences appear to be narrowing in more current studies. Recent data from the CDC ADDM Network (Baio et al. 2018) suggest an overall lower rate of ASD among non-Hispanic Black (160 per 10,000), Hispanic (140 per 10,000), and Asian/Pacific Islander (135 per 10,000) children compared with white children (172 per 10,000) in the United States. Similar trends have been noted in 4-year-olds in the ADDM Network; however, most recent waves of this survey suggest that racial/ethnic differences may be narrowing or even disappearing, particularly for non-Hispanic Black children (Christensen et al. 2019; Nevison and Zahorodny 2019). However, some of these differences may be explained by ascertainment in the ADDM Network because nonwhite children were more likely to be excluded due to missing information (Imm et al. 2019).
In studies outside of the United States, reports about racial/ethnic differences in ASD prevalence have been mixed, and most studies are not adjusted for SES, which makes it difficult to assess the unique effect of race/ethnicity from other confounders. In addition, what constitutes a minority race or ethnicity is quite variable by country. In Israel, Davidovitch et al. (2013) and Jaber et al. (2018) both conducted studies showing a lower prevalence of ASD in ultra-Orthodox Jewish subjects than in the general Israeli population. Davidovitch et al. (2013) also found a lower prevalence in Israeli Arab subjects, but Jaber et al. (2018) found no difference. Levaot et al. (2019) found lower prevalence in Bedouin-Arab compared with Jewish children in southern Israel. Findings from a 1999–2003 census report in Stockholm, Sweden (Barnevik-Olsson et al. 2010), revealed that the prevalence rate of pervasive developmental disorder with learning disability was higher in Somali compared with non-Somali Swedish children. Finally, in Western Australia, children of Indigenous mothers were less likely and children with East-African Black mothers were more likely to carry an ASD diagnosis compared with children of white mothers (Fairthorne et al. 2017).

Implications and Unmet Research Needs

Overall, the research findings related to low SES and minority status primarily point to problems of underdiagnosis due to problems in access to health care services and health literacy. To obtain an accurate depiction of ASD prevalence in underserved populations, investigators will need to specifically reach out to these populations to ensure equal participation and oversample these groups so that sample sizes are adequate. In addition, validated screening and diagnostic tools in multiple languages are needed to ensure that diagnoses, when they occur, are accurate. Finally, key variables in these analyses, such as parental education, income, and race/ethnicity, need to be directly and routinely measured.

Conclusion

Epidemiological surveys of ASD pose substantial challenges to researchers seeking to measure rates of ASD, particularly given the range of case definition, case identification, and case evaluation methods used across surveys. However, from recent studies, a best estimate of 76 per 10,000 (equivalences 7.6/1,000 [0.76%] or 1 child in about 132 children) can be derived for the prevalence of ASD. Currently, the recent upward trend in rates of prevalence cannot be directly attributed to an increase in the incidence of the disorder or to an epidemic of ASD. Although the power to detect time trends is seriously limited in existing datasets, good evidence indicates that changes in diagnostic criteria and practices, policies for special education, service availability, and awareness of ASDs in both the lay and professional public may be responsible for increasing prevalence over time. It is also noteworthy that the rise in the number of children diagnosed occurred concurrently in many countries in the 1990s, when services for children with ASD also expanded significantly. Statistical power may also be a significant limitation in most investigations; thus, variations of small magnitude in ASD incidence may be undetected or should be interpreted with caution.
Nonetheless, the possibility that a true increase in the incidence of ASDs has partially contributed to the upward trend in prevalence rates cannot, and should not, be completely ruled out. To assess whether the incidence has increased, investigators must stringently control for the methodological factors that account for an important proportion of the variability in rates. New survey methods have been developed for use in multinational comparisons; ongoing surveillance programs are currently under way and will soon provide more meaningful data to evaluate this hypothesis. Although preliminary studies show a lower rate of ASD diagnosis under DSM-5 criteria, it remains to be seen how changes to the diagnostic criteria introduced in DSM-5 will impact ASD prevalence estimates going forward. Meanwhile, the available prevalence figures carry straightforward implications for current and future needs in services and early educational intervention programs.

Key Points

The existing worldwide prevalence estimates for ASD since the year 2000 are 76 per 10,000 overall, with the two studies focusing on adult prevalence showing 98.2 and 110 per 10,000 and studies focusing on toddlers and preschoolers showing 136 per 10,000.
Methodological factors impacting the estimation of prevalence and the interpretation of prevalence over time include reliance on referral statistics, diagnostic substitution, variability in cross-sectional surveys, repeated surveys in defined geographical areas, and the use of birth cohort studies.
Possible explanations for an increase in the prevalence of ASD within and across populations over time include changes in diagnostic criteria and practices, policies for special education, service availability, and awareness of ASD in both the lay and professional public. Increases in ASD diagnostic rates cannot directly be attributed to a true increase in the incidence of ASD due to multiple confounding factors.
Several preliminary studies find a lower rate of diagnosis under the narrower DSM-5 ASD case definition, but prevalence is still rising overall. It remains to be seen how changes to diagnostic criteria introduced in DSM-5 will impact future ASD prevalence rates.

Recommended Reading

Brugha TS, Spiers N, Bankart J, et al: Epidemiology of autism in adults across age groups and ability levels. Br J Psychiatry 209(6):498–503, 2016 27388569
Chakrabarti S, Fombonne E: Pervasive developmental disorders in preschool children. JAMA 285(24):3093–3099, 2001 11427137
Christensen DL, Maenner MJ, Bilder D, et al: Prevalence and characteristics of autism spectrum disorder among children aged 4 years: Early Autism and Developmental Disabilities Monitoring Network, seven sites, United States, 2010, 2012, and 2014. MMWR Surveill Summ 68(2):1–19, 2019 30973853
Fombonne E: Editorial: the rising prevalence of autism. J Child Psychol Psychiatry 59(7):717–720, 2018
Fombonne E, MacFarlane H, Salem AC: Epidemiological surveys of ASD: advances and remaining challenges. J Autism Dev Disord 2021 33864555 Epub ahead of print
Kim YS, Leventhal BL, Koh Y-J, et al: Prevalence of autism spectrum disorders in a total population sample. Am J Psychiatry 168(9):904–912, 2011
Maenner MJ, Shaw KA, Baio J, et al: Prevalence of autism spectrum disorder among children aged 8 years—Autism and Developmental Disabilities Monitoring Network, 11 Sites, United States, 2016. MMWR Surveill Summ 69(4):1–12, 2020 32214087

Footnotes

1The Arora et al. (2018) study with this sample size was included because the sample was drawn from a larger target population.
2This study was published after finalization of this chapter, and it is therefore not included in the chapter appendix or in Figure 1–2.

References

Al-Farsi YM, Al-Sharbati MM, Al-Farsi OA, et al: Brief report: prevalence of autistic spectrum disorders in the Sultanate of Oman. J Autism Dev Disord 41(6):821–825, 2011 20809376
Alshaban F, Aldosari M, Al-Shammari H, et al: Prevalence and correlates of autism spectrum disorder in Qatar: a national study. J Child Psychol Psychiatry 60(12):1254–1268, 2019
American Psychiatric Association: Diagnostic and Statistical Manual of Mental Disorders, 4th Edition. Washington, DC, American Psychiatric Association, 1994
American Psychiatric Association: Diagnostic and Statistical Manual of Mental Disorders, 4th Edition, Text Revision. Washington, DC, American Psychiatric Association, 2000
American Psychiatric Association: Diagnostic and Statistical Manual of Mental Disorders, 5th Edition. Arlington, VA, American Psychiatric Association, 2013
Arora NK, Nair MKC, Gulati S, et al: Neurodevelopmental disorders in children aged 2–9 years: population-based burden estimates across five regions in India. PLoS Med 15(7):e1002615, 2018 30040859
Autism and Developmental Disabilities Monitoring Network Surveillance Year 2000 Principal Investigators, Centers for Disease Control and Prevention: Prevalence of autism spectrum disorders—Autism and Developmental Disabilities Monitoring Network, six sites, United States, 2000. MMWR Surveill Summ 56(1 SS01):1–11, 2007a 17287714
Autism and Developmental Disabilities Monitoring Network Surveillance Year 2002 Principal Investigators, Centers for Disease Control and Prevention: Prevalence of autism spectrum disorders—Autism and Developmental Disabilities Monitoring Network, 14 sites, United States, 2002. MMWR Surveill Summ 56(1 SS01):12–28, 2007b 17287715
Autism and Developmental Disabilities Monitoring Network Surveillance Year 2006 Principal Investigators, Centers for Disease Control and Prevention: Prevalence of autism spectrum disorders—Autism and Developmental Disabilities Monitoring Network, United States, 2006. MMWR Surveill Summ 58(10 SS10):1–20, 2009 20023608
Autism and Developmental Disabilities Monitoring Network Surveillance Year 2008 Principal Investigators, Centers for Disease Control and Prevention: Prevalence of autism spectrum disorders—Autism and Developmental Disabilities Monitoring Network, 14 sites, United States, 2008. MMWR Surveill Summ 61(3):1–19, 2012 22456193
Autism and Developmental Disabilities Monitoring Network Surveillance Year 2010 Principal Investigators, Centers for Disease Control and Prevention: Prevalence of autism spectrum disorder among children aged 8 years—Autism and Developmental Disabilities Monitoring Network, 11 sites, United States, 2010. MMWR Surveill Summ 63(2):1–21, 2014 24670961
Baio J, Wiggins L, Christensen DL, et al: Prevalence of autism spectrum disorder among children aged 8 years. Autism and Developmental Disabilities Monitoring Network, 11 sites, United States, 2014. MMWR Surveill Summ 67(6):1–23, 2018 29701730
Baird G, Charman T, Baron-Cohen S, et al: A screening instrument for autism at 18 months of age: a 6-year follow-up study. J Am Acad Child Adolesc Psychiatry 39(6):694–702, 2000 10846303
Baird G, Simonoff E, Pickles A, et al: Prevalence of disorders of the autism spectrum in a population cohort of children in South Thames: the Special Needs and Autism Project (SNAP). Lancet 368(9531):210–215, 2006 16844490
Barnevik-Olsson M, Gillberg C, Fernell E: Prevalence of autism in children of Somali origin living in Stockholm: brief report of an at-risk population. Dev Med Child Neurol 52(12):1167–1168, 2010 20964674
Baron-Cohen S, Scott FJ, Allison C, et al: Prevalence of autism-spectrum conditions: UK school-based population study. Br J Psychiatry 194(6):500–509, 2009 19478287
Bertrand J, Mars A, Boyle C, et al: Prevalence of autism in a United States population: the Brick Township, New Jersey, investigation. Pediatrics 108(5):1155–1161, 2001 11694696
Boilson AM, Staines A, Ramirez A, et al: Operationalisation of the European Protocol for Autism Prevalence (EPAP) for autism spectrum disorder prevalence measurement in Ireland. J Autism Dev Disord 46(9):3054–3067, 2016
Broder-Fingert S, Silva C, Silverstein M, Feinberg E: Participant characteristics in autism intervention studies. Autism 23(1):265–266, 2019 29058983
Brugha TS, McManus S, Bankart J, et al: Epidemiology of autism spectrum disorders in adults in the community in England. Arch Gen Psychiatry 68(5):459–465, 2011 21536975
Brugha TS, Spiers N, Bankart J, et al: Epidemiology of autism in adults across age groups and ability levels. Br J Psychiatry 209(6):498–503, 2016 27388569
Chakrabarti S, Fombonne E: Pervasive developmental disorders in preschool children. JAMA 285(24):3093–3099, 2001 11427137
Chakrabarti S, Fombonne E: Pervasive developmental disorders in preschool children: confirmation of high prevalence. Am J Psychiatry 162(6):1133–1141, 2005 15930062
Chien IC, Lin CH, Chou YJ, Chou P: Prevalence and incidence of autism spectrum disorders among national health insurance enrollees in Taiwan from 1996 to 2005. J Child Neurol 26(7):830–834, 2011 21460178
Christensen DL, Baio J, Van Naarden Braun K, et al: Prevalence and characteristics of autism spectrum disorder among children aged 8 years: Autism and Developmental Disabilities Monitoring Network, 11 sites, United States, 2012. MMWR Surveill Summ 65(3):1–23, 2016
Christensen DL, Maenner MJ, Bilder D, et al: Prevalence and characteristics of autism spectrum disorder among children aged 4 years: Early Autism and Developmental Disabilities Monitoring Network, seven sites, United States, 2010, 2012, and 2014. MMWR Surveill Summ 68(2):1–19, 2019 30973853
Croen LA, Grether JK, Hoogstrate J, Selvin S: The changing prevalence of autism in California. J Autism Dev Disord 32(3):207–215, 2002 12108622
Croen LA, Najjar DV, Fireman B, et al: Maternal and paternal age and risk of autism spectrum disorders. Arch Pediatr Adolesc Med 161(4):334–340, 2007
Davidovitch M, Hemo B, Manning-Courtney P, Fombonne E: Prevalence and incidence of autism spectrum disorder in an Israeli population. J Autism Dev Disord 43(4):785–793, 2013 22836322
Dekkers LM, Groot NA, Mosquera END, et al: Prevalence of autism spectrum disorders in Ecuador: a pilot study in Quito. J Autism Dev Disord 45(12):4165–4173, 2015
Dickerson AS, Rahbar MH, Pearson DA, et al: Autism spectrum disorder reporting in lower socioeconomic neighborhoods. Autism 21(4):470–480, 2017 27627912
Durkin MS, Maenner MJ, Baio J, et al: Autism spectrum disorder among US children (2002–2010): socioeconomic, racial, and ethnic disparities. Am J Public Health 107(11):1818–1826, 2017 28933930
Elsabbagh M, Divan G, Koh Y-J, et al: Global prevalence of autism and other pervasive developmental disorders. Autism Res 5(3):160–179, 2012 22495912
Fairthorne J, de Klerk N, Leonard HM, et al: Maternal race-ethnicity, immigrant status, country of birth, and the odds of a child with autism. Child Neurol Open 4:2329048X16688125, 2017 28503625
Fernell E, Gillberg C: Autism spectrum disorder diagnoses in Stockholm preschoolers. Res Dev Disabil 31(3):680–685, 2010 20149593
Fombonne E: Is there an epidemic of autism? Pediatrics 107(2):411–412, 2001 11158478
Fombonne E: Epidemiological surveys of autism and other pervasive developmental disorders: an update. J Autism Dev Disord 33(4):365–382, 2003 12959416
Fombonne E: Epidemiology of autistic disorder and other pervasive developmental disorders. J Clin Psychiatry 66(suppl 10):3–8, 2005 16401144
Fombonne E: Commentary: on King and Bearman. Int J Epidemiol 38(5):1241–1242, author reply 1243–1244, 2009 19737796
Fombonne E: Epidemiology, in Lewis’s Child and Adolescent Psychiatry: A Comprehensive Textbook, 5th Edition. Edited by Martin A, Volkmar F. Philadelphia, PA, Lippincott Williams and Wilkins, 2017, pp 203–223
Fombonne E: Editorial: the rising prevalence of autism. J Child Psychol Psychiatry 59(7):717–720, 2018 29924395
Fombonne E, du Mazaubrun C: Prevalence of infantile autism in four French regions. Soc Psychiatry Psychiatr Epidemiol 27(4):203–210, 1992 1411750
Fombonne E, du Mazaubrun C, Cans C, Grandjean H: Autism and associated medical disorders in a French epidemiological survey. J Am Acad Child Adolesc Psychiatry 36(11):1561–1569, 1997 9394941
Fombonne E, Simmons H, Ford T, et al: Prevalence of pervasive developmental disorders in the British nationwide survey of child mental health. J Am Acad Child Adolesc Psychiatry 40:820–827, 2001
Fombonne E, Zakarian R, Bennett A, et al: Pervasive developmental disorders in Montreal, Quebec, Canada: prevalence and links with immunizations. Pediatrics 118(1):e139–e150, 2006 16818529
Fombonne E, Quirke S, Hagen A: Epidemiology of pervasive developmental disorders, in Autism Spectrum Disorders. Edited by Amaral DG, Dawson G, Geschwind DH. New York, Oxford University Press, 2011, pp 90–111
Fombonne E, Marcin C, Manero AC, et al: Prevalence of autism spectrum disorders in Guanajuato, Mexico: the Leon survey. J Autism Dev Disord 46(5):1669–1685, 2016 26797939
Fombonne E, MacFarlane H, Salem AC: Epidemiological surveys of ASD: advances and remaining challenges. J Autism Dev Disord 2021 33864555 Epub ahead of print
Gillberg C, Steffenburg S, Schaumann H: Is autism more common now than ten years ago? Br J Psychiatry 158:403–409, 1991 1828000
Gillberg C, Cederlund M, Lamberg K, et al: Brief report: “the autism epidemic.” The registered prevalence of autism in a Swedish urban area. J Autism Dev Disord 36(3):429–435, 2006 16568356
Gurney JG, Fritz MS, Ness KK, et al: Analysis of prevalence trends of autism spectrum disorder in Minnesota. Arch Pediatr Adolesc Med 157(7):622–627, 2003 12860781
Harrison MJ, O’Hare AE, Campbell H, et al: Prevalence of autistic spectrum disorders in Lothian, Scotland: an estimate using the “capture-recapture” technique. Arch Dis Child 91(1):16–19, 2006 15886261
Hill AP, Zuckerman KE, Fombonne E: Epidemiology of autism spectrum disorders, in Handbook of Autism and Pervasive Developmental Disorders, Vol 1, 4th Edition. Edited by Volkmar FR, Rogers SJ, Paul R, Pelphrey KA. Hoboken, NJ, John Wiley and Sons, 2014, pp 57–96
Hoang VM, Le TV, Chu TTQ, et al: Prevalence of autism spectrum disorders and their relation to selected socio-demographic factors among children aged 18–30 months in northern Vietnam, 2017. Int J Ment Health Syst 13(1):29, 2019 31168317
Honda H, Shimizu Y, Rutter M: No effect of MMR withdrawal on the incidence of autism: a total population study. J Child Psychol Psychiatry 46(6):572–579, 2005 15877763
Icasiano F, Hewson P, Machet P, et al: Childhood autism spectrum disorder in the Barwon region: a community based study. J Paediatr Child Health 40(12):696–701, 2004 15569287
Idring S, Rai D, Dal H, et al: Autism spectrum disorders in the Stockholm Youth Cohort: design, prevalence and validity. PLoS One 7(7):e41280, 2012 22911770
Imm P, White T, Durkin MS: Assessment of racial and ethnic bias in autism spectrum disorder prevalence estimates from a US surveillance system. Autism 23(8):1927–1935, 2019 30892923
Individuals with Disabilities Education Act of 1990, Pub.L. No. 101–476, 104. Stat. 1142.
Isaksen J, Diseth TH, Schjølberg S, Skjeldal OH: Observed prevalence of autism spectrum disorders in two Norwegian counties. Eur J Paediatr Neurol 16(6):592–598, 2012 22342070
Jaber L, Zachor D, Diamond G: Epidemiology of autistic spectrum disorders in Israel: a multifactorial model suggesting lower prevalence among Ultra-Orthodox Jews. Int J Child Health Hum Dev 11(3):369–377, 2018
Kanner L: Autistic disturbances of affective contact. Nervous Child 2:217–250, 1943
Kataoka SH, Zhang L, Wells KB: Unmet need for mental health care among U.S. children: variation by ethnicity and insurance status. Am J Psychiatry 159(9):1548–1555, 2002 12202276
Kawamura Y, Takahashi O, Ishii T: Reevaluating the incidence of pervasive developmental disorders: impact of elevated rates of detection through implementation of an integrated system of screening in Toyota, Japan. Psychiatry Clin Neurosci 62(2):152–159, 2008 18412836
Kim YS, Leventhal BL, Koh Y-J, et al: Prevalence of autism spectrum disorders in a total population sample. Am J Psychiatry 168(9):904–912, 2011 21558103
Kim YS, Fombonne E, Koh Y-J, et al: A comparison of DSM-IV pervasive developmental disorder and DSM-5 autism spectrum disorder prevalence in an epidemiologic sample. J Am Acad Child Adolesc Psychiatry 53(5):500–508, 2014 24745950
King M, Bearman P: Diagnostic change and the increased prevalence of autism. Int J Epidemiol 38(5):1224–1234, 2009 19737791
Kocovská E, Biskupstø R, Carina Gillberg I, et al: The rising prevalence of autism: a prospective longitudinal study in the Faroe Islands. J Autism Dev Disord 42(9):1959–1966, 2012 22271195
Kulage KM, Goldberg J, Usseglio J, et al: How has DSM-5 affected autism diagnosis? A 5-year follow-up systematic literature review and meta-analysis. J Autism Dev Disord 50(6):2102–2127, 2020 30852784
Latif AHA, Williams WR: Diagnostic trends in autistic spectrum disorders in the South Wales valleys. Autism 11(6):479–487, 2007 17947285
Lazoff T, Zhong L, Piperni T, et al: Prevalence of pervasive developmental disorders among children at the English Montreal School Board. Can J Psychiatry 55(11):715–720, 2010 21070699
Levaot Y, Meiri G, Dinstein I, et al: Autism prevalence and severity in Bedouin-Arab and Jewish communities in southern Israel. Community Ment Health J 55(1):156–160, 2019 29388003
Lingam R, Simmons A, Andrews N, et al: Prevalence of autism and parentally reported triggers in a north east London population. Arch Dis Child 88(8):666–670, 2003 12876158
Lord C, Rutter M, Goode S, et al: Autism diagnostic observation schedule: a standardized observation of communicative and social behavior. J Autism Dev Disord 19(2):185–212, 1989 2745388
Lord C, Rutter M, Le Couteur A: Autism Diagnostic Interview–Revised: a revised version of a diagnostic interview for caregivers of individuals with possible pervasive developmental disorders. J Autism Dev Disord 24(5):659–685, 1994 7814313
Maenner MJ, Durkin MS: Trends in the prevalence of autism on the basis of special education data. Pediatrics 126(5):e1018–e1025, 2010 20974790
Maenner MJ, Rice CE, Arneson CL, et al: Potential impact of DSM-5 criteria on autism spectrum disorder prevalence estimates. JAMA Psychiatry 71(3):292–300, 2014 24452504
Maenner MJ, Shaw KA, Baio J, et al: Prevalence of autism spectrum disorder among children aged 8 years—Autism and Developmental Disabilities Monitoring Network, 11 Sites, United States, 2016. MMWR Surveill Summ 69(4):1–12, 2020 32214087
Mattila M-L, Kielinen M, Linna S-L, et al: Autism spectrum disorders according to DSM-IV-TR and comparison with DSM-5 draft criteria: an epidemiological study. J Am Acad Child Adolesc Psychiatry 50(6):583–592, 2011 21621142
May T, Sciberras E, Brignell A, Williams K: Autism spectrum disorder: updated prevalence and comparison of two birth cohorts in a nationally representative Australian sample. BMJ Open 7(5):e015549, 2017 28490562
Myers J, Hill AP, Zuckerman KE, Fombonne E: Epidemiology, in Autism Spectrum Disorders. Edited by Hollander E, Hagerman RJ, Fein D. Washington, DC, American Psychiatric Association Publishing, 2018, pp 1–48
Montiel-Nava C, Peña JA: Epidemiological findings of pervasive developmental disorders in a Venezuelan study. Autism 12(2):191–202, 2008 18308767
Nevison C, Zahorodny W: Race/Ethnicity-resolved time trends in United States: ASD prevalence estimates from IDEA and ADDM. J Autism Dev Disord 49(12):4721–4730, 2019
Nicholas JS, Carpenter LA, King LB, et al: Autism spectrum disorders in preschool-aged children: prevalence and comparison to a school-aged population. Ann Epidemiol 19(11):808–814, 2009 19541501
Nygren G, Cederlund M, Sandberg E, et al: The prevalence of autism spectrum disorders in toddlers: a population study of 2-year-old Swedish children. J Autism Dev Disord 42(7):1491–1497, 2012 22048962
Ouellette-Kuntz H, Coo H, Yu CT, et al: Prevalence of pervasive developmental disorders in two Canadian provinces. J Policy Pract Intell Disabil 3(3):164–172, 2006
Ouellette-Kuntz H, Coo H, Lam M, et al: The changing prevalence of autism in three regions of Canada. J Autism Dev Disord 44(1):120–136, 2014 23771514
Özerk K: Prevalence of autism/ASD in the capital city of Oslo, Norway. International Electronic Journal of Elementary Education 11(1):23–30, 2018
Parner ET, Thorsen P, Dixon G, et al: A comparison of autism prevalence trends in Denmark and Western Australia. J Autism Dev Disord 41(12):1601–1608, 2011
Parner ET, Baron-Cohen S, Lauritsen MB, et al: Parental age and autism spectrum disorders. Ann Epidemiol 22(3):143–150, 2012 22277122
Poovathinal SA, Anitha A, Thomas R, et al: Prevalence of autism spectrum disorders in a semiurban community in south India. Ann Epidemiol 26(9):663–665, 2016
Posserud M, Lundervold AJ, Lie SA, et al: The prevalence of autism spectrum disorders: impact of diagnostic instrument and non-response bias. Soc Psychiatry Psychiatr Epidemiol 45(3):319–327, 2010 19551326
Powell JE, Edwards A, Edwards M, et al: Changes in the incidence of childhood autism and other autistic spectrum disorders in preschool children from two areas of the West Midlands, UK. Dev Med Child Neurol 42(9):624–628, 2000 11034456
Raina SK, Kashyap V, Bhardwaj AK, et al: Prevalence of autism spectrum disorders among children (1–10 years of age): findings of a mid-term report from Northwest India. J Postgrad Med 61(4):243–246, 2015 26440394
Rajakumar K, Thomas SB, Musa D, et al: Racial differences in parents’ distrust of medicine and research. Arch Pediatr Adolesc Med 163(2):108–114, 2009 19188641
Randall M, Sciberras E, Brignell A, et al: Autism spectrum disorder: presentation and prevalence in a nationally representative Australian sample. Aust NZ J Psychiatry 50(3):243–253, 2016 26282446
Rice CE, Baio J, Van Naarden Braun K, et al: A public health collaboration for the surveillance of autism spectrum disorders. Paediatr Perinat Epidemiol 21(2):179–190, 2007 17302648
Rudra A, Belmonte MK, Soni PK, et al: Prevalence of autism spectrum disorder and autistic symptoms in a school-based cohort of children in Kolkata, India: prevalence of ASD in India. Autism Res 10(10):1597–1605, 2017
Rutter M: Autistic children: infancy to adulthood. Semin Psychiatry 2(4):435–450 1970
Saemundsen E, Magnússon P, Georgsdóttir I, et al: Prevalence of autism spectrum disorders in an Icelandic birth cohort. BMJ Open 3(6):e002748, 2013 23788511
Samadi SA, Mahmoodizadeh A, McConkey R: A national study of the prevalence of autism among five-year-old children in Iran. Autism 16(1):5–14, 2012 21610190
Scott FJ, Baron-Cohen S, Bolton P, Brayne C: Brief report: prevalence of autism spectrum conditions in children aged 5–11 years in Cambridgeshire, UK. Autism 6(3):231–237, 2002 12212915
Shattuck PT: The contribution of diagnostic substitution to the growing administrative prevalence of autism in US special education. Pediatrics 117(4):1028–1037, 2006 16585296
Shi L, Stevens GD: Disparities in access to care and satisfaction among U.S. children: the roles of race/ethnicity and poverty status. Public Health Rep 120(4):431–441, 2005
Skonieczna-Zydecka K, Gorzkowska I, Pierzak-Sominka J, et al: The prevalence of autism spectrum disorders in West Pomeranian and Pomeranian regions of Poland. J Appl Res Intellect Disabil 30(2):283–289, 2017 26771078
Sun X, Allison C, Wei L, et al: Autism prevalence in China is comparable to Western prevalence. Mol Autism 10(1):7, 2019 30858963
Taylor B, Jick H, Maclaughlin D:: Prevalence and incidence rates of autism in the UK: time trend from 2004–2010 in children aged 8 years. BMJ Open 3(10):e003219–e003219, 2013 24131525
van Bakel MME, Delobel-Ayoub M, Cans C, et al: Low but increasing prevalence of autism spectrum disorders in a French area from register-based data. J Autism Dev Disord 45(10):3255–3261, 2015 26048041
van Balkom ID, Bresnahan M, Vogtländer MF, et al: Prevalence of treated autism spectrum disorders in Aruba. J Neurodev Disord 1(3):197–204, 2009 21547715
Williams E, Thomas K, Sidebotham H, et al: Prevalence and characteristics of autistic spectrum disorders in the ALSPAC cohort. Dev Med Child Neurol 50(9):672–677, 2008 18754916
Windham GC, Anderson MC, Croen LA, et al: Birth prevalence of autism spectrum disorders in the San Francisco Bay area by demographic and ascertainment source characteristics. J Autism Dev Disord 41(10):1362–1372, 2011 21264681
Wong VCN, Hui SLH: Epidemiological study of autism spectrum disorder in China. J Child Neurol 23(1):67–72, 2008 18160559
World Health Organization: International Statistical Classification of Diseases and Related Health Problems, 10th Revision. Geneva, World Health Organization, 1992
Yang W, Xia H, Wen G, et al: Epidemiological investigation of suspected autism in children and implications for healthcare system: a mainstream kindergarten-based population study in Longhua District, Shenzhen. BMC Pediatr 15(1):207, 2015 26667375
Yeargin-Allsopp M, Rice C, Karapurkar T, et al: Prevalence of autism in a US metropolitan area. JAMA 289(1):49–55, 2003 12503976

Appendix: Prevalence Surveys of Autism Spectrum Disorders Since 2000

StudyLocationPopulationAge, yNumber affectedDiagnostic criteria% with normal IQSex ratio (M:F)Prevalence rate/10,00095% CI
Southeast Thames, U.K.
16,235
7
94
ICD-10
60
7.5 (83:11)
57.9
46.8–70.9
West Midlands, U.K.
58,654*
1–5
122
Clinical, ICD-10, DSM-IV
20.8
17.3–24.9
New Jersey
8,896
3–10
60
DSM-IV
51
2.8 (44:16)
67.4
51.5–86.7
Stafford, U.K.
15,500
2.5–6.5
96
ICD-10
74
3.9 (77:20)
61.9
50.2–75.6
England and Wales
10,438
5–15
27
DSM-IV, ICD-10
56
8.0 (24:3)
26.1
16.2–36.0
Cambridge, U.K.
33,598
5–11
196
ICD-10
4.0 (—)
58.3*
50.7–67.1*
Atlanta, GA
289,456
3–10
987
DSM-IV
32
4.0 (787:197)
34.0
32.0–36.0
Minnesota (2001–2002)
787,308*
6–11
4,094
Receipt of Minnesota SE services
52.0
50.4–53.6*
Northeast London, U.K.
186,206
5–14
567
ICD-10
4.8 (469:98)
30.5*
27.9–32.9*
Barwon, Australia
45,153*
2–17
177
DSM-IV
53
8.3 (158:19)
39.2
33.8–45.4*
Stafford, U.K.
10,903
4–6
64
ICD-10
70
6.1 (55:9)
58.7
45.2–74.9
South Thames, U.K. (1990–1991)
56,946
9–10
158
ICD-10
45
3.3 (121:37)
116.1
90.4–141.8
Montreal, Canada
27,749
5–17
180
DSM-IV
4.8 (149:31)
64.9
55.8–75.0
Scotland
134,661
0–15
443
ICD-10, DSM-IV
7.0 (369:53)
44.2
39.5–48.9
Göteborg, Sweden
32,568
7–12
262
DSM-III, DSM-IV,
Gillberg’s criteria
3.6 (205:57)
80.4
71.3–90.3
 
Manitoba and Prince Edward Island, Canada
227,526
1–14
657
DSM-IV
4.1 (527:130)
28.9*
26.8–31.2*
Northern California (1995–1999)
132,844
5–10
593
ICD-9-CM
5.4 (501:92)
45.0
41.2–48.4*
6 U.S. states
187,761
8
1,252
DSM-IV-TR
38–60
2.8–5.5 (—)
67.0
63.1–70.5*
14 U.S. states
407,578
8
2,685
DSM-IV-TR
55
3.4–6.5 (—)
66.0
63.0–68.0
South Wales
39,220
0–17
240
ICD-10, DSM-IV, Kanner’s and Gillberg’s criteria
6.8 (—)
61.2
53.9–69.4*
Hong Kong Registry, China
4,247,206
0–14
682
DSM-IV
30
6.6 (592:90)
16.1
14.9–17.3*
Maracaibo, Venezuela
254,905
3–9
430
DSM-IV-TR
3.3 (329:101)
17.0
13.0–20.0
Toyota, Japan
12,589
5–8
228
DSM-IV
66
2.8 (168:60)
181.1
159.2–205.9*
Avon, U.K.
14,062
11
86
ICD-10
85
6.8 (75:11)
61.9
48.8–74.9
 
Cambridgeshire, U.K.
8,824
5–9
83
ICD-10
94.0
75.0–116.0
South Carolina
8,156
4
65
DSM-IV-TR
44
4.7 (—)
80.0
61.0–99.0
Aruba
13,109
0–13
69
DSM-IV
59
6.7 (60:9)
52.6
41.0–66.6
11 U.S. states
308,038
8
2,757
DSM-IV
59
4.5 (—)
90.0
86.0–93.0
Stockholm, Sweden
24,084
6
147
DSM-IV, DSM-IV-TR, ICD-10
33
5.1 (123:24)
62.0
52.0–72.0
Montreal, Canada
23,635
5–17
187
DSM-IV
5.4 (158:29)
79.1
67.8–90.4
Stockholm, Sweden
113,391
6–10
250
DSM-IV
0
22.0
19.4–25.0*
Wisconsin
428,030
Elementary school age
3,831
DSM-IV-like criteria for Wisconsin SE services (by school district)
90.0
86.7–92.4*
Bergen, Norway
9,430
7–9
16
DSM-IV, ICD-10; included DAWBA and DISCO
7.0 (14:2)
87.0
Oman (national register)
528,335
0–14
113
DSM-IV-TR
2.9 (84:29)
1.4
1.2–1.7
England
7,333
16–98
72
ADOS
100
3.8 (—)
98.2
30.0–165.0
 
Goyang City, South Korea
55,266
7–12
201
DSM-IV
32
3.8 (—)
264.0
191.0–337.0
Northern Ostrobothnia County, Finland
5,484
8
37
DSM-IV-TR;
included ADOS-G
and ADI-R
65
1.8 (—)
84.0
61.0–115.0
Western Australia (1994–1999)
152,060
0–10
678
DSM-IV, DSM-IV-TR
4.1 (—)
51.0
47.0–55.3
Taiwan (National Health Research Institute)
229,457*
0–18
659
ICD-9
3.7 (—)
28.7
26.6–31.0*
San Francisco Bay Area, California (1994, 1996)
80,249
9
374
“Full syndrome autism”: California DDS, receipt of California SE services, or DSM-IV
6.5 (324:50)
47.0
42.0–52.0
14 U.S. states
337,093
8
3,820
DSM-IV
38
4.6 (—)
113.0
110.0–117.0
Sweden (Stockholm County register)
444,154
0–17
5,100
ICD-9, ICD-10, DSM-IV
57
2.6 (—)
115.0
112.0–118.0
Oppland and Hedmark, Norway
31,015
6–12
158
ICD-10; included ADOS-G and ADI-R
4.3
(128:30)
51.0
43.0–59.0
 
Faroe Islands, Denmark
7,128
15–24
67
ICD-10, DSM-IV, Gillberg’s criteria
2.7* (49:18)
94.0
73.0–119.0
Göteborg, Sweden
5,007
2
40
DSM-IV-TR
63*
4.0 (32:8)
80.0
57.0–109.0
Denmark (national register, 1980–2003)
1,311,736
6–29
9,556
ICD-8, ICD-9, ICD-10
4.1 (—)
72.9*
71.4–74.3*
Iran (national register)
1,320,334
5
826
ADI-R
4.3
(—)
6.4
5.8–6.7
Israel (Maccabi HMO registry)
423,524
1–12
2,034
DSM-IV
5.2 (—)
48.0
45.9–50.1
Iceland (national database)
22,229
6
267
ICD-10; included ADOS and ADI-R
55
2.8 (197:70)
120.1
106.6–135.3
U.K. (national database)
256,278
8
616
DSM-IV according to GPRD
24.0
22.2–26.0
11 U.S. states
363,749
8
5,338
DSM-IV
69
4.5 (—)
147.0
142.9–150.7
Prince Edward Island and Southeastern Ontario (2010), Canada
89,786
2–14
1,173
Diagnosis of ASD from qualified professional, NEDSAC
4.8* (896:186)
130.6*
123.4–138.3*
Quito, Ecuador
51,453
5–15
57
DSM-III, DSM-IV
4.7 (47:10)
11
8.6–14.3*
 
Himachal Pradesh, India
11,000
1-10
10
Clinical expertise
9
4.9–16.7*
France (4 regions)
307,751
7
1,123
ICD-10
53
4.1 (880:213)
36.5
34.4–38.7
Longhua District, Shenzhen, China
15,200
3–4
398
Clinical expertise
2.1
(268:130)
260
230–290
Galway, Waterford, and Cork, Ireland
5,457
6–11
63
DSM-IV-R
100
England
7,461
18+
107
DSM-IV-TR, ICD-10
1.43
(63:44)
110
30–190
11 U.S. states
346,978
8
5,063
DSM-IV-TR, ICD-9
68.4
4.5
(4.2:4.8)
146
142–150
Leon, Guanajuato, Mexico
12,116
8
36
DSM-IV-TR, SRS, ADOS, ADI-R
33
4.1 (29:7)
87.0
62.0–110.0
Shoranur, Kerala, India
18,480
1–30
43
DSM-IV-TR
2.1
23.3
17.3–31.3*
Kolkata, India
11,849
3–8
6
DSM, ICD
23
7–46
West Pomeranian and Pomeranian, Poland
708,029
0–16
2,514
ICD-10
4.3 (2,038:476)
35.0
34.1–36.9*
Palwal, Kangra, Dhenkanal, North Goa, and Hyderabad, India
3,964
2–9
44
DSM-IV-TR
111*
82.8–148.7*
 
11 U.S. states
325,483
8
5,473
DSM-IV-TR, DSM-5
69.0
4.0
168.0
164–173
Oslo, Norway
108,238
1–16
337
ICD-10
4.03
31.14
28.0–34.6*
Qatar
133,781
6–11
1099
DSM-5
4.3
114
89–146
5 U.S. states
58,467
4
783
DSM-IV-TR
53
2.6–4.4
134
125–144
5 U.S. states
59,456
4
907
DSM-IV-TR
56.4
3.4–4.7
153
143–163
6 U.S. states
70,887
4
1,208
DSM-IV-TR, DSM-5
53.9
3.0–5.2
170
161–180
Hanoi, Thai Binh, and Hoa Binh, Vietnam
17,277
1.5–2.5
130
DSM-IV
75.2
62.9–89.3
Jilin City, China
6,240
6–10
77
DSM-IV-TR, DSM-5
108.0
87.0–135.0

ADDM = Autism and Developmental Disabilities Monitoring; ADI-R = Autism Diagnostic Interview–Revised; ADOS = Autism Diagnostic Observation Schedule; ADOS-G = Autism Diagnostic Observation Schedule, Generic; CDC = Centers for Disease Control and Prevention; DAWBA = Development and Well-Being Assessment; DDS = Department of Developmental Services; DISCO = Diagnostic Interview for Social and Communication Disorders; GPRD = General Practice Research Database; HMO = health maintenance organization; NEDSAC = National Epidemiological Database for the Study of Autism in Canada; SE = special education; SRS = Social Responsiveness Scale.

*Value calculated by author.

Exception made for low population because data were pulled from wide sample distribution.

Information & Authors

Information

Published In

Go to Textbook of Autism Spectrum Disorders
Textbook of Autism Spectrum Disorders
Pages: 1 - 33

History

Published in print: 15 March 2022
Published online: 5 December 2024
© American Psychiatric Association Publishing

Authors

Details

Heather MacFarlane, B.A.
Alexandra C. Salem, M.S.
Grace Olive Lawley, B.A.
Alison Presmanes Hill, Ph.D.
Katharine E. Zuckerman, M.D., M.P.H.

Metrics & Citations

Metrics

Citations

If you have the appropriate software installed, you can download article citation data to the citation manager of your choice. Simply select your manager software from the list below and click Download.

For more information or tips please see 'Downloading to a citation manager' in the Help menu.

Format
Citation style
Style
Copy to clipboard

View Options

View options

PDF/EPUB

View PDF/EPUB

Login options

Already a subscriber? Access your subscription through your login credentials or your institution for full access to this article.

Personal login Institutional Login Open Athens login

Not a subscriber?

Subscribe Now / Learn More

PsychiatryOnline subscription options offer access to the DSM-5-TR® library, books, journals, CME, and patient resources. This all-in-one virtual library provides psychiatrists and mental health professionals with key resources for diagnosis, treatment, research, and professional development.

Need more help? PsychiatryOnline Customer Service may be reached by emailing [email protected] or by calling 800-368-5777 (in the U.S.) or 703-907-7322 (outside the U.S.).
Media

Figures

Other

Tables

Share

Share

Share article link

Share