Chapter 1. Epidemiology
Study Design and Methodological Issues
Case Definition
Case Identification or Ascertainment
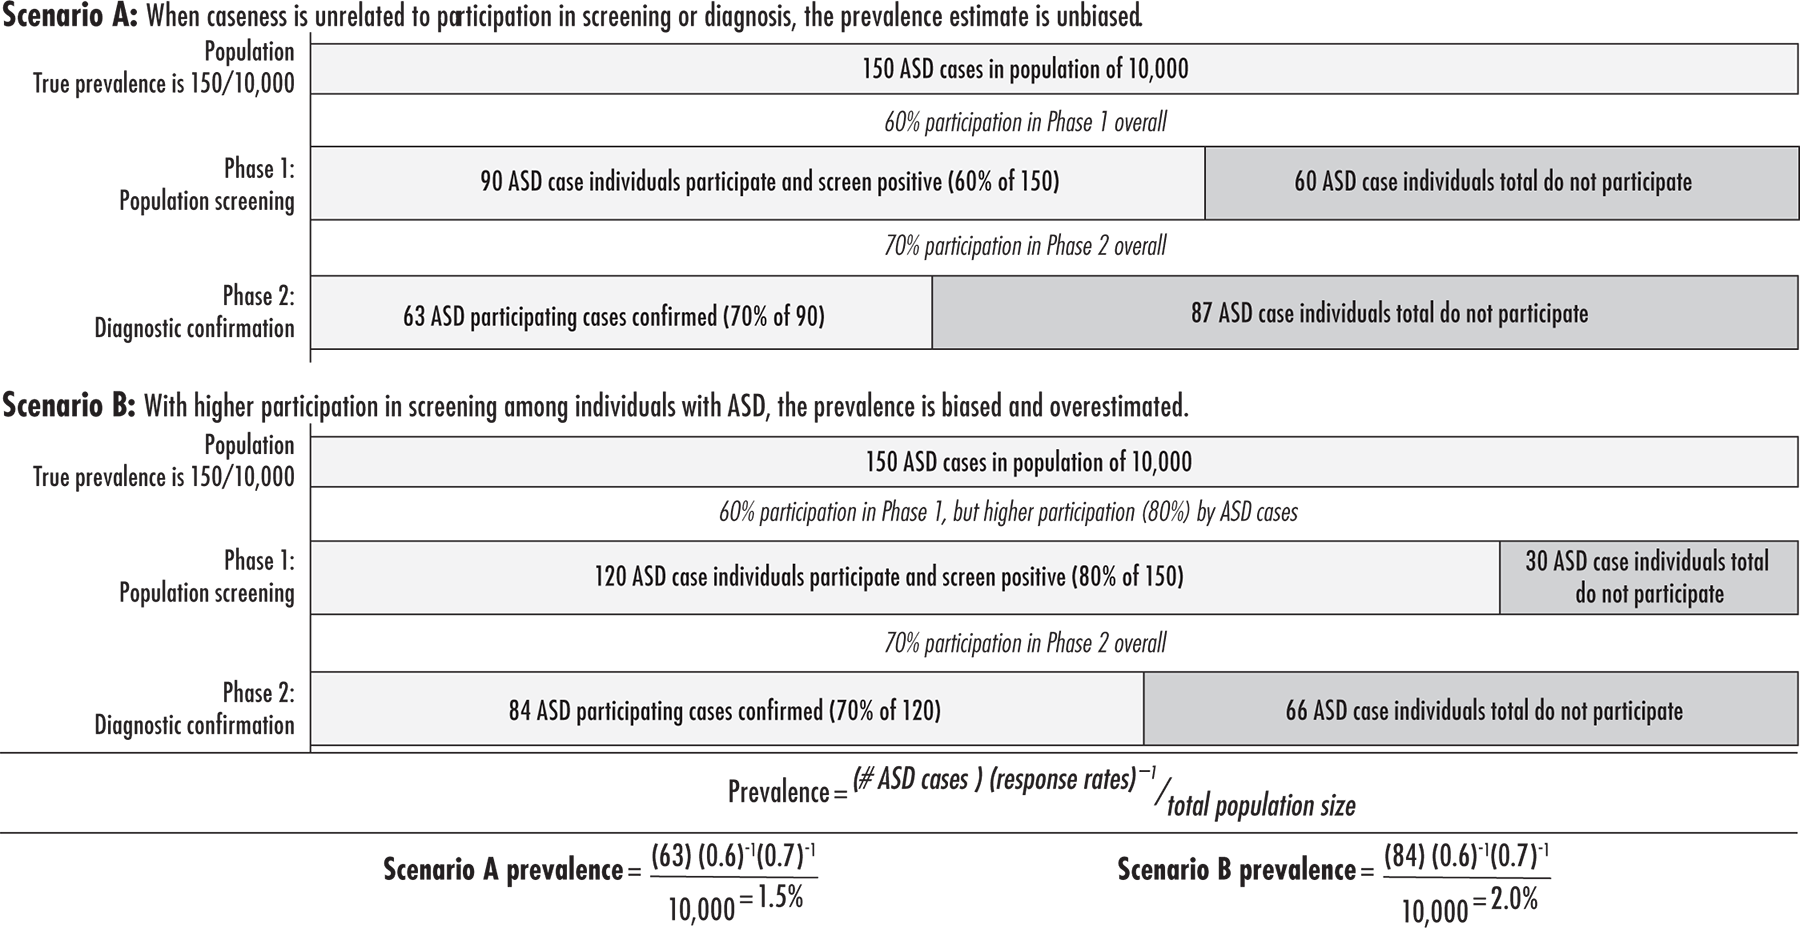
Case Evaluation
Systematic Review of Prevalence Estimates
Surveys Since 2000: Search Strategies
Prevalence Estimates for ASD Since 2000
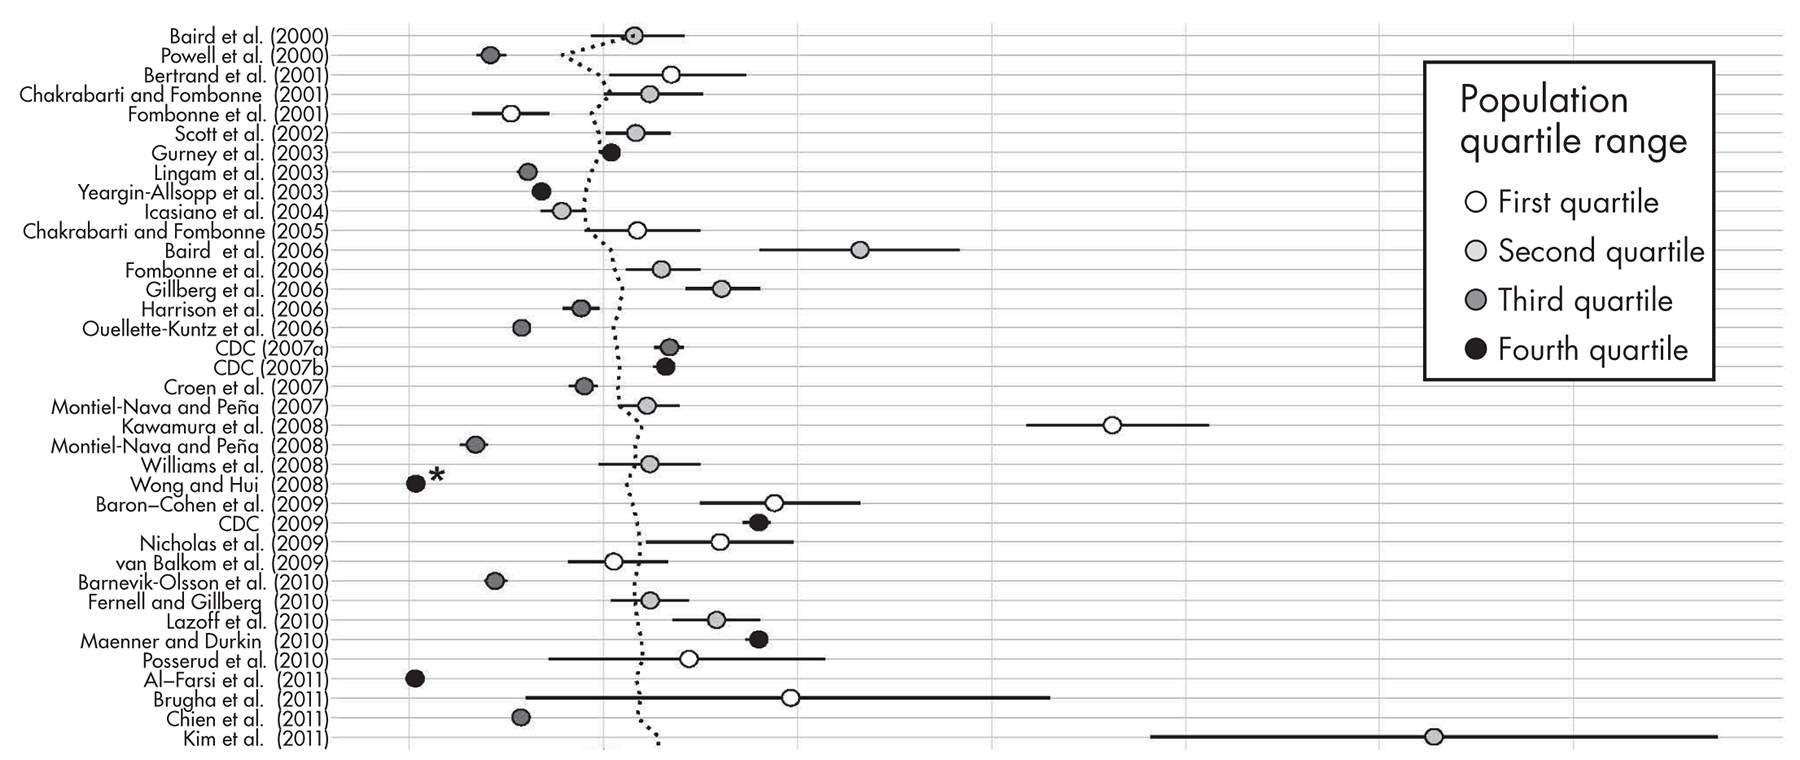
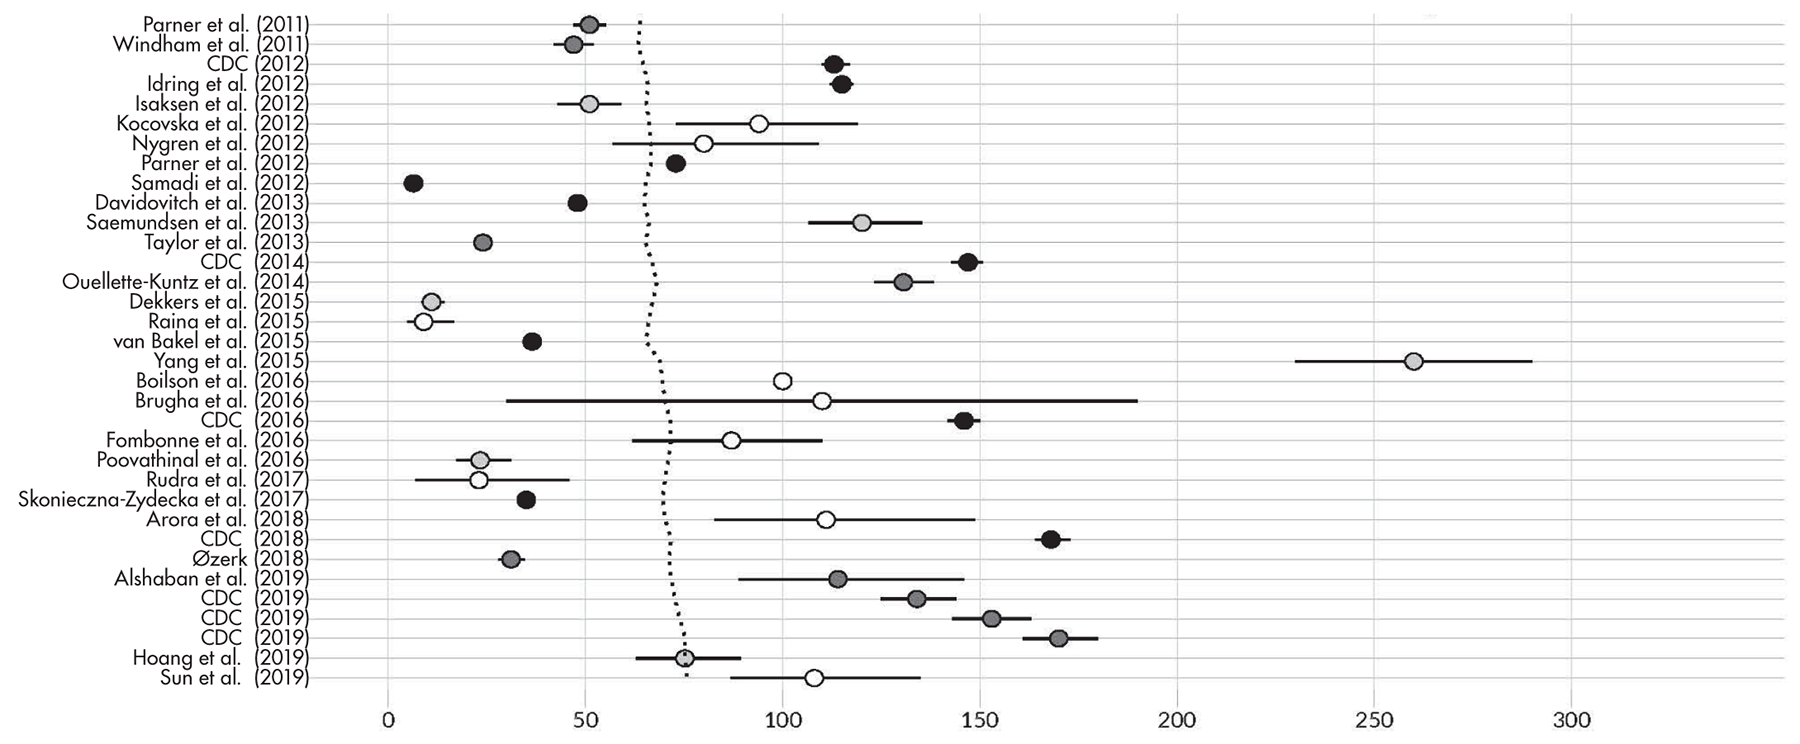
Time Trends in Prevalence and Their Interpretation
Reliance on Referral Statistics
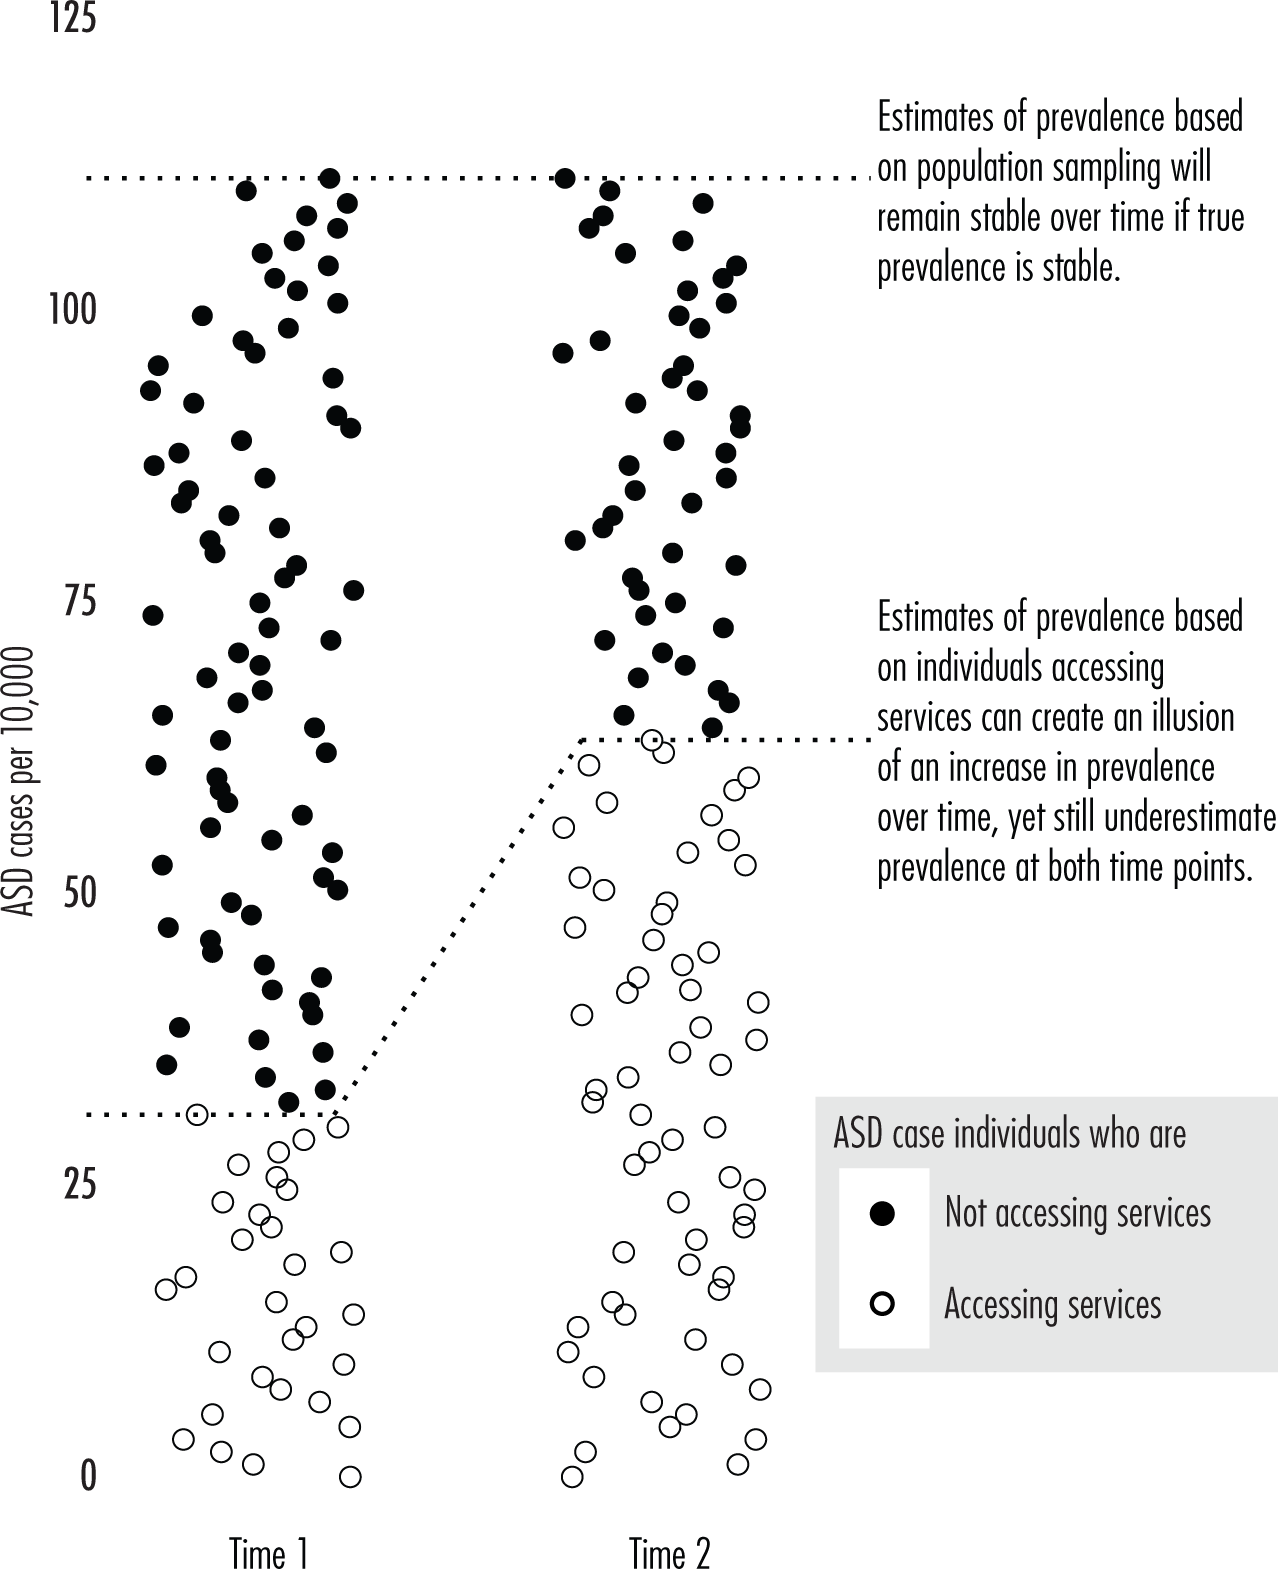
Diagnostic Substitution
Variability in Cross-Sectional Surveys
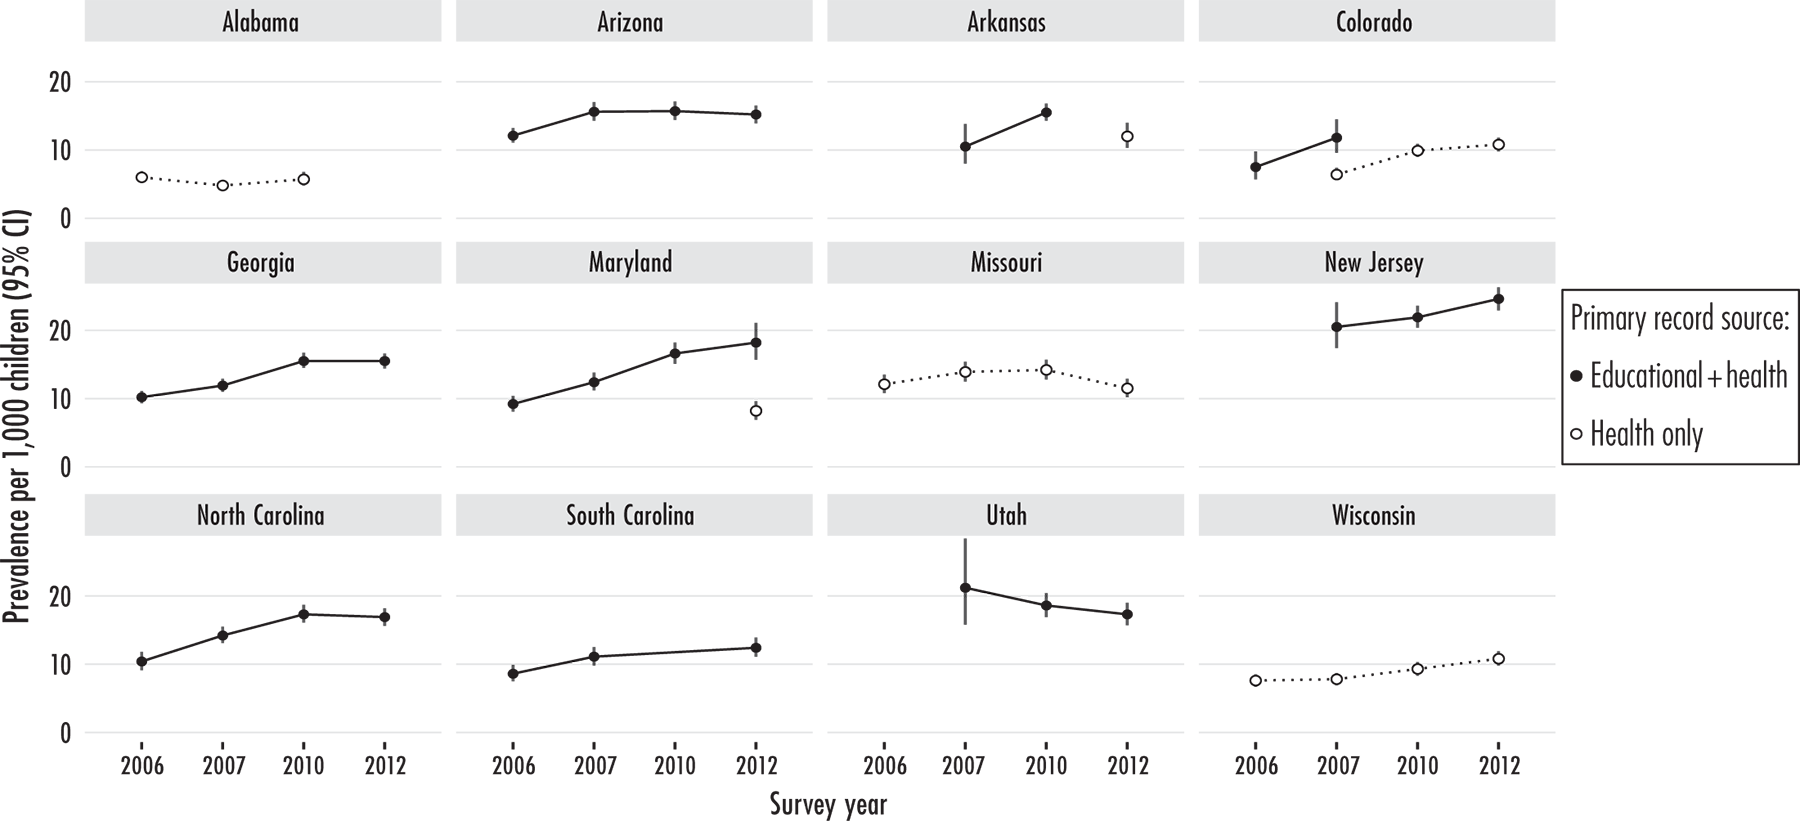
Repeated Surveys in Defined Geographical Areas
Birth Cohorts
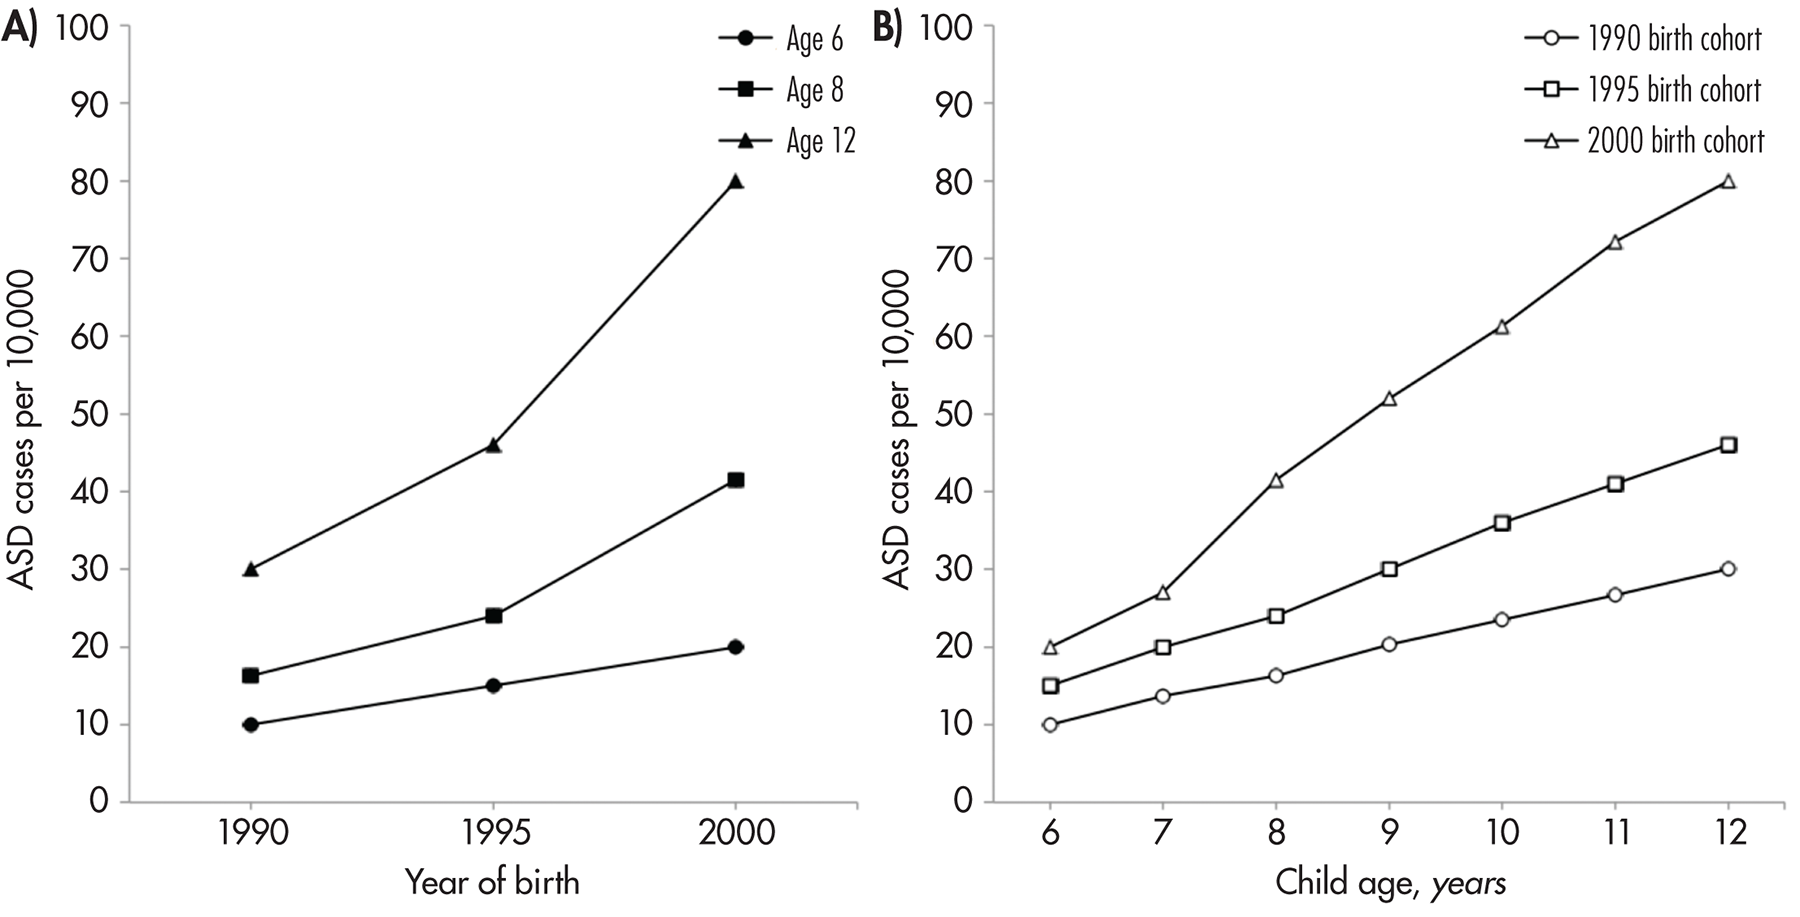
Social Class, Race, and Ethnic Minority Status
Socioeconomic Status
Race and Ethnicity
Implications and Unmet Research Needs
Conclusion
Key Points
Recommended Reading
Footnotes
References
Appendix: Prevalence Surveys of Autism Spectrum Disorders Since 2000
| Study | Location | Population | Age, y | Number affected | Diagnostic criteria | % with normal IQ | Sex ratio (M:F) | Prevalence rate/10,000 | 95% CI |
|---|---|---|---|---|---|---|---|---|---|
Southeast Thames, U.K. | 16,235 | 7 | 94 | ICD-10 | 60 | 7.5 (83:11) | 57.9 | 46.8–70.9 | |
West Midlands, U.K. | 58,654* | 1–5 | 122 | Clinical, ICD-10, DSM-IV | — | — | 20.8 | 17.3–24.9 | |
New Jersey | 8,896 | 3–10 | 60 | DSM-IV | 51 | 2.8 (44:16) | 67.4 | 51.5–86.7 | |
Stafford, U.K. | 15,500 | 2.5–6.5 | 96 | ICD-10 | 74 | 3.9 (77:20) | 61.9 | 50.2–75.6 | |
England and Wales | 10,438 | 5–15 | 27 | DSM-IV, ICD-10 | 56 | 8.0 (24:3) | 26.1 | 16.2–36.0 | |
Cambridge, U.K. | 33,598 | 5–11 | 196 | ICD-10 | — | 4.0 (—) | 58.3* | 50.7–67.1* | |
Atlanta, GA | 289,456 | 3–10 | 987 | DSM-IV | 32 | 4.0 (787:197) | 34.0 | 32.0–36.0 | |
Minnesota (2001–2002) | 787,308* | 6–11 | 4,094 | Receipt of Minnesota SE services | — | — | 52.0 | 50.4–53.6* | |
Northeast London, U.K. | 186,206 | 5–14 | 567 | ICD-10 | — | 4.8 (469:98) | 30.5* | 27.9–32.9* | |
Barwon, Australia | 45,153* | 2–17 | 177 | DSM-IV | 53 | 8.3 (158:19) | 39.2 | 33.8–45.4* | |
Stafford, U.K. | 10,903 | 4–6 | 64 | ICD-10 | 70 | 6.1 (55:9) | 58.7 | 45.2–74.9 | |
South Thames, U.K. (1990–1991) | 56,946 | 9–10 | 158 | ICD-10 | 45 | 3.3 (121:37) | 116.1 | 90.4–141.8 | |
Montreal, Canada | 27,749 | 5–17 | 180 | DSM-IV | — | 4.8 (149:31) | 64.9 | 55.8–75.0 | |
Scotland | 134,661 | 0–15 | 443 | ICD-10, DSM-IV | — | 7.0 (369:53) | 44.2 | 39.5–48.9 | |
Göteborg, Sweden | 32,568 | 7–12 | 262 | DSM-III, DSM-IV, Gillberg’s criteria | — | 3.6 (205:57) | 80.4 | 71.3–90.3 | |
Manitoba and Prince Edward Island, Canada | 227,526 | 1–14 | 657 | DSM-IV | — | 4.1 (527:130) | 28.9* | 26.8–31.2* | |
Northern California (1995–1999) | 132,844 | 5–10 | 593 | ICD-9-CM | — | 5.4 (501:92) | 45.0 | 41.2–48.4* | |
6 U.S. states | 187,761 | 8 | 1,252 | DSM-IV-TR | 38–60 | 2.8–5.5 (—) | 67.0 | 63.1–70.5* | |
14 U.S. states | 407,578 | 8 | 2,685 | DSM-IV-TR | 55 | 3.4–6.5 (—) | 66.0 | 63.0–68.0 | |
South Wales | 39,220 | 0–17 | 240 | ICD-10, DSM-IV, Kanner’s and Gillberg’s criteria | — | 6.8 (—) | 61.2 | 53.9–69.4* | |
Hong Kong Registry, China | 4,247,206 | 0–14 | 682 | DSM-IV | 30 | 6.6 (592:90) | 16.1 | 14.9–17.3* | |
Maracaibo, Venezuela | 254,905 | 3–9 | 430 | DSM-IV-TR | — | 3.3 (329:101) | 17.0 | 13.0–20.0 | |
Toyota, Japan | 12,589 | 5–8 | 228 | DSM-IV | 66 | 2.8 (168:60) | 181.1 | 159.2–205.9* | |
Avon, U.K. | 14,062 | 11 | 86 | ICD-10 | 85 | 6.8 (75:11) | 61.9 | 48.8–74.9 | |
Cambridgeshire, U.K. | 8,824 | 5–9 | 83 | ICD-10 | — | — | 94.0 | 75.0–116.0 | |
South Carolina | 8,156 | 4 | 65 | DSM-IV-TR | 44 | 4.7 (—) | 80.0 | 61.0–99.0 | |
Aruba | 13,109 | 0–13 | 69 | DSM-IV | 59 | 6.7 (60:9) | 52.6 | 41.0–66.6 | |
11 U.S. states | 308,038 | 8 | 2,757 | DSM-IV | 59 | 4.5 (—) | 90.0 | 86.0–93.0 | |
Stockholm, Sweden | 24,084 | 6 | 147 | DSM-IV, DSM-IV-TR, ICD-10 | 33 | 5.1 (123:24) | 62.0 | 52.0–72.0 | |
Montreal, Canada | 23,635 | 5–17 | 187 | DSM-IV | — | 5.4 (158:29) | 79.1 | 67.8–90.4 | |
Stockholm, Sweden | 113,391 | 6–10 | 250 | DSM-IV | 0 | — | 22.0 | 19.4–25.0* | |
Wisconsin | 428,030 | Elementary school age | 3,831 | DSM-IV-like criteria for Wisconsin SE services (by school district) | — | — | 90.0 | 86.7–92.4* | |
Bergen, Norway | 9,430 | 7–9 | 16 | DSM-IV, ICD-10; included DAWBA and DISCO | — | 7.0 (14:2) | 87.0 | — | |
Oman (national register) | 528,335 | 0–14 | 113 | DSM-IV-TR | — | 2.9 (84:29) | 1.4 | 1.2–1.7 | |
England | 7,333 | 16–98 | 72 | ADOS | 100 | 3.8 (—) | 98.2 | 30.0–165.0 | |
Goyang City, South Korea | 55,266 | 7–12 | 201 | DSM-IV | 32 | 3.8 (—) | 264.0 | 191.0–337.0 | |
Northern Ostrobothnia County, Finland | 5,484 | 8 | 37 | DSM-IV-TR; included ADOS-G and ADI-R | 65 | 1.8 (—) | 84.0 | 61.0–115.0 | |
Western Australia (1994–1999) | 152,060 | 0–10 | 678 | DSM-IV, DSM-IV-TR | — | 4.1 (—) | 51.0 | 47.0–55.3 | |
Taiwan (National Health Research Institute) | 229,457* | 0–18 | 659 | ICD-9 | — | 3.7 (—) | 28.7 | 26.6–31.0* | |
San Francisco Bay Area, California (1994, 1996) | 80,249 | 9 | 374 | “Full syndrome autism”: California DDS, receipt of California SE services, or DSM-IV | — | 6.5 (324:50) | 47.0 | 42.0–52.0 | |
14 U.S. states | 337,093 | 8 | 3,820 | DSM-IV | 38 | 4.6 (—) | 113.0 | 110.0–117.0 | |
Sweden (Stockholm County register) | 444,154 | 0–17 | 5,100 | ICD-9, ICD-10, DSM-IV | 57 | 2.6 (—) | 115.0 | 112.0–118.0 | |
Oppland and Hedmark, Norway | 31,015 | 6–12 | 158 | ICD-10; included ADOS-G and ADI-R | — | 4.3 (128:30) | 51.0 | 43.0–59.0 | |
Faroe Islands, Denmark | 7,128 | 15–24 | 67 | ICD-10, DSM-IV, Gillberg’s criteria | — | 2.7* (49:18) | 94.0 | 73.0–119.0 | |
Göteborg, Sweden | 5,007 | 2 | 40 | DSM-IV-TR | 63* | 4.0 (32:8) | 80.0 | 57.0–109.0 | |
Denmark (national register, 1980–2003) | 1,311,736 | 6–29 | 9,556 | ICD-8, ICD-9, ICD-10 | — | 4.1 (—) | 72.9* | 71.4–74.3* | |
Iran (national register) | 1,320,334 | 5 | 826 | ADI-R | — | 4.3 (—) | 6.4 | 5.8–6.7 | |
Israel (Maccabi HMO registry) | 423,524 | 1–12 | 2,034 | DSM-IV | — | 5.2 (—) | 48.0 | 45.9–50.1 | |
Iceland (national database) | 22,229 | 6 | 267 | ICD-10; included ADOS and ADI-R | 55 | 2.8 (197:70) | 120.1 | 106.6–135.3 | |
U.K. (national database) | 256,278 | 8 | 616 | DSM-IV according to GPRD | — | — | 24.0 | 22.2–26.0 | |
11 U.S. states | 363,749 | 8 | 5,338 | DSM-IV | 69 | 4.5 (—) | 147.0 | 142.9–150.7 | |
Prince Edward Island and Southeastern Ontario (2010), Canada | 89,786 | 2–14 | 1,173 | Diagnosis of ASD from qualified professional, NEDSAC | — | 4.8* (896:186) | 130.6* | 123.4–138.3* | |
Quito, Ecuador | 51,453 | 5–15 | 57 | DSM-III, DSM-IV | — | 4.7 (47:10) | 11 | 8.6–14.3* | |
Himachal Pradesh, India | 11,000 | 1-10 | 10 | Clinical expertise | — | — | 9 | 4.9–16.7* | |
France (4 regions) | 307,751 | 7 | 1,123 | ICD-10 | 53 | 4.1 (880:213) | 36.5 | 34.4–38.7 | |
Longhua District, Shenzhen, China | 15,200 | 3–4 | 398 | Clinical expertise | — | 2.1 (268:130) | 260 | 230–290 | |
Galway, Waterford, and Cork, Ireland | 5,457 | 6–11 | 63 | DSM-IV-R | — | — | 100 | — | |
England | 7,461 | 18+ | 107 | DSM-IV-TR, ICD-10 | — | 1.43 (63:44) | 110 | 30–190 | |
11 U.S. states | 346,978 | 8 | 5,063 | DSM-IV-TR, ICD-9 | 68.4 | 4.5 (4.2:4.8) | 146 | 142–150 | |
Leon, Guanajuato, Mexico | 12,116 | 8 | 36 | DSM-IV-TR, SRS, ADOS, ADI-R | 33 | 4.1 (29:7) | 87.0 | 62.0–110.0 | |
Shoranur, Kerala, India | 18,480 | 1–30 | 43 | DSM-IV-TR | — | 2.1 | 23.3 | 17.3–31.3* | |
Kolkata, India | 11,849 | 3–8 | 6 | DSM, ICD | — | — | 23 | 7–46 | |
West Pomeranian and Pomeranian, Poland | 708,029 | 0–16 | 2,514 | ICD-10 | — | 4.3 (2,038:476) | 35.0 | 34.1–36.9* | |
Palwal, Kangra, Dhenkanal, North Goa, and Hyderabad, India | 3,964† | 2–9 | 44 | DSM-IV-TR | — | — | 111* | 82.8–148.7* | |
11 U.S. states | 325,483 | 8 | 5,473 | DSM-IV-TR, DSM-5 | 69.0 | 4.0 | 168.0 | 164–173 | |
Oslo, Norway | 108,238 | 1–16 | 337 | ICD-10 | — | 4.03 | 31.14 | 28.0–34.6* | |
Qatar | 133,781 | 6–11 | 1099 | DSM-5 | — | 4.3 | 114 | 89–146 | |
5 U.S. states | 58,467 | 4 | 783 | DSM-IV-TR | 53 | 2.6–4.4 | 134 | 125–144 | |
5 U.S. states | 59,456 | 4 | 907 | DSM-IV-TR | 56.4 | 3.4–4.7 | 153 | 143–163 | |
6 U.S. states | 70,887 | 4 | 1,208 | DSM-IV-TR, DSM-5 | 53.9 | 3.0–5.2 | 170 | 161–180 | |
Hanoi, Thai Binh, and Hoa Binh, Vietnam | 17,277 | 1.5–2.5 | 130 | DSM-IV | — | — | 75.2 | 62.9–89.3 | |
Jilin City, China | 6,240 | 6–10 | 77 | DSM-IV-TR, DSM-5 | — | — | 108.0 | 87.0–135.0 | |
ADDM = Autism and Developmental Disabilities Monitoring; ADI-R = Autism Diagnostic Interview–Revised; ADOS = Autism Diagnostic Observation Schedule; ADOS-G = Autism Diagnostic Observation Schedule, Generic; CDC = Centers for Disease Control and Prevention; DAWBA = Development and Well-Being Assessment; DDS = Department of Developmental Services; DISCO = Diagnostic Interview for Social and Communication Disorders; GPRD = General Practice Research Database; HMO = health maintenance organization; NEDSAC = National Epidemiological Database for the Study of Autism in Canada; SE = special education; SRS = Social Responsiveness Scale.
*Value calculated by author.
†Exception made for low population because data were pulled from wide sample distribution.
Information & Authors
Information
Published In
History
Authors
Metrics & Citations
Metrics
Citations
If you have the appropriate software installed, you can download article citation data to the citation manager of your choice. Simply select your manager software from the list below and click Download.
For more information or tips please see 'Downloading to a citation manager' in the Help menu.
View Options
View options
PDF/EPUB
View PDF/EPUBLogin options
Already a subscriber? Access your subscription through your login credentials or your institution for full access to this article.
Personal login Institutional Login Open Athens loginNot a subscriber?
PsychiatryOnline subscription options offer access to the DSM-5-TR® library, books, journals, CME, and patient resources. This all-in-one virtual library provides psychiatrists and mental health professionals with key resources for diagnosis, treatment, research, and professional development.
Need more help? PsychiatryOnline Customer Service may be reached by emailing [email protected] or by calling 800-368-5777 (in the U.S.) or 703-907-7322 (outside the U.S.).
