Subjects were evaluated for their ability to provide informed consent before signing consent documents. All subjects gave written informed consent before participation in the study. This study was approved by the University of Maryland and Johns Hopkins University Institutional Review Boards.
Ten subjects with a DSM-IV-TR diagnosis of schizophrenia (8 men, mean age 42.6 [SD: 11.8]) participated in MRS and electrophysiology sessions, recorded separately. MRS was conducted on a 3T Achieva scanner (Philips Healthcare; Best, The Netherlands) equipped with an 8-channel SENSE head coil. Anatomical T
1-weighted images were acquired for spectroscopic voxel placement with a MP-RAGE sequence (SENSE factor 2, 1-mm isotropic voxels, 256 × 256 mm FOV, TR/TE/TI=8/3.8/842.5 msec, flip angle: 8°). Subjects were clinically stable and treated with antipsychotics (9 atypicals), but were not treated with anticonvulsants or benzodiazepines. GABA spectra were acquired from a 3.5 × 3.5 × 3.5 cc voxel in the medial prefrontal region with a MEGA-PRESS
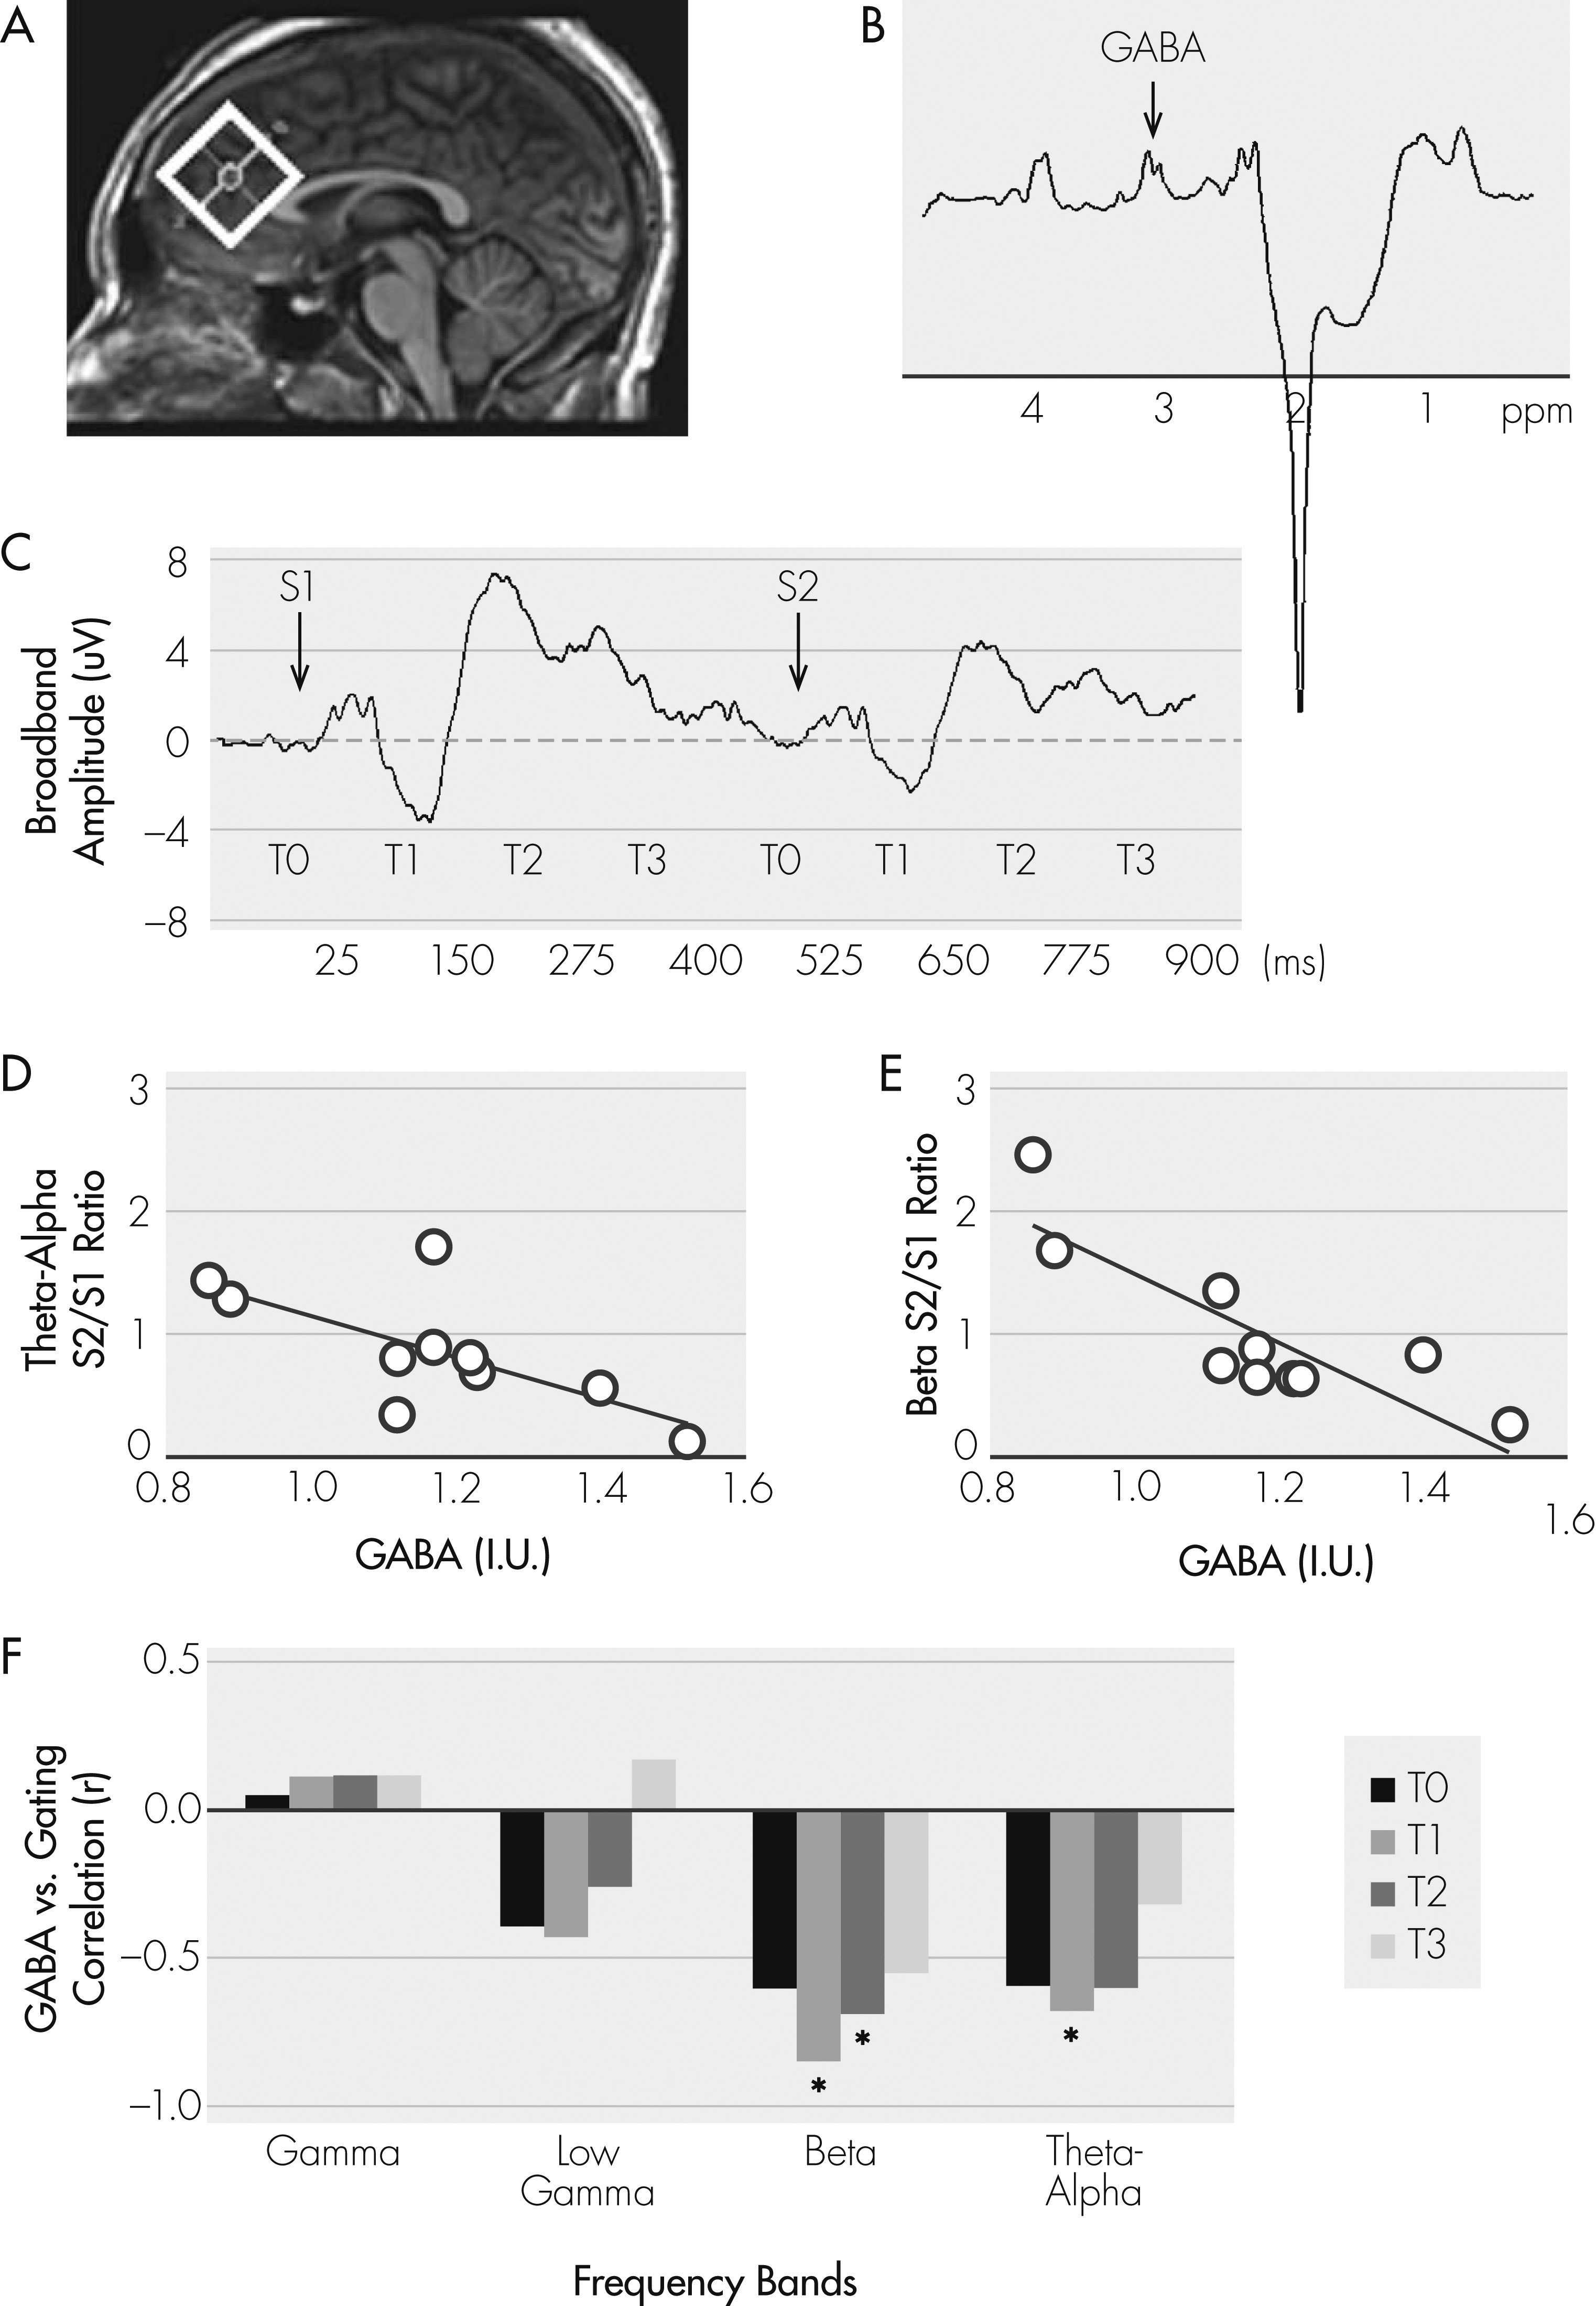
11,12 sequence optimized for detection of GABA (TR: 2.0 sec; TE: 68 msec; 14 msec editing pulse applied at 1.9 ppm and 7.5 ppm; 256 averages;
Figure 1A, B). The rationale for the frontal region for GABA is that generators of the P50 auditory sensory response have been localized at the auditory cortical areas, but the gating mechanism for P50 has been localized primarily to the frontal lobe.
13 The integral of the GABA peak was referenced to the integral of the unsuppressed water peak recorded from the same region,
12 and GABA levels were corrected for the proportion of cerebrospinal fluid in the spectroscopic voxel. Electroencephalograms (EEG) were collected during a paired-click paradigm, whereby subjects listened to 150 paired-click stimuli (1-msec duration; 72 dB; 500-msec interclick interval; 10-sec intertrial interval). EEGs were recorded with a 32-channel electrode cap at 1 kHz, using a 0.1–200 Hz filter, mastoid reference, and skin impedance <5 Kohms. Data epochs were thresholded at ±75 μV, followed by visual inspection to remove artifacts, filtered at 10–100 Hz, 24-dB slopes, and averaged to obtain P50. P50 gating was measured at electrode site CZ, calculated as the ratio of the AEP P50 peaks of the second click (S
2)/first click (S
1).
6 Discrete wavelet transform was applied to extract single-trial responses at theta-alpha (5–12 Hz), beta (12–20 Hz), low gamma (20–40 Hz), gamma (40–85 Hz), and very high gamma (>85 Hz) bands in response to S
1 and S
2. The temporal course of the response was broken into 125-msec windows in relationship to S
1 and S
2 (
Figure 1C). The S
2/S
1 ratio of each frequency band/temporal window was computed as a measure of frequency/time-specific gating.
6 Single-trial signal gating occurs primarily at the 25–150 msec (T
1) and 150–275 msec (T
2) post-stimulus windows at theta-alpha and beta bands.
6 Therefore, we expected GABA levels to predict gating of the theta-alpha and beta oscillations during T
1 and T
2.
The relationship between gating measures and GABA levels were analyzed with Pearson’s correlation and linear regression. Analyses were conducted with the Statistical Package for Social Sciences (SPSS), Version 12.0 software package. Alpha was set to 0.05 for a priori tests, and Bonferroni corrected for post hoc multiple comparisons.


