Full access
Clinical and Research Reports
Published Online: 31 August 2016

Cortical Thickness and Anxiety Symptoms Among Cognitively Normal Elderly Persons: The Mayo Clinic Study of Aging

Publication: The Journal of Neuropsychiatry and Clinical Neurosciences

Abstract

The authors conducted a cross-sectional study to investigate the association between anxiety symptoms and cortical thickness, as well as amygdalar volume. A total of 1,505 cognitively normal participants, aged ≥70 years, were recruited from the Mayo Clinic Study of Aging in Olmsted County, Minnesota, on whom Beck Anxiety Inventory and 3T brain MRI data were available. Even though the effect sizes were small in this community-dwelling group of participants, anxiety symptoms were associated with reduced global cortical thickness and reduced thickness within the frontal and temporal cortex. However, after additionally adjusting for comorbid depressive symptoms, only the association between anxiety symptoms and reduced insular thickness remained significant.
Late-life depression has been extensively investigated; however, less is known about anxiety in old age. Yet, subsyndromal symptoms of anxiety are prevalent in the elderly, with a reported 12-month prevalence rate of 26.2% for subthreshold anxiety, versus 5.6% for DSM-IV anxiety disorders.1 In addition, subsyndromal symptoms of anxiety are associated with poor outcomes such as cognitive decline,2 increased health care cost, and reduced health-related quality of life.3 Experts have recently suggested conceptualizing anxiety in late life as a dimensional rather than categorical construct.4 Based on this concept, it is crucial to investigate symptoms of anxiety rather than anxiety disorders. In addition, a National Institute on Aging and Alzheimer’s Association expert panel has called for characterizing and understanding the presymptomatic phase of Alzheimer’s disease (AD) by using biomarkers such as brain MRI.5 Investigating the association of subsyndromal anxiety with biomarkers in presymptomatic AD will be a value-added approach toward an understanding of presymptomatic AD.
Changes in cortical thickness have been observed in normal aging, mild cognitive impairment (MCI), Alzheimer’s disease dementia,6 and also in psychiatric disorders, including major depression7 and anxiety.8 An automated method has been developed to accurately measure cortical thickness across the entire brain, providing an opportunity to investigate the structural correlates of anxiety.9 Only few studies have examined cortical thickness in participants with anxiety disorders8 or symptoms.3,10 Most reports were based on small sample sizes and involved a wide age range, with mostly middle-aged participants.
The amygdala has been shown to play an important role in anxiety, with reports on reduced volume in panic disorder.11,12 A small number of studies also reported associations between hippocampal volume and anxiety.13 Even though, previous studies showed high co-occurrence of anxiety and depression1416 most previous imaging studies that investigated anxiety did not adjust for co-occurring depression.
We therefore sought to examine the associations between anxiety symptoms and cortical thickness in elderly community-dwelling participants. In addition, we performed further analyses also adjusting for depressive symptoms. Furthermore, we investigated the association between anxiety symptoms and the amygdalar, as well as hippocampal volume.

Methods

Setting

Participants were recruited from the Mayo Clinic Study of Aging. Details of the study procedures have been previously described.17 Briefly, the Mayo Clinic Study of Aging is an ongoing population-based study in Olmsted County, Minnesota that was designed to study the prevalence, incidence, and risk factors of cognitive aging, mild cognitive impairment, and dementia. Only participants who had undergone both brain MRI imaging and anxiety symptom assessment were included in this study. When we compared Mayo Clinic Study of Aging participants who underwent MRI versus others, we observed the following: compared with the study participants who did not undergo MRI, participants who underwent MRI scans had lower numbers of medical comorbidities (median: 3 versus 4, p<0.01), higher z-scores for global cognition (median: 0.52 versus 0.14, p<0.01), higher scores on the Short Test of Mental Status (median: 35 versus 34, p<0.01), and slightly lower numbers of anxiety (median: 1 versus 2, p<0.01) and depressive (median: 3.5 versus 4, p<0.01) symptoms. This study was approved by the Mayo Clinic and Olmsted Medical Center Institutional Review Boards, and written informed consent was obtained from every participant prior to enrollment in the study.

Cognitive Evaluation

Participants of the Mayo Clinic Study of Aging underwent face-to-face cognitive and risk factor evaluations that are published in detail elsewhere.17 Briefly, the assessment included 1) baseline evaluation (including Clinical Dementia Rating Scale18 and risk factor ascertainment (including Beck Anxiety Inventory) performed by a nurse or study coordinator and 2) neurological evaluation performed by behavioral neurologists. Participants also underwent neuropsychological evaluation of four cognitive domains: memory (delayed recall trials from the Auditory Verbal Learning Test19 and the Wechsler Memory Scale-Revised,20 Logical Memory and Visual Reproduction subtests); language (Boston Naming Test21 and category fluency); visuospatial (Wechsler Adult Intelligence Scale-Revised,22 Picture Completion and Block Design subtests); and executive function (Trail-Making Test, Part B23 and the Wechsler Adult Intelligence Scale-Revised, Digit Symbol subtest). In the Results section, the neuropsychological performance within the separate cognitive domains is expressed as z-score, which reflects the number of standard deviations the performance is above the mean.
An expert consensus panel of physicians, neuropsychologists, and nurses/study coordinators reviewed all the data for each participant and made the diagnosis of normal cognition, MCI, or dementia based on published criteria. Only participants with normal cognition were included in this study.

Measurement of Anxiety Symptoms

Within 150 days of the MRI scan, anxiety symptoms were measured using the Beck Anxiety Inventory (BAI), which is a validated, self-administered questionnaire.24 The BAI is an ordinal measurement consisting of 21 items that are assessed over the last week. The severity of each symptom is rated ranging from 0 to 3, with total scores ranging from 0 to 63.

MRI

Brain MRI scans were performed on 3-T scanners (Signa, GE Healthcare, Little Chalfont, United Kingdom) equipped with an eight-channel phased array coil (GE Healthcare). A three-dimensional magnetization-prepared rapid gradient echo sequence was performed,25,26 and images were corrected for bias field and for distortion due to gradient nonlinearity.27 Cortical thickness and amygdalar and hippocampal volumes were measured with FreeSurfer software, version 5.3.28 The following regions of interest (ROIs) of cortical thickness labeled by FreeSurfer were included in the analysis: frontal, temporal, and parietal thickness, as well as global cortical thickness, which was the mean thickness of all regions measured by FreeSurfer, including frontal, temporal, parietal, and occipital thickness. In addition, we investigated the following subregions within the frontal and temporal cortex: anterior cingulate cortex (ACC) (combined thickness of the rostral, isthmus, and caudal ACC cortex), dorsolateral prefrontal cortex (DLPFC) (combined superior frontal, rostral middle frontal, and caudal middle frontal cortex), ventrolateral prefrontal cortex (combined pars opercularis, pars triangularis, and pars orbitalis), and orbitofrontal cortex (OFC) (combined lateral and medial orbitofrontal cortex) as labeled by FreeSurfer. For a secondary analysis, we calculated amygdalar and hippocampal volumes that were measured by FreeSurfer and were adjusted by total intracranial volume measured by SPM12.29
Participation in imaging is voluntary and is available to all study participants. There are a few exceptions that will not allow a participant to be imaged (e.g., participants with pacemakers). Study participants can decline imaging for any reason. For ethical reasons, if they decline, no further effort is made to make them change their mind or inquire as to why they are unwilling.
The majority of participants underwent MRI within 120 days after the administration of the anxiety assessment. About 5% of our cohort had the MRI after 120 days. There was one subject with a maximum of 150 days between the BAI visit date and the MRI.

Measurement of Covariates

We defined the following variables as covariates: age, sex, education, medical comorbidity, antidepressant medication, and global cognition. Medical comorbidity was measured via the Charlson index, a widely used weighted index that accounts for number and severity of diseases.30 Global cognition was measured as a composite z-score computed from memory, executive function, visuospatial, and language domain scores from an extensive neuropsychological test battery described in detail elsewhere.17 Antidepressant medication use was self-reported and included use of selective serotonin reuptake inhibitors, serotonin-norepinephrine reuptake inhibitors, citalopram, and tetracyclic or tricyclic antidepressants.
Depressive and anxiety symptoms often co-occur in late life.3133 Therefore, when investigating the association of anxiety with biomarkers such as cortical thickness, it is critical to adjust for depressive symptoms in order to make sure that the observed association between anxiety and cortical thickness is not confounded by the comorbid depressive symptoms. It is for this reason that we adjusted for depressive symptoms as measured by Beck Depression Inventory-II (BDI-II).30 Similar to the BAI, the BDI-II is also an ordinal measurement consisting of 21 items. Depressive symptoms are assessed over the last 2 weeks and are rated in severity on a 4-point scale ranging from 0 to 3, with a total score ranging from 0 to 63.

Statistical Analysis

We conducted a cross-sectional study involving cognitively normal elderly individuals with available MRI and anxiety data. To test for pairwise differences in demographic characteristics, Wilcoxon two-sided rank sum tests were calculated for participants with BAI scores ≥1 versus participants without anxiety symptoms. When we examined the association between anxiety symptoms and MRI measures, we treated anxiety symptoms, measured by BAI, as a continuous variable, in order to avoid arbitrary categorical cut-offs. Therefore, we calculated Spearman rank-order correlations between MRI measures (cortical thickness by ROI, amygdalar, and hippocampal volumes) and BAI (as continuous variables) after adjusting for age, sex, education, medical comorbidity, global cognition, and antidepressant medication. We ran an additional analysis in which we also adjusted for depressive symptoms as measured by BDI-II.30 We computed estimates of associations using SAS System, version 9.3 software (SAS Institute, Cary, N.C.) and visually displayed the data as forest plots using R statistical software, version 3.0.2 (R Foundation for Statistical Computing, Vienna).

Results

The complete demographic characteristics are presented in 
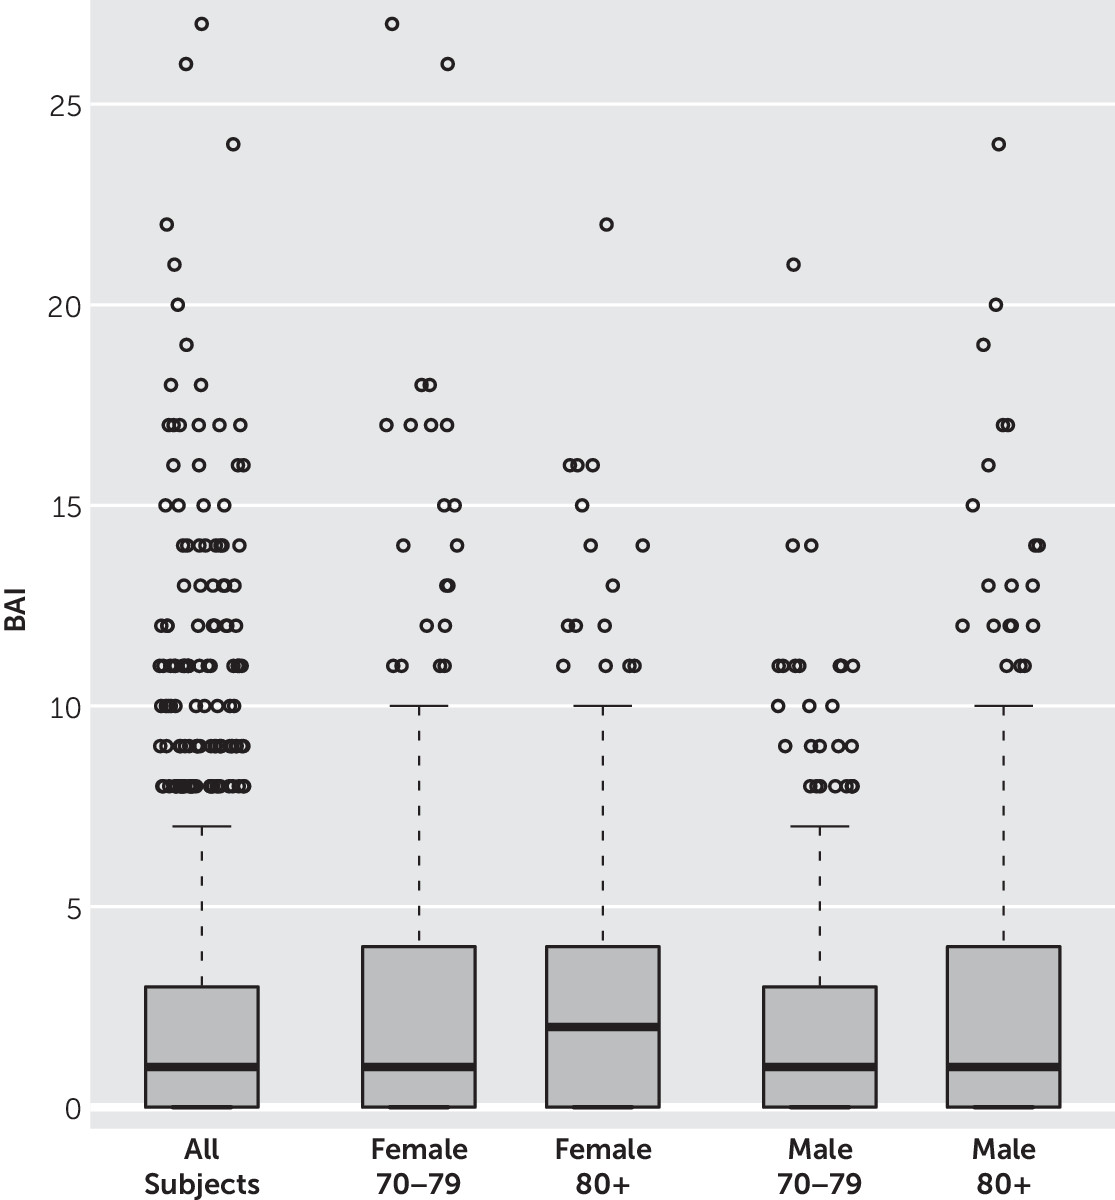
Table 1. Only a small percentage of this population-based study met the threshold for clinical anxiety (BAI >10; 5.3%) and depression (BDI >13; 5.6%). Participants with anxiety symptoms were significantly older, had fewer years of education, lower scores on the Short Test of Mental Status,34 lower z-scores for global cognition, higher number of depressive symptoms, and higher use of antidepressant medication compared with participants without anxiety symptoms.
TABLE 1. Demographic Characteristics of Study Participantsa
CharacteristicAll Study Participants (N=1,505)No Anxiety Symptoms (N=612)b≥1 Anxiety Symptoms (N=893)cp
Males, N (%)767 (51)345 (56)422 (47)<0.01
APOE ε4 carriers, N (%)380 (25)146 (24)234 (26)0.31
Age (years), median (IQR)77 (74 to 82)77 (73 to 81)78 (74 to 82)<0.01
Education (years), median (IQR)13 (12 to 16)14 (12 to 16)13 (12 to 16)<0.01
Short Test, median (IQR)35 (33 to 36)35 (33 to 37)35 (33 to 36)<0.01
Z scores of cognitive domains    
 Memory, median (IQR)0.50 (–0.21 to 1.17)0.57 (–0.17 to 1.23)0.43 (–0.23 to 1.11)0.03
 Language, median (IQR)0.37 (–0.17 to 0.95)0.39 (–0.09 to 0.96)0.36 (–0.24 to 0.93)0.17
 Attention, median (IQR)0.46 (–0.08 to 0.98)0.52 (0.00 to 1.05)0.42 (–0.16 to 0.95)<0.01
 Visuospatial, median (IQR)0.37 (–0.26 to 0.97)0.44 (–0.13 to 1.01)0.31 (–0.31 to 0.90)<0.01
 Global, median (IQR)0.52 (–0.08 to 1.06)0.62 (0.03 to 1.12)0.43 (–0.12 to 1.01)<0.01
Beck Anxiety Inventory, median (IQR)1 (0 to 3)0 (0 to 0)3 (1 to 5)<0.01
Beck Depression Inventory, median (IQR)3.5 (1 to 7)1 (0 to 4)5 (2 to 8)<0.01
Charlson Index, median (IQR)3 (2 to 5)3 (1 to 5)3 (2 to 5)0.02
Medications    
 Selective serotonin reuptake inhibitor/serotonin-norepinephrine reuptake inhibitors, N (%)150 (10)28 (5)122 (14)<0.01
 Citalopram, N (%)56 (4)12 (2)44 (5)<0.01
 Tetracyclic, N (%)13 (1)5 (1)8 (1)0.87
 Tricyclic, N (%)38 (3)13 (2)25 (3)0.41
 Any, N (%)195 (13)45 (7)150 (17)<0.01
a
The median (interquartile range [IQR]) is reported for continuous variables, and the counts (%) for categorical variables.
b
Categorically defined as no anxiety symptoms as reported by the Beck Anxiety Inventory.
c
Defined as a Beck Anxiety Inventory score ≥1.
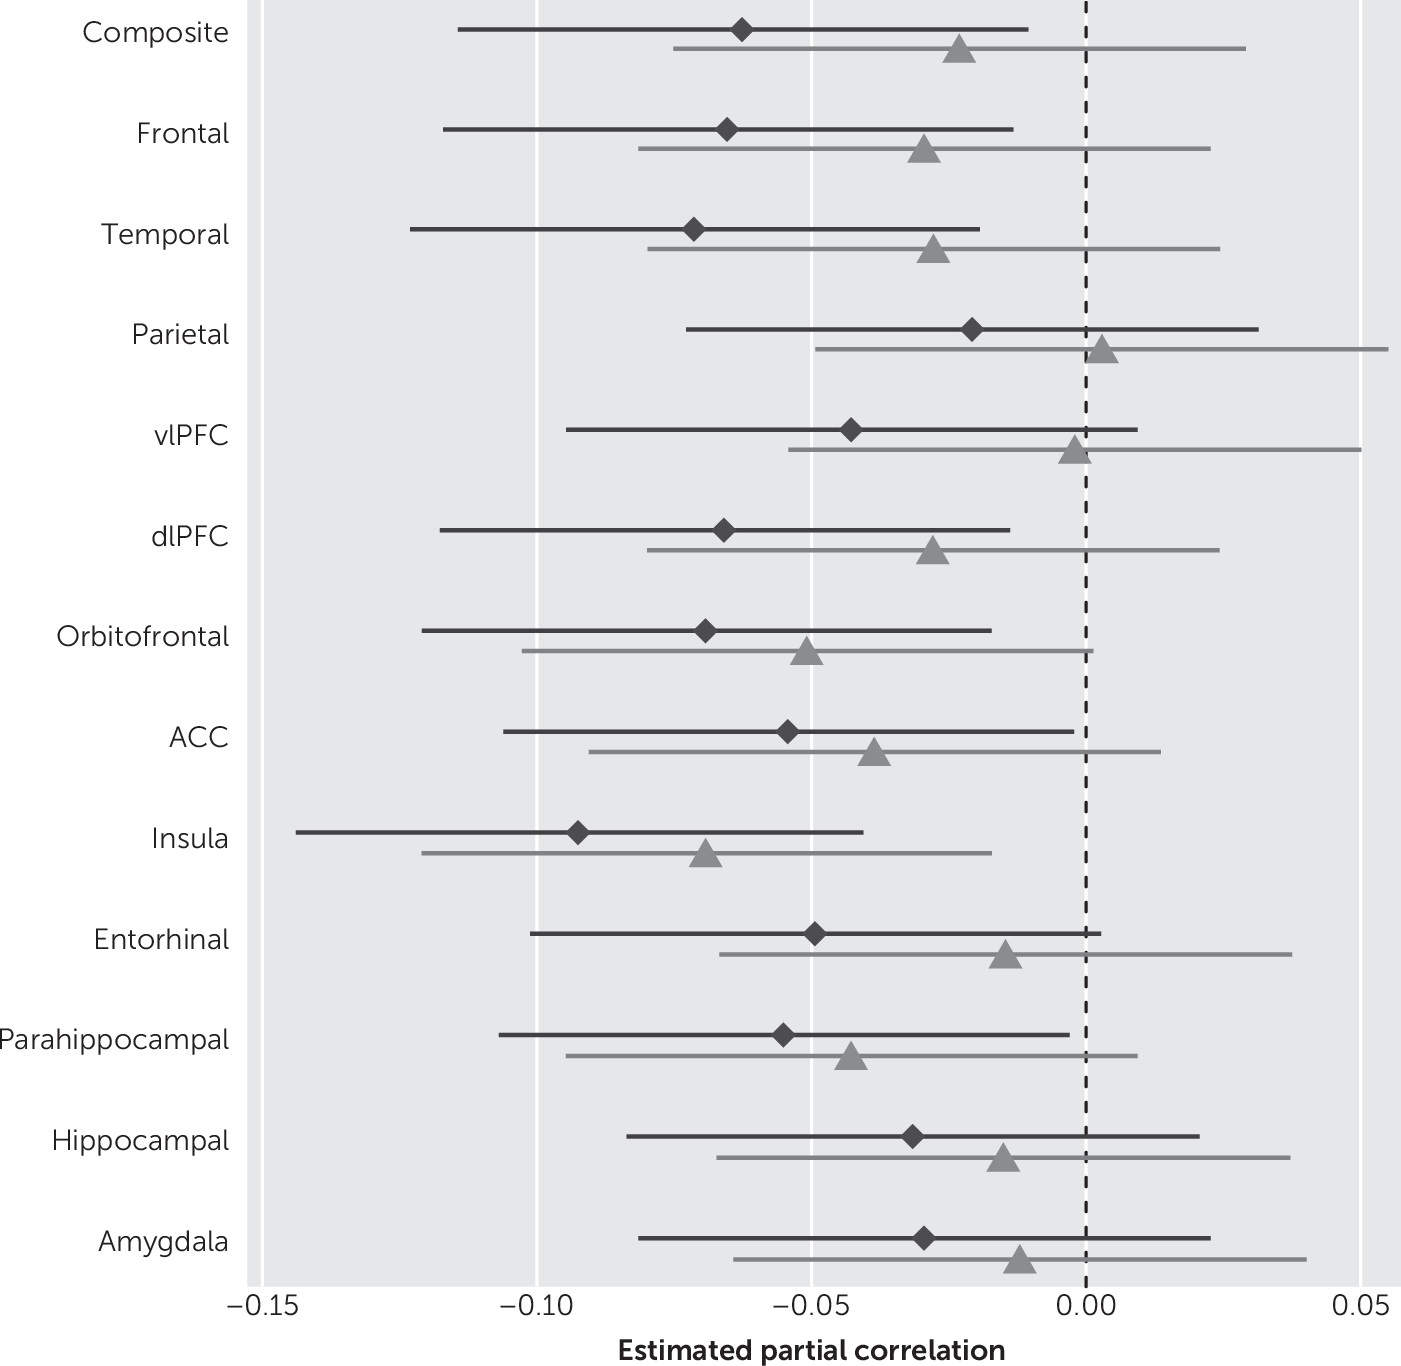
When examining anxiety symptoms as a continuous variable, we observed associations with reduced thickness in most ROIs in unadjusted models (Table 2). In multivariate analyses, the higher the BAI scores the lower the cortical thickness of the ROI, noted as follows: global/composite thickness (r=−0.06, p=0.02), frontal (r=−0.07, p=0.01), and temporal (r=−0.07, p<0.01), DLPFC (r=−0.07, p=0.01), insula (r=−0.09, p<0.01), parahippocampal (r=−0.06, p=0.04), and ACC (r=−0.05, p=0.04), after adjusting for age, sex, education, medical comorbidity, antidepressant medication, and global cognition. When we additionally adjusted for depressive symptoms (as measured by BDI-II), only the associations between anxiety symptoms and reduced insular cortical thickness remained significant (r=−0.07, p<0.01). We further observed a correlation between OFC with anxiety that nearly reached statistical significance (p=0.06) after correction for depression. A secondary analysis did not show associations between anxiety symptoms and amygdalar or hippocampal volume, after adjusting for age, sex, education, medical comorbidity, global cognition, and antidepressant medication use (Table 2). Figure 1 shows forest plots of the partial Spearman rank-order correlations, and Figure 2 shows a boxplot of the BAI scores by sex and age groups.
TABLE 2. Spearman Rank-Order Adjusted Correlations (p value) Between Anxiety Symptoms as Measured by the Beck Anxiety Inventory (BAI) and Cortical Thickness
RegionBAI Unadjusted r (95% CI)apBAI r (95% CI)bpAdditional Adjustment for the Beck Depression Inventory r (95% CI)bp
Composite–0.10 (–0.15 to –0.05)<0.01–0.06 (–0.11 to –0.01)0.02–0.02 (–0.08 to 0.03)0.39
Frontal–0.09 (–0.14 to –0.04)<0.01–0.07 (–0.12 to –0.01)0.01–0.03 (–0.08 to 0.02)0.27
Temporal–0.11 (–0.16 to –0.06)<0.01–0.07 (–0.12 to –0.02)<0.01–0.03 (–0.08 to 0.02)0.30
Parietal–0.06 (–0.11 to –0.01)0.03–0.02 (–0.07 to 0.03)0.430.00 (–0.05 to 0.06)0.91
Ventrolateral prefrontal cortex–0.07 (–0.12 to –0.02)0.01–0.04 (–0.09 to 0.01)0.11–0.00 (–0.05 to 0.05)0.94
Dorsolateral prefrontal cortex–0.10 (–0.15, –0.05)<0.01–0.07 (–0.12 to –0.01)0.01–0.03 (–0.08 to 0.02)0.29
Orbitofrontal–0.08 (–0.13 to –0.03)<0.01–0.07 (–0.12 to –0.02)<0.01–0.05 (–0.10 to 0.00)0.06
Anterior cingulate cortex–0.02 (–0.07 to 0.03)0.42–0.05 (–0.11 to –0.00)0.04–0.04 (–0.09 to 0.01)0.15
Insula–0.11 (–0.16 to –0.06)<0.01–0.09 (–0.14 to –0.04)<0.01–0.07 (–0.12 to –0.02)<0.01
Parahippocampal–0.07 (–0.12 to –0.02)<0.01–0.06 (–0.11 to –0.00)0.04–0.04 (–0.09, 0.01)0.11
Entorhinal–0.09 (–0.14 to –0.04)<0.01–0.05 (–0.10 to 0.00)0.06–0.01 (–0.07 to 0.04)0.58
Hippocampus volume–0.11 (–0.16 to –0.06)<0.01–0.03 (–0.08 to 0.02)0.24–0.02 (–0.07, 0.04)0.57
Amygdala volume–0.11 (–0.16 to –0.06)<0.01–0.03 (–0.08 to 0.02)0.27–0.01 (–0.06 to 0.04)0.65
a
These FreeSurfer volumes are also adjusted for total intracranial volume.
b
These partial correlations are after adjusting for age, sex, education, antidepressant medication, medical comorbidities, and global cognition.
FIGURE 1. Forest Plots of the Spearman Rank-Order Correlations Between Beck Anxiety Inventory and MRI Measuresa
a Diamonds: Adjusting for age, sex, education, antidepressant medication, medical comorbidities, and global cognition; triangles: Additionally adjusting for depressive symptoms. Hippocampal and amygdala volumes were additionally adjusted for total intracranial volume. Abbreviations: dlPFC=dorsolateral prefrontal cortex; vlPFC=ventrolateral prefrontal cortex; ACC=anterior cingulate cortex.
FIGURE 2. Box Plot of Beck Anxiety Inventory (BAI) Scores by Sex and Age Groupsa
a y-axis: BAI score.

Discussion

Herein we report the associations between cortical thickness and anxiety symptoms in a large sample of cognitively normal elderly participants enrolled in the population-based Mayo Clinic Study of Aging. In previous studies, we and others have shown that anxiety symptoms increase the risk of developing mild cognitive impairment in cognitively normal elderly participants. This may indicate that anxiety symptoms could be a marker of preclinical AD. Thus, we looked at elderly participants who were still free of MCI and dementia. We then sought to examine whether there was already a structural correlate to anxiety symptoms. However, since these are cross-sectional data, whatever is reported about structural biomarker relationships is not yet answering this question of preclinical AD indicators.
We observed associations between anxiety symptoms and lower global thickness, as well as lower thickness in frontal and temporal cortical regions, after adjusting for age, sex, education, medical comorbidity, antidepressant medication, and global cognition. The results changed markedly after we additionally adjusted for depressive symptoms. Furthermore, as expected, the effect sizes were very small. In contrast to patients from clinical settings, we randomly sampled and recruited participants from the general population with the result that participants had very mild symptoms of anxiety. Only a small percentage of this population-based study met the threshold for clinical anxiety (BAI >10; 5.3%).
Several studies have examined associations between brain volumes and disorders of anxiety, based on categorical classifications, for example, generalized anxiety disorder or panic disorder. They mainly reported altered volumes of the amygdala,11,12,35 insular cortex,13,3537 and ACC.10,36,37 Few studies also reported altered volumes in the prefrontal cortex3,10,12 and temporal regions.12,38,39 However, little is known about the association between cortical thickness and anxiety symptoms in the elderly. Moreover, most previous studies that examined anxiety did not specifically adjust for comorbid depression. Yet, our study findings changed markedly after additionally adjusting for depressive symptoms. While the associations with various regions remained in the same direction, only the association between anxiety symptoms and reduced insula thickness remained statistically significant and the association between OFC with anxiety remained marginally significant after additionally adjusting for depressive symptoms. This finding suggests that many regions that appear to be associated with anxiety could be rather confounded by the presence of co-occurring depressive symptoms. Indeed, our data suggest that only insular thickness may specifically be associated with anxiety symptoms. This is in line with previous studies that have shown an association between reduced insular volume and disorders of anxiety.13,3537 The role of reduced insular thickness in anxiety symptoms may be explained by the insula’s high interconnections with other cortical and subcortical regions. Moreover, the insula has been shown to be involved in emotional response, and its size and reactivity have been linked to awareness of bodily responses, and especially anxiety.40
We observed no relationship between anxiety symptoms and hippocampal or parahippocampal MRI measures. This may indicate that anxiety may not be a valuable predictor for AD risk in the subclinical stages of AD. The amygdala is probably the most widely investigated region in anxiety,3,11,35 and several studies have reported associations between reduced amygdalar volume and anxiety disorders.11,12 We only observed significant associations in our unadjusted results. However, similar to other studies that investigated mild anxiety symptoms,2,10 we also did not observe significant associations between amygdalar volume and very mild anxiety symptoms in community-dwelling participants after adjusting for multiple possible confounders. This may indicate that in contrast to studies that reported significant associations with clinical anxiety disorders, mild symptoms in community-dwelling individuals may not be severe enough to manifest associations with lower amygdalar volume.
Additionally, we conducted further analyses in order to explore correlations among the components of neuronal circuitry related to anxiety. Indeed, we observed significant correlations between the insular cortex and orbitofrontal cortex (r=0.54, p<0.01), as well as between the insular cortex and amygdala (r=0.08, p<0.01). This finding is consistent with previous reports.10
Investigators from Italy examined associations between anxiety symptoms, as measured by the Hamilton Anxiety Rating Scale, and amygdalar and hippocampal volume, as well as cortical thickness, in the OFC and ACC in 121 participants with a median age of 36 years. While, similar to our findings, they did not observe reduced amygdalar or hippocampal volume; they also reported associations between anxiety scores and increased ACC thickness.10 Whereas they and others reported increased thickness,2,9,36 other studies have reported reduced ACC volume in individuals with panic disorder.36,37 We observed weak associations between reduced ACC thickness and anxiety symptoms, as measured by BAI, after adjusting for age, sex, education, medical comorbidity, antidepressant medication, and global cognition. Discrepancies across studies may be attributable to methodological issues, including differences in anxiety assessment and participant age groups. Since age is associated with reduced cortical thickness,41 it is possible that studies involving younger individuals may show different results and that associations between anxiety symptoms and lower cortical thickness do not manifest until old age. While the mechanisms that may underlie reduced cortical thickness are not fully understood, it has been reported that the neuronal number is not reduced in age-related cortical atrophy.42 Thus, cortical thinning may be rather associated with neuronal shrinkage or degeneration of synapses. While our cross-sectional study does not provide information about the causal relationship between cortical thickness and anxiety symptoms, we hypothesize that underlying pathological neurodegeneration may result in reduction of synapses in cortical circuits involving the insula. This in turn may be seen on MRI as cortical thinning and lead to anxiety symptoms. Alternatively, it is possible that an additional risk factor may synergistically interact with the cortical thinning pathway and lead to anxiety symptoms. It also seems plausible that a confounder such as age may lead to both cortical thinning and anxiety symptoms.
Our study should be interpreted in light of its strengths and limitations. An important strength is that participants were from a large, well-described population-based study, thereby reducing selection bias as would occur with a clinic-based setting. The comprehensive clinical evaluation and access to medical record information from the Rochester Epidemiology Project provided the opportunity to adjust for multiple possible confounders, including age, sex, education, antidepressant medication use, medical comorbidities, and cognition. In contrast to most previous studies, we also adjusted for depressive symptoms. The comorbidity between anxiety and depression is very high; therefore, we additionally adjusted for depressive symptoms. The observed association between anxiety and cortical thickness remained the same, indicating that the association is over and above what can be explained by comorbid depressive symptoms. Furthermore, the study sample allowed us to investigate associations of anxiety with imaging variables (i.e., cortical thickness and amygdalar and hippocampal volume) in more than 1,500 participants. Additionally, we examined associations between anxiety symptoms and cortical thickness as continuous variables, whereas most previous studies chose categorical classifications.
This study also has potential limitations. The BAI is a self-reported questionnaire and may therefore be subject to recall bias. However, the BAI is a well-validated and widely used scale.24 Additionally, our study is limited by its cross-sectional design, which does not allow for interpretations of the direction of causality. Therefore, longitudinal studies are needed to replicate our findings. Furthermore, even though the Mayo Clinic Study of Aging extensively evaluates cognition and we were able to exclude participants with MCI or dementia from this study, we could not account for subjective cognitive impairment, which can also be accompanied by symptoms of anxiety.
Our findings indicate that a higher level of anxiety symptoms was associated with lower thickness in various cortical regions after adjusting for age, sex, education, medical comorbidity, antidepressant medication, and global cognition. This cross-sectional association is informative in that a dimensional approach has raised an important hypothesis that needs to be tested in a future longitudinal cohort study to investigate as to who will eventually develop further neurodegeneration leading to a phenotype of cognitive impairment. However, after additionally adjusting for depressive symptoms, the findings changed markedly, and only the association between anxiety symptoms and reduced insular thickness remained significant. Therefore, this finding may provide insight into the specific structural correlates of anxiety symptoms after adjusting for possible confounding effects of co-occurring depression.

Footnotes

Supported by the National Institute of Mental Health (grant K01 MH068351 [to Dr. Geda]) and the National Institute on Aging (grant U01 AG006786 [to Dr. Petersen] and grant K01 AG028573 [to Dr. Roberts]). Also supported by the Robert Wood Johnson Foundation (to Dr. Geda), the Robert H. and Clarice Smith and Abigail Van Buren Alzheimer’s Disease Research Program (to Drs. Petersen and Geda), the European Regional Development Fund: FNUSA-ICRC (number, CZ.1.05/1.1.00/02.0123 [to Drs. Stokin and Geda]), and the Arizona Alzheimer’s Consortium (to Dr. Geda).
The funding sources had no role in the design and conduct of the study; collection, management, analysis, and interpretation of the data; preparation, review, or approval of the manuscript; and decision to submit the study for publication.
Dr. Knopman serves as Deputy Editor for Neurology; he also serves on a data safety monitoring board for the Dominantly Inherited Alzheimer’s Network Trials Unit and for Lundbeck Pharmaceuticals, as well as for Lilly Pharmaceuticals; he has served as a consultant to Tau RX and as an investigator in clinical trials sponsored by Baxter and Elan Pharmaceuticals; and he receives research support from NIH. Dr. Jack has provided consulting services to Eli Lilly and is a shareholder with Johnson and Johnson; and he receives research funding from the Alexander Family Alzheimer’s Disease Research Professorship of the Mayo Foundation and from NIH (grants R01-AG011378, RO1 AG041851, U01-AG06786, U01-AG024904, R01 AG37551, R01AG043392). Dr. Petersen has served as a consultant to Genentech, Merck, and Roche and as chair of the data monitoring committees of Janssen Alzheimer Immunotherapy and Pfizer. All other authors report no financial relationships with commercial interests.

References

1.
Grenier S, Préville M, Boyer R, et al: Scientific Committee of the ESA Study: The impact of DSM-IV symptom and clinical significance criteria on the prevalence estimates of subthreshold and threshold anxiety in the older adult population. Am J Geriatr Psychiatry 2011; 19:316–326
2.
Geda YE, Roberts RO, Mielke MM, et al: Baseline neuropsychiatric symptoms and the risk of incident mild cognitive impairment: a population-based study. Am J Psychiatry 2014; 171:572–581
3.
Creed F, Morgan R, Fiddler M, et al: Depression and anxiety impair health-related quality of life and are associated with increased costs in general medical inpatients. Psychosomatics 2002; 43:302–309
4.
Miloyan B, Byrne GJ, Pachana NA: Threshold and subthreshold generalized anxiety disorder in later life. Am J Geriatr Psychiatry 2015; 23:633–641
5.
Sperling RA, Aisen PS, Beckett LA, et al: Toward defining the preclinical stages of Alzheimer’s disease: recommendations from the National Institute on Aging-Alzheimer’s Association workgroups on diagnostic guidelines for Alzheimer’s disease. Alzheimers Dement 2011; 7:280–292
6.
Singh V, Chertkow H, Lerch JP, et al: Spatial patterns of cortical thinning in mild cognitive impairment and Alzheimer’s disease. Brain 2006; 129:2885–2893
7.
Grieve SM, Korgaonkar MS, Koslow SH, et al: Widespread reductions in gray matter volume in depression. Neuroimage Clin 2013; 3:332–339
8.
Frick A, Howner K, Fischer H, et al: Cortical thickness alterations in social anxiety disorder. Neurosci Lett 2013; 536:52–55
9.
Fischl B, Dale AM: Measuring the thickness of the human cerebral cortex from magnetic resonance images. Proc Natl Acad Sci USA 2000; 97:11050–11055
10.
Donzuso G, Cerasa A, Gioia MC, et al: The neuroanatomical correlates of anxiety in a healthy population: differences between the State-Trait Anxiety Inventory and the Hamilton Anxiety Rating Scale. Brain Behav 2014; 4:504–514
11.
Hayano F, Nakamura M, Asami T, et al: Smaller amygdala is associated with anxiety in patients with panic disorder. Psychiatry Clin Neurosci 2009; 63:266–276
12.
Massana G, Serra-Grabulosa JM, Salgado-Pineda P, et al: Amygdalar atrophy in panic disorder patients detected by volumetric magnetic resonance imaging. Neuroimage 2003; 19:80–90
13.
Moon CM, Kim GW, Jeong GW: Whole-brain gray matter volume abnormalities in patients with generalized anxiety disorder: voxel-based morphometry. Neuroreport 2014; 25:184–189
14.
Beekman AT, de Beurs E, van Balkom AJ, et al: Anxiety and depression in later life: co-occurrence and communality of risk factors. Am J Psychiatry 2000; 157:89–95
15.
Flint AJ: Epidemiology and comorbidity of anxiety disorders in the elderly. Am J Psychiatry 1994; 151:640–649
16.
Kessler RC, Birnbaum HG, Shahly V, et al: Age differences in the prevalence and co-morbidity of DSM-IV major depressive episodes: results from the WHO World Mental Health Survey Initiative. Depress Anxiety 2010; 27:351–364
17.
Roberts RO, Geda YE, Knopman DS, et al: The Mayo Clinic Study of Aging: design and sampling, participation, baseline measures and sample characteristics. Neuroepidemiology 2008; 30:58–69
18.
Morris JC: The Clinical Dementia Rating (CDR): current version and scoring rules. Neurology 1993; 43:2412–2414
19.
Rey A: L’examen clinique en psychologie. Paris, Presses Universitaires de France, 1964
20.
Wechsler D: Wechsler Memory Scale-Revised. New York, Psychological Corporation, 1987
21.
Kaplan E, Goodglass H, Brand S: Boston Naming Test. Philadelphia, Lea & Febiger, 1983
22.
Wechsler D: Wechsler Adult Intelligence Scale-Revised. New York, Psychological Corporation, 1981
23.
Reitan RM: Validity of the Trail Making Test as an indicator of organic brain damage. Percept Mot Skills 1958; 8:271–276
24.
Beck AT, Epstein N, Brown G, et al: An inventory for measuring clinical anxiety: psychometric properties. J Consult Clin Psychol 1988; 56:893–897
25.
Jack CR Jr, Bernstein MA, Borowski BJ, et al: Update on the magnetic resonance imaging core of the Alzheimer’s Disease Neuroimaging Initiative. Alzheimers Dement 2010; 6:212–220
26.
Jack CR Jr, Lowe VJ, Senjem ML, et al: 11C PiB and structural MRI provide complementary information in imaging of Alzheimer’s disease and amnestic mild cognitive impairment. Brain 2008; 131:665–680
27.
Gunter JL, Bernstein MA, Borowski BJ, et al: Measurement of MRI scanner performance with the ADNI phantom. Med Phys 2009; 36:2193–2205
28.
Fischl B, Salat DH, Busa E, et al: Whole brain segmentation: automated labeling of neuroanatomical structures in the human brain. Neuron 2002; 33:341–355
29.
Jack CR Jr, Twomey CK, Zinsmeister AR, et al: Anterior temporal lobes and hippocampal formations: normative volumetric measurements from MR images in young adults. Radiology 1989; 172:549–554
30.
Beck AT, Steer RA, Brown GK: BDI-II, Beck Depression Inventory: Manual. San Antonio, Tex, Psychological Corporation, 1996
31.
Schoevers RA, Beekman AT, Deeg DJ, et al: Comorbidity and risk-patterns of depression, generalised anxiety disorder and mixed anxiety-depression in later life: results from the AMSTEL study. Int J Geriatr Psychiatry 2003; 18:994–1001
32.
Kessler RC, McGonagle KA, Nelson CB, et al: Sex and depression in the National Comorbidity Survey, II: cohort effects. J Affect Disord 1994; 30:15–26
33.
Geda YE, Roberts RO, Knopman DS, et al: Prevalence of neuropsychiatric symptoms in mild cognitive impairment and normal cognitive aging: population-based study. Arch Gen Psychiatry 2008; 65:1193–1198
34.
Kokmen E, Naessens JM, Offord KP: A short test of mental status: description and preliminary results. Mayo Clin Proc 1987; 62:281–288
35.
van Tol MJ, van der Wee NJ, van den Heuvel OA, et al: Regional brain volume in depression and anxiety disorders. Arch Gen Psychiatry 2010; 67:1002–1011
36.
Uchida RR, Del-Ben CM, Busatto GF, et al: Regional gray matter abnormalities in panic disorder: a voxel-based morphometry study. Psychiatry Res 2008; 163:21–29
37.
Asami T, Hayano F, Nakamura M, et al: Anterior cingulate cortex volume reduction in patients with panic disorder. Psychiatry Clin Neurosci 2008; 62:322–330
38.
Yoo HK, Kim MJ, Kim SJ, et al: Putaminal gray matter volume decrease in panic disorder: an optimized voxel-based morphometry study. Eur J Neurosci 2005; 22:2089–2094
39.
Vythilingam M, Anderson ER, Goddard A, et al: Temporal lobe volume in panic disorder: a quantitative magnetic resonance imaging study. Psychiatry Res 2000; 99:75–82
40.
Singer T, Critchley HD, Preuschoff K: A common role of insula in feelings, empathy and uncertainty. Trends Cogn Sci 2009; 13:334–340
41.
Salat DH, Buckner RL, Snyder AZ, et al: Thinning of the cerebral cortex in aging. Cereb Cortex 2004; 14:721–730
42.
Freeman SH, Kandel R, Cruz L, et al: Preservation of neuronal number despite age-related cortical brain atrophy in elderly subjects without Alzheimer disease. J Neuropathol Exp Neurol 2008; 67:1205–1212

Information & Authors

Information

Published In

Go to The Journal of Neuropsychiatry and Clinical Neurosciences
The Journal of Neuropsychiatry and Clinical Neurosciences
Pages: 60 - 66
PubMed: 27578447

History

Received: 30 October 2015
Revision received: 7 April 2016
Revision received: 18 May 2016
Revision received: 20 May 2016
Accepted: 25 May 2016
Published online: 31 August 2016
Published in print: Winter 2017

Keywords

  1. Biological Markers
  2. Neuropsychology

Authors

Affiliations

Anna Pink, M.D.
From the Mayo Clinic Translational Neuroscience and Aging Program, Mayo Clinic, Scottsdale, Ariz. (AP, JK-R, KAS, YEG); the International Clinical Research Center, Brno, Czech Republic (GBS); the Division of Biomedical Statistics and Informatics, Department of Health Sciences Research, Mayo Clinic, Rochester, Minn. (SAP); the Division of Epidemiology, Department of Health Sciences Research, Mayo Clinic, Rochester, Minn. (ROR, MMM, RCP, YEG); the Department of Radiology, Mayo Clinic, Rochester, Minn. (CRJ); the Department of Neurology, Mayo Clinic, Rochester, Minn. (ROR, DSK, RCP); the Department of Psychiatry and Psychology, Mayo Clinic, Scottsdale, Ariz. (YEG); and the Department of Neurology, Mayo Clinic, Scottsdale, Ariz. (YEG).
Scott A. Przybelski, B.S.
From the Mayo Clinic Translational Neuroscience and Aging Program, Mayo Clinic, Scottsdale, Ariz. (AP, JK-R, KAS, YEG); the International Clinical Research Center, Brno, Czech Republic (GBS); the Division of Biomedical Statistics and Informatics, Department of Health Sciences Research, Mayo Clinic, Rochester, Minn. (SAP); the Division of Epidemiology, Department of Health Sciences Research, Mayo Clinic, Rochester, Minn. (ROR, MMM, RCP, YEG); the Department of Radiology, Mayo Clinic, Rochester, Minn. (CRJ); the Department of Neurology, Mayo Clinic, Rochester, Minn. (ROR, DSK, RCP); the Department of Psychiatry and Psychology, Mayo Clinic, Scottsdale, Ariz. (YEG); and the Department of Neurology, Mayo Clinic, Scottsdale, Ariz. (YEG).
Janina Krell-Roesch, Ph.D.
From the Mayo Clinic Translational Neuroscience and Aging Program, Mayo Clinic, Scottsdale, Ariz. (AP, JK-R, KAS, YEG); the International Clinical Research Center, Brno, Czech Republic (GBS); the Division of Biomedical Statistics and Informatics, Department of Health Sciences Research, Mayo Clinic, Rochester, Minn. (SAP); the Division of Epidemiology, Department of Health Sciences Research, Mayo Clinic, Rochester, Minn. (ROR, MMM, RCP, YEG); the Department of Radiology, Mayo Clinic, Rochester, Minn. (CRJ); the Department of Neurology, Mayo Clinic, Rochester, Minn. (ROR, DSK, RCP); the Department of Psychiatry and Psychology, Mayo Clinic, Scottsdale, Ariz. (YEG); and the Department of Neurology, Mayo Clinic, Scottsdale, Ariz. (YEG).
Gorazd B. Stokin, M.D., Ph.D.
From the Mayo Clinic Translational Neuroscience and Aging Program, Mayo Clinic, Scottsdale, Ariz. (AP, JK-R, KAS, YEG); the International Clinical Research Center, Brno, Czech Republic (GBS); the Division of Biomedical Statistics and Informatics, Department of Health Sciences Research, Mayo Clinic, Rochester, Minn. (SAP); the Division of Epidemiology, Department of Health Sciences Research, Mayo Clinic, Rochester, Minn. (ROR, MMM, RCP, YEG); the Department of Radiology, Mayo Clinic, Rochester, Minn. (CRJ); the Department of Neurology, Mayo Clinic, Rochester, Minn. (ROR, DSK, RCP); the Department of Psychiatry and Psychology, Mayo Clinic, Scottsdale, Ariz. (YEG); and the Department of Neurology, Mayo Clinic, Scottsdale, Ariz. (YEG).
Rosebud O. Roberts, M.B. Ch.B., M.S.
From the Mayo Clinic Translational Neuroscience and Aging Program, Mayo Clinic, Scottsdale, Ariz. (AP, JK-R, KAS, YEG); the International Clinical Research Center, Brno, Czech Republic (GBS); the Division of Biomedical Statistics and Informatics, Department of Health Sciences Research, Mayo Clinic, Rochester, Minn. (SAP); the Division of Epidemiology, Department of Health Sciences Research, Mayo Clinic, Rochester, Minn. (ROR, MMM, RCP, YEG); the Department of Radiology, Mayo Clinic, Rochester, Minn. (CRJ); the Department of Neurology, Mayo Clinic, Rochester, Minn. (ROR, DSK, RCP); the Department of Psychiatry and Psychology, Mayo Clinic, Scottsdale, Ariz. (YEG); and the Department of Neurology, Mayo Clinic, Scottsdale, Ariz. (YEG).
Michelle M. Mielke, Ph.D.
From the Mayo Clinic Translational Neuroscience and Aging Program, Mayo Clinic, Scottsdale, Ariz. (AP, JK-R, KAS, YEG); the International Clinical Research Center, Brno, Czech Republic (GBS); the Division of Biomedical Statistics and Informatics, Department of Health Sciences Research, Mayo Clinic, Rochester, Minn. (SAP); the Division of Epidemiology, Department of Health Sciences Research, Mayo Clinic, Rochester, Minn. (ROR, MMM, RCP, YEG); the Department of Radiology, Mayo Clinic, Rochester, Minn. (CRJ); the Department of Neurology, Mayo Clinic, Rochester, Minn. (ROR, DSK, RCP); the Department of Psychiatry and Psychology, Mayo Clinic, Scottsdale, Ariz. (YEG); and the Department of Neurology, Mayo Clinic, Scottsdale, Ariz. (YEG).
Kathleen A. Spangehl, M.A.
From the Mayo Clinic Translational Neuroscience and Aging Program, Mayo Clinic, Scottsdale, Ariz. (AP, JK-R, KAS, YEG); the International Clinical Research Center, Brno, Czech Republic (GBS); the Division of Biomedical Statistics and Informatics, Department of Health Sciences Research, Mayo Clinic, Rochester, Minn. (SAP); the Division of Epidemiology, Department of Health Sciences Research, Mayo Clinic, Rochester, Minn. (ROR, MMM, RCP, YEG); the Department of Radiology, Mayo Clinic, Rochester, Minn. (CRJ); the Department of Neurology, Mayo Clinic, Rochester, Minn. (ROR, DSK, RCP); the Department of Psychiatry and Psychology, Mayo Clinic, Scottsdale, Ariz. (YEG); and the Department of Neurology, Mayo Clinic, Scottsdale, Ariz. (YEG).
David S. Knopman, M.D.
From the Mayo Clinic Translational Neuroscience and Aging Program, Mayo Clinic, Scottsdale, Ariz. (AP, JK-R, KAS, YEG); the International Clinical Research Center, Brno, Czech Republic (GBS); the Division of Biomedical Statistics and Informatics, Department of Health Sciences Research, Mayo Clinic, Rochester, Minn. (SAP); the Division of Epidemiology, Department of Health Sciences Research, Mayo Clinic, Rochester, Minn. (ROR, MMM, RCP, YEG); the Department of Radiology, Mayo Clinic, Rochester, Minn. (CRJ); the Department of Neurology, Mayo Clinic, Rochester, Minn. (ROR, DSK, RCP); the Department of Psychiatry and Psychology, Mayo Clinic, Scottsdale, Ariz. (YEG); and the Department of Neurology, Mayo Clinic, Scottsdale, Ariz. (YEG).
Clifford R. Jack, Jr., M.D.
From the Mayo Clinic Translational Neuroscience and Aging Program, Mayo Clinic, Scottsdale, Ariz. (AP, JK-R, KAS, YEG); the International Clinical Research Center, Brno, Czech Republic (GBS); the Division of Biomedical Statistics and Informatics, Department of Health Sciences Research, Mayo Clinic, Rochester, Minn. (SAP); the Division of Epidemiology, Department of Health Sciences Research, Mayo Clinic, Rochester, Minn. (ROR, MMM, RCP, YEG); the Department of Radiology, Mayo Clinic, Rochester, Minn. (CRJ); the Department of Neurology, Mayo Clinic, Rochester, Minn. (ROR, DSK, RCP); the Department of Psychiatry and Psychology, Mayo Clinic, Scottsdale, Ariz. (YEG); and the Department of Neurology, Mayo Clinic, Scottsdale, Ariz. (YEG).
Ronald C. Petersen, M.D., Ph.D.
From the Mayo Clinic Translational Neuroscience and Aging Program, Mayo Clinic, Scottsdale, Ariz. (AP, JK-R, KAS, YEG); the International Clinical Research Center, Brno, Czech Republic (GBS); the Division of Biomedical Statistics and Informatics, Department of Health Sciences Research, Mayo Clinic, Rochester, Minn. (SAP); the Division of Epidemiology, Department of Health Sciences Research, Mayo Clinic, Rochester, Minn. (ROR, MMM, RCP, YEG); the Department of Radiology, Mayo Clinic, Rochester, Minn. (CRJ); the Department of Neurology, Mayo Clinic, Rochester, Minn. (ROR, DSK, RCP); the Department of Psychiatry and Psychology, Mayo Clinic, Scottsdale, Ariz. (YEG); and the Department of Neurology, Mayo Clinic, Scottsdale, Ariz. (YEG).
Yonas E. Geda, M.D., M.Sc.
From the Mayo Clinic Translational Neuroscience and Aging Program, Mayo Clinic, Scottsdale, Ariz. (AP, JK-R, KAS, YEG); the International Clinical Research Center, Brno, Czech Republic (GBS); the Division of Biomedical Statistics and Informatics, Department of Health Sciences Research, Mayo Clinic, Rochester, Minn. (SAP); the Division of Epidemiology, Department of Health Sciences Research, Mayo Clinic, Rochester, Minn. (ROR, MMM, RCP, YEG); the Department of Radiology, Mayo Clinic, Rochester, Minn. (CRJ); the Department of Neurology, Mayo Clinic, Rochester, Minn. (ROR, DSK, RCP); the Department of Psychiatry and Psychology, Mayo Clinic, Scottsdale, Ariz. (YEG); and the Department of Neurology, Mayo Clinic, Scottsdale, Ariz. (YEG).

Notes

Send correspondence to Dr. Geda; e-mail: [email protected]

Funding Information

Robert H. and Clarice Smith and Abigail Van Buren Alzheimer's Disease Research Program:
European Regional Development Fund: FNUSA-ICRC: CZ.1.05/1.1.00/02.0123
Robert Wood Johnson Foundation Center for Health Policy10.13039/100006381:
National Institute of Mental Health10.13039/100000025: K01 MH068351
National Institute on Aging10.13039/100000049: K01 AG028573, U01 AG006786

Metrics & Citations

Metrics

Citations

Export Citations

If you have the appropriate software installed, you can download article citation data to the citation manager of your choice. Simply select your manager software from the list below and click Download.

For more information or tips please see 'Downloading to a citation manager' in the Help menu.

Format
Citation style
Style
Copy to clipboard

There are no citations for this item

View Options

View options

PDF/ePub

View PDF/ePub

Get Access

Login options

Already a subscriber? Access your subscription through your login credentials or your institution for full access to this article.

Personal login Institutional Login Open Athens login
Purchase Options

Purchase this article to access the full text.

PPV Articles - Journal of Neuropsychiatry and Clinical Neurosciences

PPV Articles - Journal of Neuropsychiatry and Clinical Neurosciences

Not a subscriber?

Subscribe Now / Learn More

PsychiatryOnline subscription options offer access to the DSM-5-TR® library, books, journals, CME, and patient resources. This all-in-one virtual library provides psychiatrists and mental health professionals with key resources for diagnosis, treatment, research, and professional development.

Need more help? PsychiatryOnline Customer Service may be reached by emailing [email protected] or by calling 800-368-5777 (in the U.S.) or 703-907-7322 (outside the U.S.).

Media

Figures

Other

Tables

Share

Share

Share article link

Share