Full access
Regular Articles
Published Online: 19 March 2019

An Investigation Into Response Inhibition in Distinct Clinical Groups Within Obsessive-Compulsive Disorder

Publication: The Journal of Neuropsychiatry and Clinical Neurosciences

Abstract

Objective:

Response inhibition has been frequently studied in obsessive-compulsive disorder (OCD) with mixed results. The inconsistent findings may stem in part from failure to consider the heterogeneity of the disorder.

Methods:

The authors examined behavioral and event-related potential (ERP) components (N2 and P3) during a simple response inhibition go/nogo task in a sample of patients with OCD (N=48) and control subjects (N=53). Comparisons in behavioral and electrophysiological measures were made between groups (OCD compared with control) and within the OCD group in terms of symptom clusters (symmetry, forbidden thoughts, and cleaning) and comorbidity status (OCD only and OCD with depression).

Results:

In the OCD group, the N2 component appeared more frontally localized compared with the control group. Participants with OCD demonstrated longer N2 latency and a larger difference in N2 between the nogo and go conditions, suggesting slower but greater conflict monitoring. P3 had a larger amplitude in the OCD group compared with the control group, indicative of greater response inhibition, but was also reduced in the nogo compared with go condition, suggesting suppressed response inhibition. No significant differences were found between symptom clusters, but patients with OCD only made more omission errors compared with patients with OCD and comorbid depression. The latter cohort also had faster P3 latencies, which, combined with the behavioral data, indicates slightly improved response inhibition when comorbid depression is found.

Conclusions:

On the basis of these results, it would seem unlikely that symptom clusters have contributed to previous inconsistencies in the literature. Comorbid depression, which may have affected previous results, should be considered in future research.
Obsessive-compulsive disorder (OCD), characterized by recurrent obsessions and compulsions, affects 1%−3% of the general population (13). Although classified as a single condition, individuals with OCD have varied experiences (4). One way to characterize OCD in an individual is to use the Yale-Brown Obsessive Compulsive Scale (Y-BOCS), which is considered the gold standard tool for assessing severity and symptom diversity in OCD (5, 6). Several studies have used the Y-BOCS to identify symptom clusters, including a large meta-analysis examining factor analytic studies that found that four factors explain 79% of the variance in OCD symptoms: symmetry, forbidden thoughts, cleaning, and hoarding (79). These four clusters appear stable across the lifespan and robust to differences in factor analytic techniques of individual meta-analyses. The same four clusters have been confirmed in other studies (10, 11); however, under DSM-5, hoarding became a separate classification, leaving three symptom clusters within OCD (12). As well as symptom heterogeneity, which may be identified with the Y-BOCS, individuals with OCD often have psychiatric comorbidities, most notably depression (13). Critically, symptom cluster and comorbidity are known to affect treatment responsiveness; therefore, it is beneficial to better understand this heterogeneity (8, 1416). Despite the importance of these factors, research has typically not accounted for the heterogeneity of OCD symptoms and comorbidities within study designs, which may have contributed to mixed findings in some areas (17). One such area of research is response inhibition.
Several studies have identified differences in performance on response inhibition tasks in OCD when compared with healthy control participants using go/nogo tasks (18, 19), but findings are inconsistent. Behavioral measures show both faster reaction times (20) and slower reaction times in OCD (21). There are also reports of altered error rates (22), although others find no differences in any measure (2329) in OCD. Of these studies, only one (26) noted the symptom cluster and did not consider this as a variable in the analysis. In the majority of the studies, those with comorbidities including depression were excluded (2024, 28, 29); where comorbid depression was recorded (2527), it was not differentiated in the analysis. The failure of these studies to take into account two important sources of heterogeneity in OCD may have in part contributed to the inconsistent findings.
Neurophysiological data from go/nogo tasks focus on the event-related potentials (ERPs) N200 (negative deflection at frontal and central sites at 200–300 ms) and P300 (positive deflection at frontal and central sites at 300–600 ms) (30), often considered collectively as the N2-P3 complex (31). These N2 and P3 components are associated with the early and late phases of response inhibition, respectively, and would normally be increased in inhibition conditions (30). Analysis of the N2-P3 complex in OCD has shown inconsistent results; N2 has been reported to be both increased (22, 32, 33) and decreased (26, 27, 34) in OCD, and P3 has also been reported as both increasing and decreasing in different studies of OCD (32, 33, 35, 36) or not changing at all. As with the behavioral data, only one study noted symptom clusters but did not analyze according to it (26). The majority also excluded those with comorbid depression (22, 32, 33, 35, 36); the remaining three studies included those with depression but did not account for this in their analysis (26, 27, 34). This again demonstrates that key sources of heterogeneity have been neglected in previous studies.
Although inconsistent results may be attributed to differences in the exact task and medication status, for example, we propose that failure to consider the heterogeneity of the disorder, specifically in terms of symptom clusters and comorbid depression, may also have contributed to the mixed findings. The aim of this study was to assess response inhibition using the go/nogo task, which has previously found inconsistent results, in a manner that allows consideration of symptom cluster and comorbid depression in addition to considering the disorder as a whole to allow comparison with previous studies. Because of the inconsistencies reported in previous work and the fact that no studies to date have been conducted using the symptom clusters as defined by Bloch et al. (9) and DSM-5 (12), we have employed two-tailed hypotheses. Specifically, we hypothesized that there would be significant differences in response inhibition between control subjects and participants with OCD only and between OCD participants from different symptom clusters and comorbidity status.

Methods

Participants

Ethical approval was obtained from the institutional ethics committee, and the study was conducted in accordance the Declaration of Helsinki. All participants provided written consent to participate.
Participants (OCD group, N=48; control group, N=53) aged 18–60 years were recruited through local advertising. All participants had completed secondary education and reported no history of brain injury or neurological disorder. Control participants were included only if they could confirm no current or previous psychiatric disorders. Additionally, 10 randomly selected control participants completed the Y-BOCS to confirm subclinical scores on the Y-BOCS as indicated in the standard Y-BOCS illness classification (i.e., less than 7 out of 40) (37), as expected for a healthy population. OCD participants were included only if they had an existing diagnosis of OCD that was validated using the Y-BOCS during participant screening, resulting in a score within the clinical range (i.e., more than 7 out of a possible 40). The average total Y-BOCS score, a marker of illness severity, for all OCD participants was 20.88 (SD=1.78), which is classed as moderate OCD. In all cases Y-BOCS assessment was carried out by a researcher qualified and deemed competent in administering psychological assessment. A current diagnosis of comorbid major depressive disorder was reported in 58% of those with OCD participating in the study. Participants experiencing other comorbid conditions were excluded from the study. Control and OCD groups were matched for gender, age, years of education, and handedness (Table 1).
TABLE 1. Summary of participant characteristics matched between patients with obsessive-compulsive disorder (OCD) and control subjectsa
CharacteristicOCD group (48)Control group (N=53)Test statistic
 N%N%χ2dfp
Sex    0.1410.711
 Male1837.51834.0   
 Female3062.53566.0   
Handedness    0.2720.873
 Right2654.22954.7   
 Left1735.42037.7   
 Ambidextrous510.447.5   
 MeanSDMeanSDtdfp
Age (years)36.111.440.311.61.89990.062
Education (years)14.82.615.62.71.45990.150
a
Matching was confirmed with independent sample t tests or chi-square test. All continuous variables are presented as means.

Characteristics of the OCD Sample

As indicated above, all participants with OCD completed the Y-BOCS to confirm diagnosis at the time of testing. The total Y-BOCS score also provided a measure of illness severity. Each OCD participant was allocated to one of the three clusters based on their responses to the Y-BOCS Symptom Checklist, which contains over 50 commonly reported obsessions and compulsions across several categories, allowing participants to self-identify their most prominent symptoms. The clusters were matched for gender, age, years of education, handedness, age of onset, illness duration, illness severity, medication, and use of cognitive-behavioral therapy (CBT; Table 2). There were no differences between the OCD-only and OCD with comorbid depression groups in terms of gender, age, years of education, handedness, age of onset, illness duration, illness severity, medication, and use of CBT (Table 3).
TABLE 2. Summary of participant characteristics matched between distinct obsessive-compulsive disorder (OCD) symptom clustersa
VariableSymmetry (N=7)Forbidden thoughts (N=25)Cleaning (N=16)Test statistic
 N%N%N%χ2dfp
Sex      0.9620.620
 Male228.61144.0531.3   
 Female571.41456.01168.8   
Handedness      5.8140.214
 Right457.11456.0850.0   
 Left342.91040.0425.0   
 Ambidextrous00.014.0425.0   
Medication      8.8540.065
 None228.61248.0425.0   
 Antidepressant228.61144.01062.5   
 Other342.928.016.25   
CBT      2.6420.267
 No457.11872.01487.5   
 Yes342.9728.0212.5   
OCD      0.7920.673
 OCD only342.9936.0850.0   
 OCD comorbid with depression457.11664.0850.0   
 MeanSDMeanSDMeanSDtdfp
Age (years)37.69.434.111.238.412.50.7720.471
Education (years)13.93.815.32.215.52.51.0020.376
Age at onset (years)32.33.626.11.9125.78.21.4820.239
Illness duration (months)63.065.696.7103.5153.1133.42.0320.144
Illness severity26.45.123.25.426.15.61.8920.163
a
Matching was confirmed with one-way analysis of variance or chi-square test. All continuous variables are presented as means.
TABLE 3. Summary of participant characteristics matched between those with obsessive-compulsive disorder (OCD) only and those with OCD and depression
CharacteristicOCD only (N=20)OCD plus depression (N=28)Test statistic
 N%N%χ2dfp
Sex    1.0410.306
 Male1050.0828.6   
 Female1050.02071.4   
Handedness    3.3420.189
 Right840.01864.3   
 Left1050.0725.0   
 Ambidextrous210.0310.7   
Medication    3.4220.181
 None1050.0828.6   
 Antidepressant840.01553.6   
 Other15.0517.9   
CBT    0.4610.499
 No1680.02071.4   
 Yes420.0828.6   
 MeanSDMeanSDtdfp
Age (years)34.011.837.511.00.14460.886
Education (years)14.83.114.92.21.00460.376
Age at onset (years)26.01.927.59.90.54460.592
Illness duration (months)96.7115.4120.5112.20.72460.478
Illness severity24.35.724.95.50.34460.736

Behavioral Paradigm

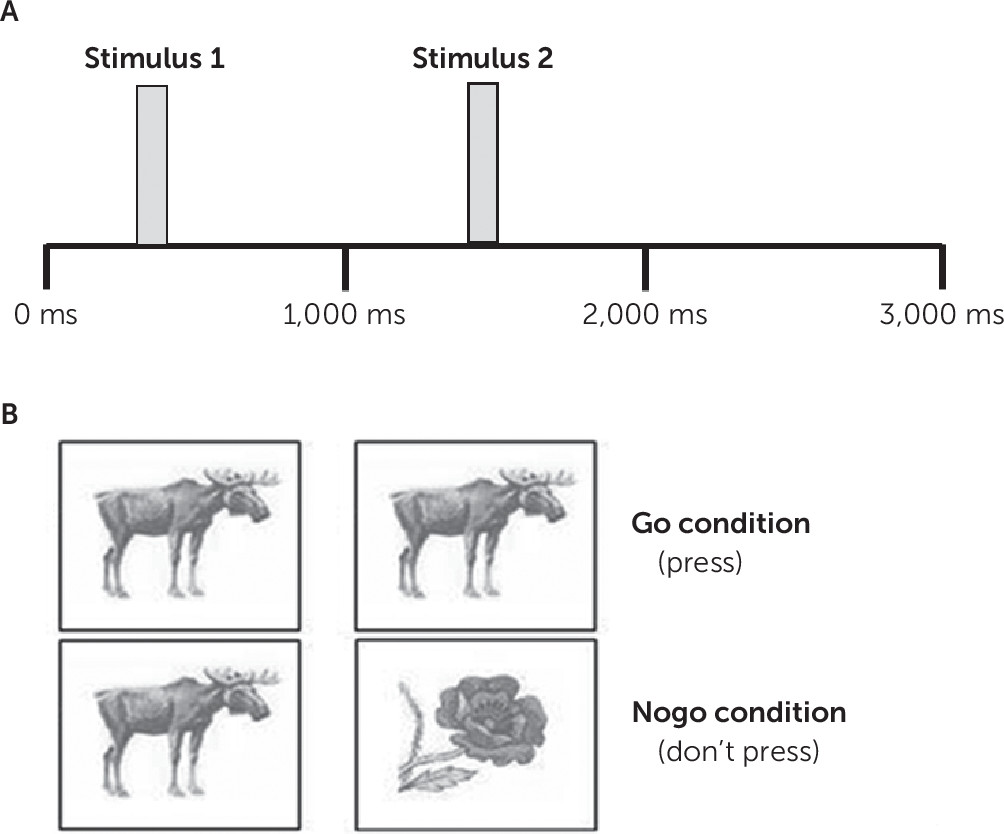
Participants completed the commonly used visual continuous performance task (WinEEG, Mitsar Medical, Petersburg, Russia) with go and nogo conditions. We used a go/nogo measure of response inhibition because this is an area where inconsistencies have previously been found (as discussed above), and the task is also very simple for participants. During each trial two stimuli were presented in stimulus pairs, as is standard practice for this task. Using this paired approach allows some separation of two operations in time: preparation to receive a stimulus and preparation to make a movement (38). It is hypothesized that the ERP in response to the first stimulus in a pair represents sensory disengagement, whereas the ERP in response to the second stimulus, which determines whether the trial is a go or nogo trial, represents motor suppression (i.e., a component of response inhibition). At the start of each trial a black fixation cross appeared at the center of the screen. After 300 ms, the first stimulus was presented for a period of 100 ms. This stimulus then disappeared and was replaced by the fixation cross for a further 1,000 ms before the second stimulus appeared for a period of 100 ms. A 1,500-ms response period followed. Stimulus timing and images for the two conditions are shown in Figure 1. The different stimuli were matched for size, luminance, and color. For the go condition participants were instructed to press the left mouse button as fast as possible when the second stimulus was an animal; for the nogo condition, participants instructed to suppress their response and not click the mouse button when the second stimulus was a plant. Trials were presented in a pseudorandomized manner to ensure that 100 trials of each condition were presented. Three behavioral measurements were made: reaction time for correct responses, the number of omission errors (not pressing in a go trial), and the number of commission errors (pressing in nogo trial). Before the experiment participants had the opportunity to practice the task.
FIGURE 1. Timescale of the stimulus presentation of the Visual Continuous Performance Taska
a Panel A shows stimulus timing. Panel B shows the stimuli presented for each of the key conditions.

EEG Recording

EEG was continuously recorded using the WinEEG (version 2.93.59) Mitsar 21 channel EEG system with 19 pure tin scalp electrodes on a preformed electrode cap (Electro-Cap International, Eaton, Ohio) positioned according to the international 10–20 system (39). The reference electrodes (A1, A2) were positioned on each earlobe. A ground electrode was placed on the midline 3 cm anterior to Fz (frontal midline electrode). Impedance levels were kept under 5 kΩ. EEG was digitally recorded on a common average montage (40). Band pass Butterworth filters were set at low pass filter 0.53 Hz, high pass filter 50 Hz, and a notch filter 45–55 Hz. The data input signals were digitized at a sampling rate of 250 Hz. Independent component analysis was used to identify and remove components representing horizontal and vertical eye movements. Periods involving pulse-like voltages exceeding 75μV or slow frequencies between 0 and 1 Hz exceeding 75μV were discarded by automated rejection. Electromyography was manually removed. Raw EEG data were baseline corrected using a prestimulus period of 300 ms and quantified by peak amplitude and peak latency of the N2 and P3.

Data Analysis

All data analysis was conducted in SPSS and used parametric testing after first confirming the data were suitable using the Kolmogorov-Smirnov test and measures of skewness and kurtosis. For analyses of variance (ANOVAs) in which the sphericity assumption was violated, data are reported for the Greenhouse-Geiser correction (41).

Hypothesis 1 (control group compared with OCD group).

For the behavioral data, reaction time and commission and omission errors were compared using an independent sample t test. For ERP data, N2 and P3 were maximal at frontal central electrodes, in line with previous studies (30, 31); therefore, data from Fz, Cz, and Pz only were selected for the analysis. For both components, peak amplitude and peak latency were analyzed. In addition, the amplitude of a difference wave was calculated by subtracting the go response from the nogo response to give an N2d (difference) and a P3d (difference). It is suggested that N2d represents conflict monitoring, whereas P3d represents response inhibition (30). Analysis of N2 and P3 amplitude was conducted using a mixed ANOVA with group (control and OCD) as the between-measures factor and condition (go, nogo) and site (Fz, Cz, Pz) as within-measures factors. P3 latency was also analyzed using this method. However, N2 latency was analyzed using only group and condition because the amplitude analysis revealed that N2 was only present in both groups at Fz, meaning site was not relevant. N2d was analyzed using an independent sample t test for this same reason, whereas P3d was analyzed using a mixed ANOVA with group as the between-measures factor and site as the within-measures factor.

Hypothesis 2 (within OCD).

Rather than conduct one large analysis that included both comorbidity status and symptom cluster, we opted to analyze the two separately due to the small samples that would have arisen if they were combined (e.g., comorbid depression and symmetry cluster N=3). To investigate the effect of cluster on response inhibition, the behavioral data were compared using one-way ANOVA. For ERP responses P3 amplitude and latency were analyzed with a mixed ANOVA with cluster as the between-measures factor and condition and site as within-measures factors. For N2 amplitude and latency, which is only found at Fz in participants with OCD, a mixed ANOVA with cluster as the between-measures factor and condition only as a within-measure factor was used. P3d was analyzed using a mixed ANOVA with cluster as the between-measures factor and site as the within-measures factor, whereas N2d was compared using one-way ANOVA. Comorbidity analysis was conducted in the same way, but cluster was replaced with comorbidity as the between-measures factor for all ANOVAs and one-way ANOVAs were replaced with independent sample t tests.

Results

ERP But Not Behavioral Measures Differentiate Between Patients With OCD and Control Subjects

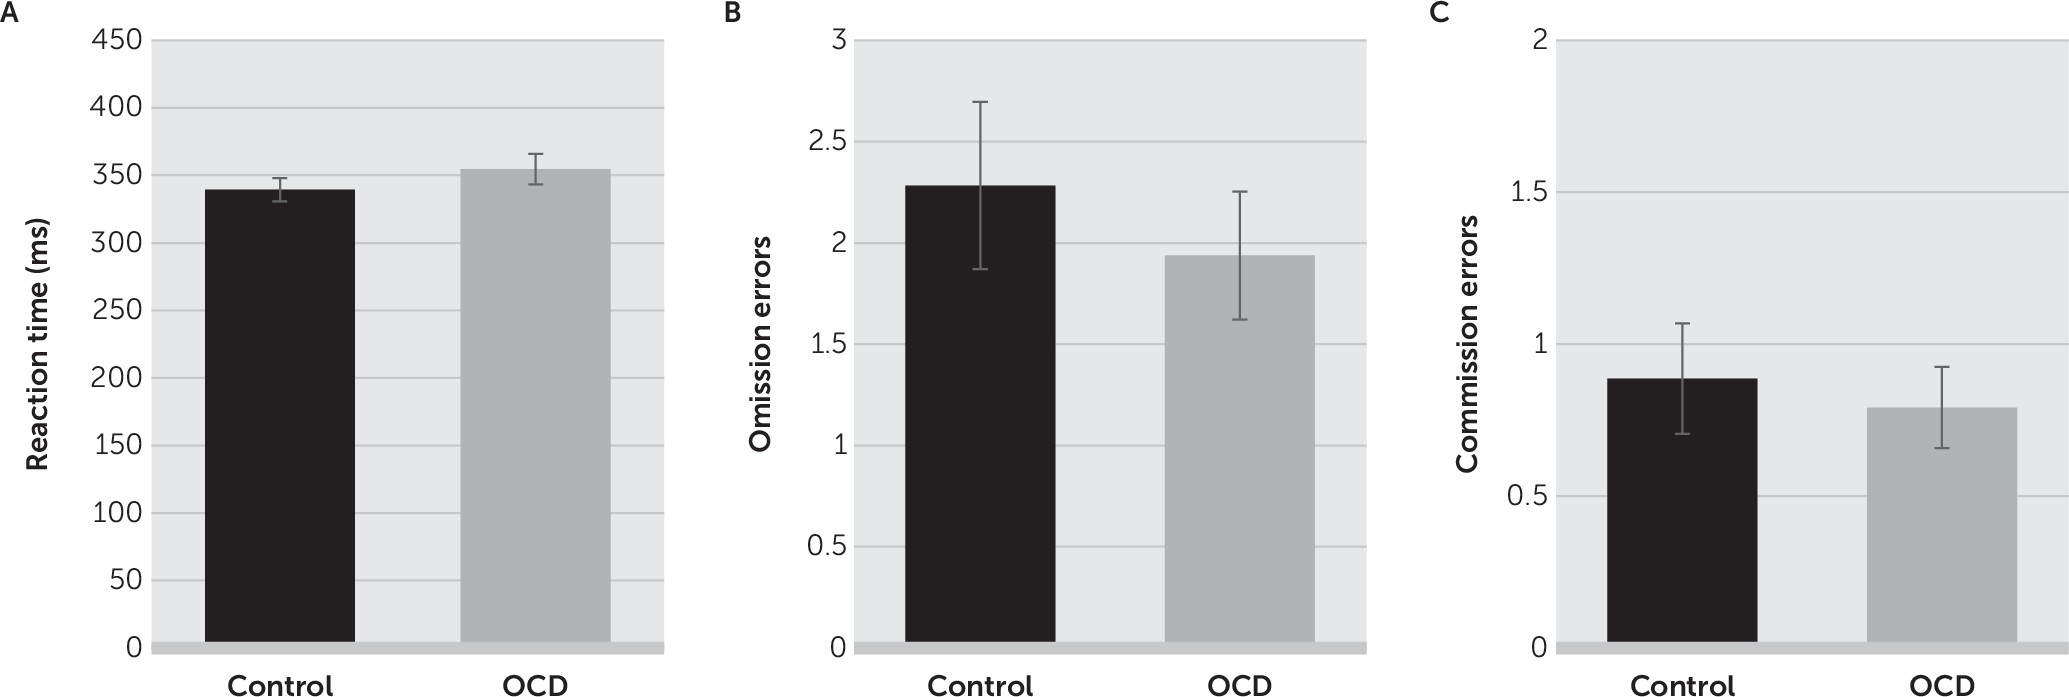
There was no significant difference in the mean reaction time for correct responses between the control group (mean, 339.5 ms [SD=63.0]) and the OCD group (mean, 354.6 ms [SD=78.4]; t=1.069, df=99, p=0.288; Figure 2A). There were also no differences in the number of omission errors (control group: mean, 2.3 [SD=3.0]; OCD group: mean, 1.9 [SD=2.2]; t=0.655, df=99, p=0.514; Figure 2B) or commission errors (control group: mean, 0.9 [SD=0.0]; OCD group: mean, 0.8 [SD=0.2]; t=0.415, df=99, p=0.679; Figure 2C) between the two groups.
FIGURE 2. Reaction times for correct responses between the control and obsessive-compulsive disorder (OCD) groupsa
a There were no differences in reaction times for correct responses (panel A), omission errors (panel B), or commission errors (panel C) between the two study groups. Data are shown as means and standard error of the mean due to low error number.
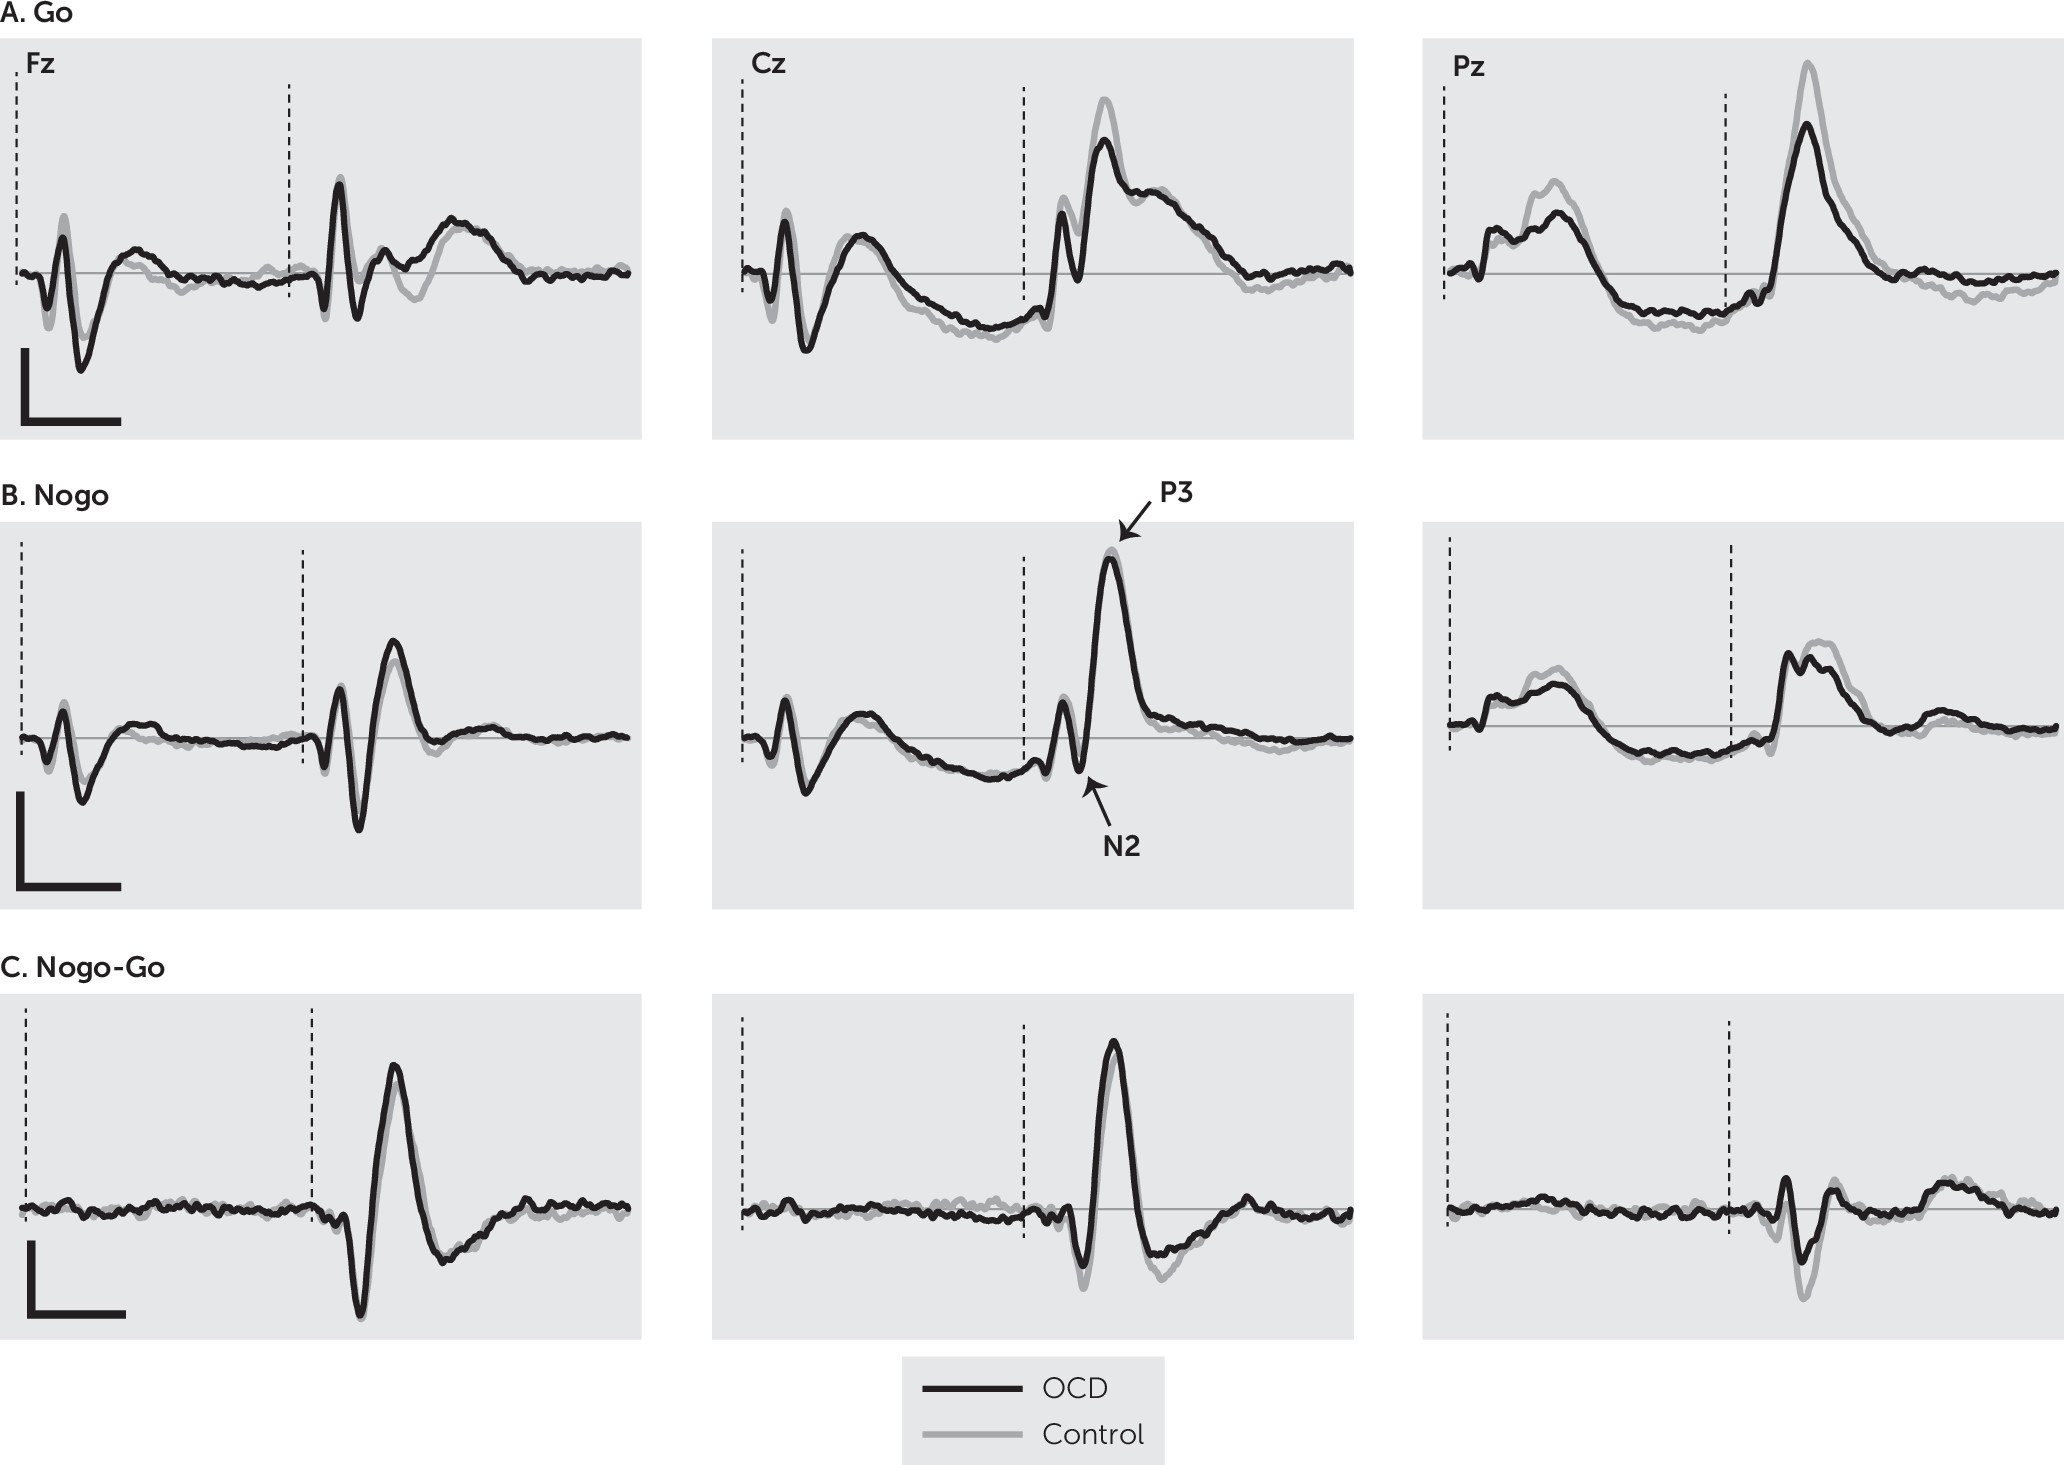
Grand averages of the ERP responses of the OCD and control groups are shown in Figure 3. Analysis of N2 amplitude revealed a significant main effect of group (F=5.64, df=1, 99, p=0.019), with the control group having a larger overall N2 component when all sites were considered. There was also a significant main effect of condition (F=80.12, df=1, 99, p<0.001), with the nogo condition eliciting a greater N2 response. Finally, there was a significant main effect of site (F=134.91, df=2, 198, p<0.001); pairwise comparisons showed all sites differed significantly from each other (p<0.001; Fz >Cz >Pz). There was no negative response at Pz, indicating N2 was not found at this location when both groups were considered together. There was a significant site-by-group interaction (F=13.22, df=2, 198, p<0.001), with interaction contrasts revealing that N2 was no different between the two groups at Fz, both groups lacked a response at Pz, and the Cz response was significantly different due to no appreciable negative response being present in the OCD group. There was no significant group-by-condition interaction (F=0.13, df=1, 99, p=0.910). There was a significant site-by-condition interaction (F=26.62, df=2, 198, p<0.001) driven by the difference in go and nogo and the fact that N2 was not present at all sites. There was a significant group-by-site-by-condition interaction (F=21.88, df=2, 198, p<0.001). Examination of the contrasts revealed that this interaction arises because of the more localized N2 in OCD participants and the fact that N2 is greater at the frontal location in the nogo condition in comparison to the go condition.
FIGURE 3. Normalized grand averages among patients with obsessive-compulsive disorder (OCD) and control subjects during go and nogo conditions and the nogo-go difference waveformsa
a The dotted lines indicate stimulus onset. The vertical scale bar is 4µV, and the horizontal scale bar is 400 ms.
N2 latency analysis focused on Fz because this was the only location in which it was present for both groups. It revealed a significant main effect of group (F=6.81, df=1, 99, p=0.01), with the OCD group having a significantly larger latency (i.e., a slower response). There was also a significant main effect for condition (F=10.79, df=1, 99, p=0.001), with larger latencies (i.e., slower responses) in the go condition. There was no significant interaction (F=1.06, df=1, 99, p=0.306). Finally, N2d analysis revealed that the OCD group had a larger difference between the two conditions than the control group (t=2.37, df=99, p=0.020).
Analysis of P3 amplitude found a significant main effect of group (F=8.43, df=1, 99, p=0.005), with the OCD group having a larger P3 amplitude. There was also a significant main effect of condition (F=113.42, df=1, 99, p<0.001), with the nogo condition eliciting a greater amplitude. Finally, there was a significant main effect of site (F=164.29, df=, 2, 198, p<0.001), with pairwise comparisons showing all sites differed significantly from each other (p<0.001; Cz >Pz >Fz). There was a significant site-by-group interaction (F=12.56, df=2, 198, p<0.001). To break this down, interaction contrasts were performed comparing P3 amplitude across the electrode sites. They revealed that controls had a larger P3 at Fz, whereas those with OCD had higher P3 amplitudes at Cz and Pz. There was also a site-by-condition interaction (F=149.16, df=2, 98, p<0.001). This was driven by the fact that in the go condition the responses at Cz and Pz were comparable and larger than at Fz, whereas in the nogo condition, responses were greatest at Cz and comparable and lower at Fz and Pz. Finally, there was a significant group-by-condition interaction (F=5.99, df=1, 99, p=0.016). Again, examination of the data and interaction contrasts revealed that this interaction was due to a greater P3 amplitude difference between the OCD and controls in the go condition compared with the nogo condition (p=0.016). There was no significant group-by-site-by-condition interaction (F=0.45, df=2, 198, p=0.64).
P3 latency analysis showed no significant main effect of group (F=0.00, df=1, 99, p=0.996), but there was a main effect of condition (F=7.57, df=1, 99, p=0.007), with larger P3 latencies (i.e., slower responses) in the go condition. There was also a main effect of site (F=78.39, df=1.54, 151.92, p<0.001). Contrasts revealed that the P3 response was slowest at Fz (p<0.001) and fastest at Pz (p<0.001). There was no significant group-by-site interaction (F=1.25, df=1.54, 151.92, p=0.283) or group-by-condition interaction (F=2.28, df=1, 99, p=0.135). However, there was a significant site-by-condition interaction (F=3.23, df=2, 198, p=0.042), with latencies in the go condition varying more with site than in the nogo condition. There was a significant group-by-site-by-condition interaction (F=3.23, df=1.76, 173.89, p=0.048). Examination of the interaction contrasts revealed that the difference in P3 latency between the go and nogo conditions across the OCD and control group differed between Fz and Pz (p=0.025) and Cz and Pz (p=0.041). P3d amplitude analysis revealed a significant main effect of group (F=5.99, df=1, 99, p=0.016), with larger responses in the control group. In addition, there was a main effect of site (F=159.38, df=2, 198, p<0.001), with pairwise comparisons showing significant differences between all electrode sites (p<0.001; Cz>Fz>Pz), indicating the greatest inhibition effect at central locations. There was no significant interaction (F=0.45, df=2, 198, p=0.640).

Differences Between Different Symptom Clusters

There was no significant difference in the mean reaction time for correct responses between three different clusters (symmetry: mean, 348.3 ms [SD=104.4]; forbidden thoughts: mean, 354.4 ms [SD=70.9]; cleaning: mean, 362.3 ms [SD=82.2]; F=0.536, df=3, 53, p=0.660). There were also no differences in terms of the number of omission errors (symmetry: mean, 2.6 [SD=2.7]; forbidden thoughts: mean, 2.0 [SD=2.4]; cleaning: mean, 1.6 [SD=1.7]; F=0.507, df=3, 53, p=0.679) or commission errors (symmetry: mean, 1.0 [SD=1.0]; forbidden thoughts: mean, 0.5 [SD=0.8]; cleaning: mean, 1.1 [SD=1.0]; F=1.650, df=3, 53, p=0.189).
For N2 amplitude and latency, there was no significant main effect of cluster (amplitude: F=0.023, df=2, 44, p=0.977; latency: F=0.898, df=2, 44, p=0.415). There was also no main effect of condition on latency (F=0.092, df=1, 44, p=0.763). However, mirroring the whole cohort analysis, there was a main effect of condition on amplitude (F=10.241, df=1, 44, p=0.003), with a greater response in the nogo condition. There were no significant condition-by-cluster interactions (amplitude F=1.78, df=2, 44, p=0.180; latency F=0.31, df=2, 44, p=0.733). There was no significant difference between the clusters for N2d amplitude (F=0.884, df=2, 44, p=0.420).
For P3 there was no significant main effect of cluster (amplitude: F=0.23, df=2, 44, p=0.799; latency: F=0.27, df=2, 44, p=0.767), condition (amplitude: F=0.04, df=1, 44, p=0.849; latency: F=0.13, df=1, 44, p=0.725), or site (amplitude: F=8.60, df=1, 44, p=0.427; latency: F=3.42, df=1.35, 59.18, p=0.057). There were also no significant interactions (amplitude: condition-by-cluster: F=0.31, df=2, 44, p=0.736; condition-by-site: F=0.19, df=2, 88, p=0.826; site-by-cluster: F=0.47, df=4, 88, p=0.760; condition-by-site-by-cluster: F=1.27, df=4, 88, p=0.287; latency condition-by-cluster: F=0.54, df=2, 44, p=0.586; condition-by-site: F=0.94, df=1.52, 66.77, p=0.374; site-by-cluster: F=1.27, df=4, 88, p=0.287; condition-by-site-by-cluster: F=0.75, df=3.04, 66.77, p=0.526). P3d showed no significant main effects (cluster: F=0.309, df=2, 44, p=0.736; site: F=0.192, df=2, 88, p=0.826) or interaction (cluster-by-site: F=0.97, df=4, 90, p=0.429).

Selected Effects of Comorbid Depression on Behavioral and ERP Responses

The average reaction time for correct responses on the go trials did not differ between those with (mean, 334.9 ms [SD=66.8]) and without comorbid depression (mean, 368.6 [SD=84.1]; t=1.491, df=46, p=0.143). There were also no differences in terms of the number of commission errors made (OCD group: mean, 1.1 [SD=2.6]; OCD with comorbid depression group: mean, 0.6 [SD=1.7]; t=1.622, df=46, p=0.101). However, there was a significant difference for omission errors (t=2.426, df=99, p=0.019), with those with OCD (mean, 2.8[SD=0.2]) making more omission errors that those with OCD and comorbid depression (mean, 1.3 [SD=0.3]).
For N2 amplitude and latency, there was no significant main effect of comorbidity (amplitude: F=2.70, df=1, 46, p=0.107; latency: F=0.061, df=1, 46, p=0.806). However, as with the other comparisons, there was a main effect of condition on amplitude (F=85.98, df=1, 46, p<0.001), with bigger N2 responses during the nogo condition. Again, mirroring the main OCD analysis compared with the control analysis, there was also a significant main effect of condition on latency (F=9.46, df=1, 46, p=0.004), with slower responses during the go conditions. There were no significant condition-by-comorbidity interactions (amplitude F=0.26, df=1, 46, p=0.613; latency F=1.78, df=1, 46, p=0.188). For N2d there was no significant difference for amplitude (F=2.19, df=1, 46, p=0.145) between those with and without comorbid depression.
For P3 amplitude there was no significant main effect of comorbidity (F=0.34, df=1, 46, p=0.562). As with the main comparison between those with and without OCD, there was a significant main effect of condition (F=29.48, df=1, 46, p<0.001), with bigger P3 responses during the nogo condition. There was a significant main effect of site (F=76.65, df=2, 92, p<0.001), with pairwise comparisons revealing that all sites differed significantly from each other (p<0.001; Cz>Pz>Fz) in the same way as the main group comparison. There was also a significant condition-by-site interaction (F=64.51, df=2, 92, p<0.001) following the same pattern as the main group analysis. There were no other significant interactions for P3 amplitude (condition-by-comorbidity: F=2.72, df=1, 46, p=0.106; site-by-comorbidity: F=0.28, df=2, 92, p=0.757; site-by-condition-by-comorbidity: F=1.25, df=2, 92, p=0291).
For P3 latency there was a significant main effect of comorbidity (F=6.02, df=1, 46, p=0.018), with those with comorbid depression demonstrating faster P3 responses. There was also a main effect of site (F=34.50, df=2, 92, p<0.001); pairwise comparisons revealed significant differences between Fz and Cz (p<0.001) and Fz and Pz (p<0.001), with the fastest P3 response at Pz and the slowest at Fz as found for the main analysis. There was no significant main effect of condition (F=1.95, df=1, 46, p=0.169), but there was a significant site-by-condition interaction (F=18.20, df=2, 92, p<0.001) in line with the results from hypothesis 1. There was a significant condition-by-comorbidity interaction (F=8.80, df=1, 46, p=0.005); during the go condition the OCD-only group had a slower P3 latency compared with the OCD with comorbid depression. However, during the nogo condition the groups demonstrated similar latencies for P3. There was no site-by-comorbidity interaction (F=1.88, df=2, 92, p=0.158). Finally, there was also a significant three-way interaction of condition-by-site-by-comorbidity (F=5.25, df=2, 92, p=0.007). Contrasts revealed that the group differences across the go and nogo differed across the Fz compared with Pz (p=0.004) and Cz compared with Pz (p=0.004).
For amplitude of P3d there was no significant main effect of comorbidity (F=2.72, df=1, 46, p=0.106), but there was a main effect of site (F=64.52, df=2, 92, p<0.001), where contrasts revealed that the inhibition effect of P3d was significantly different between all electrode sites (p<0.001; Cz > Fz >Pz). There was no significant site-by-comorbidity interaction (F=1.25, df=2, 92, p=0.291).

Discussion

The aim of this study was to investigate response inhibition in OCD using behavioral and ERP measures by examining distinct symptom clusters and the presence of comorbid depression. We set out to test three specific hypotheses: that there will be significant differences in response inhibition between control and OCD participants and OCD participants with different symptom clusters and comorbidity status.
Our OCD cohort consisted of participants identified as belonging to all three of the symptom clusters identified and accepted as part of OCD according to DSM-5 (9, 12). Furthermore, as is commonly found, just over half of our participants reported comorbid depression (13). Together, these features suggest we had an ecologically valid cohort. When this cohort was compared as a whole to healthy control participants, we found no differences in behavioral measures of response inhibition, as had been found previously (2329). As would be expected for ERP components linked to response inhibition, both N2 and P3 showed greater amplitude in the nogo compared with the go condition. However, importantly for our first hypothesis, there were significant differences between OCD and control participants. In control participants the N2 component was present at both frontal and central locations, whereas within the OCD cohort, although comparable to controls frontally, N2 was absent at the central location, indicating a more localized response in OCD. This site-dependent effect has also been found by others (26, 33) and may have contributed to previous inconsistent results where different electrode sites had been included in analysis or combined in different ways. The OCD participants also had a longer latency response. Previous research has suggested that the latency of the N2 component on this task reflects the speed of the monitoring of conflict; therefore, the increased latency may indicate that OCD influences the time course of inhibitory activity by slowing down the speed of response inhibition (42). The slower latency would suggest reduced conflict monitoring in OCD, causing slower responding to the occurrence of conflicts. There is some evidence to support deficits in conflict monitoring in OCD (43). However, the greater difference in N2 amplitude between the go and nogo conditions (N2d) found in the present study suggests overactive conflict monitoring in this cohort (42, 44). The conflicting findings in the present study are not entirely unprecedented. A recent review has suggested that it is still not clear whether conflict monitoring is reliably altered in OCD (45). Based on the findings presented here, there is evidence for slower but greater conflict monitoring. Interestingly, the results for P3 also show this mixed picture. We found that OCD participants exhibited a greater P3, implying greater response inhibition—a finding in line with previous research, which also suggests that the increased P3 reflects hyperactivity of the underlying neuronal networks between the orbitofrontal and anterior cingulate cortices and basal ganglia in OCD (31). However, we also found a smaller P3d, indicative of reduced response inhibition (44).
These differences in the control group compared with the OCD group, although interesting, are not new findings. The critical element of the current study was to investigate whether there were differences between clusters of those with and without comorbid depression, which may have confounded previous studies. The cluster analysis revealed no differences between the clusters on any measure of response inhibition. This indicates that cohorts with different symptom clusters have not contributed to the inconsistent results previously found. However, it is important to acknowledge that although the overall sample size for the OCD cohort in the present study is considerably larger than in many previous studies (22, 24, 26, 33, 43, 46), the number of participants in each cluster was limited, especially for the symmetry cluster.
The comparison of OCD participants with and without comorbid depression revealed that those with OCD only made more errors of omission that those with comorbid depression. This was the only significant difference found in any behavioral measure for this study. Errors of omission can be considered an index of response execution, as opposed to errors of commission, which are an index of response inhibition. The increased level of omission errors in those with OCD only indicates a deficit in sustained attention (47). Although the higher level of omission errors reported here contrasts with previous work where OCD (in the absence of comorbidities) was associated with a decrease in omission and an increase in commission errors (22), it is in line with studies showing poorer sustained attention in OCD (48, 49). However, this does not explain why the presence of comorbid depression would effectively protect against errors of omission. Previous research has shown errors of omission in depressed participants are comparable to control participants (50), but there is no evidence to suggest those with comorbid depression somehow have improved sustained attention, although this may be something to consider in future research. Irrespective of this, the present data suggest that this particular deficit in OCD leading to increased errors of omission is not due to the presence of depression, as has been previously suggested (51) and more recently discounted elsewhere (52, 53).
There were no significant group differences for most ERP measures, but there was a reduced latency for P3 in those with comorbid depression. This is in line with previous studies of depression showing a short latency P3 in patients with depression relative to healthy controls (54). P3 latency is believed to represent the speed of high-level cognitive activity (55) such that a decrease in latency would suggest an increase in the speed of processing during the stimulus-evaluation and decision-making phases of response. These results, as with the findings on errors, imply that the presence of comorbid depression somehow supports improved task performance. It remains to be seen whether this arises because of effective compensation mechanisms or prior treatment of depression (because current treatment was matched in the present study), for example. Although the effect on response inhibition reported here is small, the prevalence of this comorbidity is high. Therefore, it can be argued that it is beneficial to differentiate comorbidity in analyses of response inhibition. Given these findings, it is possible that the presence of comorbid depression could have had a small effect on previous results in response inhibition studies with OCD participants. However, it is important to recognize the limitations of the work presented here. Although the sample size for the two groups was satisfactory, we did not independently assess depression.
As well as the limitations of sample size discussed above, it is important to note that this study used only one measure of response inhibition—the go/nogo task—and this is a limitation. Response inhibition is not a unitary trait. It involves three distinct elements: action postponement, action restraint, and action cancellation (56). Different tasks access different subcomponents of response inhibition. The go/nogo task may contain response-selection and waiting elements but does not access information related to response cancellation (57). One task that does access this is the stop-signal task (SST), but this in turn does not access the subcomponents available from the go/nogo task (57). Perhaps unsurprisingly, given that they access different subcomponents of response inhibition, performance on these tasks relies on slightly different neural circuitry: the go/nogo task is highly dependent on the inferior frontal cortex and the SST more reliant on normal functioning of the dorso-medial striatum (5860). Previous studies with OCD participants have revealed that there are changes in the inferior frontal cortex for regional blood flow (61, 62), gray matter volume (63), and activation during go/nogo tasks (64). However, OCD is also linked to changes in cortico-striatal circuitry, albeit with most changes noted for the ventral rather than dorsal striatum (65). Nonetheless, this means that using the SST may be a worthwhile future investigation for this clinical group. In addition to using only one task, we only included participants with comorbid depression because this has been shown to be the most common comorbidity, found in over 50% of individuals with OCD (13). However, there are several other comorbid conditions that are relatively common in OCD, including social phobia (35.3%), generalized anxiety disorder (34.1%), and specific phobia (31.6%). Therefore, these additional comorbidities may also affect the measures we collected. Future studies should consider including a wider range of comorbidities.
Conclusions

In summary, we examined response inhibition in different clinical subgroups within OCD, an important step in revisiting research in which the heterogeneity of the condition has been overlooked previously. From these results, we can conclude that symptom cluster is unlikely to have contributed to inconsistencies in previous studies. However, the presence of comorbid depression may have a small effect on results and therefore should be considered for separate analysis in future studies.

References

1.
Fontenelle LF, Hasler G: The analytical epidemiology of obsessive-compulsive disorder: risk factors and correlates. Prog Neuropsychopharmacol Biol Psychiatry 2008; 32:1–15
2.
Ruscio AM, Stein DJ, Chiu WT, et al: The epidemiology of obsessive-compulsive disorder in the National Comorbidity Survey Replication. Mol Psychiatry 2010; 15:53–63
3.
Stein MB, Forde DR, Anderson G, et al: Obsessive-compulsive disorder in the community: an epidemiologic survey with clinical reappraisal. Am J Psychiatry 1997; 154:1120–1126
4.
Pauls DL, Abramovitch A, Rauch SL, et al: Obsessive-compulsive disorder: an integrative genetic and neurobiological perspective. Nat Rev Neurosci 2014; 15:410–424
5.
Goodman WK, Price LH, Rasmussen SA, et al: The Yale-Brown Obsessive Compulsive Scale. Arch Gen Psychiatry 1989; 46:1006–1011
6.
Grabill K, Merlo L, Duke D, et al: Assessment of obsessive-compulsive disorder: a review. J Anxiety Disord 2008; 22:1–17
7.
Leckman JF, Grice DE, Boardman J, et al: Symptoms of obsessive-compulsive disorder. Am J Psychiatry 1997; 154:911–917
8.
Matsunaga H, Hayashida K, Kiriike N, et al: The clinical utility of symptom dimensions in obsessive-compulsive disorder. Psychiatry Res 2010; 180:25–29
9.
Bloch MH, Landeros-Weisenberger A, Rosario MC, et al: Meta-analysis of the symptom structure of obsessive-compulsive disorder. Am J Psychiatry 2008; 165:1532–1542
10.
Stewart SE, Rosario MC, Baer L, et al: Four-factor structure of obsessive-compulsive disorder symptoms in children, adolescents, and adults. J Am Acad Child Adolesc Psychiatry 2008; 47:763–772
11.
Summerfeldt LJ, Richter MA, Antony MM, et al: Symptom structure in obsessive-compulsive disorder: a confirmatory factor-analytic study. Behav Res Ther 1999; 37:297–311
12.
Diagnostic and Statistical Manual of Mental Disorders, 5th ed. Arlington, VA, American Psychiatric Publishing, 2013
13.
Torres AR, Shavitt RG, Torresan RC, et al: Clinical features of pure obsessive-compulsive disorder. Compr Psychiatry 2013; 54:1042–1052
14.
Abramowitz JS, Schwartz SA, Moore KM, et al: Obsessive-compulsive symptoms in pregnancy and the puerperium: a review of the literature. J Anxiety Disord 2003; 17:461–478
15.
Angst J: Comorbidity of anxiety, phobia, compulsion and depression. Int Clin Psychopharmacol 1993; 8(Suppl 1):21–25
16.
Mataix-Cols D, Wooderson S, Lawrence N, et al: Distinct neural correlates of washing, checking, and hoarding symptom dimensions in obsessive-compulsive disorder. Arch Gen Psychiatry 2004; 61:564–576
17.
Lochner C, Stein DJ: Heterogeneity of obsessive-compulsive disorder: a literature review. Harv Rev Psychiatry 2003; 11:113–132
18.
Aouizerate B, Guehl D, Cuny E, et al: Pathophysiology of obsessive-compulsive disorder: a necessary link between phenomenology, neuropsychology, imagery and physiology. Prog Neurobiol 2004; 72:195–221
19.
Evans DW, Lewis MD, Iobst E: The role of the orbitofrontal cortex in normally developing compulsive-like behaviors and obsessive-compulsive disorder. Brain Cogn 2004; 55:220–234
20.
Mavrogiorgou P, Juckel G, Frodl T, et al: P300 subcomponents in obsessive-compulsive disorder. J Psychiatr Res 2002; 36:399–406
21.
Keskin-Ergen Y, Tükel R, Aslantaş-Ertekin B, et al: N2 and P3 potentials in early-onset and late-onset patients with obsessive-compulsive disorder. Depress Anxiety 2014; 31:997–1006
22.
Towey J, Bruder G, Tenke C, et al: Event-related potential and clinical correlates of neurodysfunction in obsessive-compulsive disorder. Psychiatry Res 1993; 49:167–181
23.
Andreou C, Leicht G, Popescu V, et al: P300 in obsessive-compulsive disorder: source localization and the effects of treatment. J Psychiatr Res 2013; 47:1975–1983
24.
Di Russo F, Zaccara G, Ragazzoni A, et al: Abnormal visual event-related potentials in obsessive-compulsive disorder without panic disorder or depression comorbidity. J Psychiatr Res 2000; 34:75–82
25.
Endrass T, Schuermann B, Kaufmann C, et al: Performance monitoring and error significance in patients with obsessive-compulsive disorder. Biol Psychol 2010; 84:257–263
26.
Kim MS, Kim YY, Yoo SY, et al: Electrophysiological correlates of behavioral response inhibition in patients with obsessive-compulsive disorder. Depress Anxiety 2007; 24:22–31
27.
Morault PM, Bourgeois M, Laville J, et al: Psychophysiological and clinical value of event-related potentials in obsessive-compulsive disorder. Biol Psychiatry 1997; 42:46–56
28.
Nieuwenhuis S, Nielen MM, Mol N, et al: Performance monitoring in obsessive-compulsive disorder. Psychiatry Res 2005; 134:111–122
29.
Pallanti S, Castellini G, Chamberlain SR, et al: Cognitive event-related potentials differentiate schizophrenia with obsessive-compulsive disorder (schizo-OCD) from OCD and schizophrenia without OC symptoms. Psychiatry Res 2009; 170:52–60
30.
Guan M, Liao Y, Ren H, et al: Impaired response inhibition in juvenile delinquents with antisocial personality characteristics: a preliminary ERP study in a go/nogo task. Neurosci Lett 2015; 603:1–5
31.
Hester R, Bell RP, Foxe JJ, et al: The influence of monetary punishment on cognitive control in abstinent cocaine-users. Drug Alcohol Depend 2013; 133:86–93
32.
Miyata A, Matsunaga H, Kiriike N, et al: Event-related potentials in patients with obsessive-compulsive disorder. Psychiatry Clin Neurosci 1998; 52:513–518
33.
Ruchsow M, Reuter K, Hermle L, et al: Executive control in obsessive-compulsive disorder: event-related potentials in a go/nogo task. J Neural Transm (Vienna) 2007; 114:1595–1601
34.
Herrmann MJ, Jacob C, Unterecker S, et al: Reduced response-inhibition in obsessive-compulsive disorder measured with topographic evoked potential mapping. Psychiatry Res 2003; 120:265–271
35.
Kim MS, Kang SS, Youn T, et al: Neuropsychological correlates of P300 abnormalities in patients with schizophrenia and obsessive-compulsive disorder. Psychiatry Res 2003; 123:109–123
36.
Sanz M, Molina V, Martin-Loeches M, et al: Auditory P300 event related potential and serotonin reuptake inhibitor treatment in obsessive-compulsive disorder patients. Psychiatry Res 2001; 101:75–81
37.
Steketee G: Overcoming obsessive-compulsive disorder. Best practice for therapy series. Oakland, Calif, New Harbinger Publications, 1999
38.
Kropotov JD, Ponomarev VA: Decomposing N2 NOGO wave of event-related potentials into independent components. Neuroreport 2009; 20:1592–1596
39.
Jasper HH: Report of the Committee on Methods of Clinical Examination in Electroencephalography. Electroencephalogr Clin Neurophysiol 1958; 10:370–371
40.
Nuwer MR, Comi G, Emerson R, et al: IFCN standards for digital recording of clinical EEG. Electroencephalogr Clin Neurophysiol Suppl 1999; 52:11–14
41.
Greenhouse SW, Geisser S: On methods in the analysis of profile data. Psychometrika 1959; 24:95–112
42.
Guo Z, Chen R, Liu X, et al: The impairing effects of mental fatigue on response inhibition: an ERP study. PLoS One 2018; 13:e0198206
43.
Carmona S, Bassas N, Rovira M, et al: Pediatric OCD structural brain deficits in conflict monitoring circuits: a voxel-based morphometry study. Neurosci Lett 2007; 421:218–223
44.
Kiehl KA, Smith AM, Hare RD, et al: An event-related potential investigation of response inhibition in schizophrenia and psychopathy. Biol Psychiatry 2000; 48:210–221
45.
Stern ER, Taylor SF: Cognitive neuroscience of obsessive-compulsive disorder. Psychiatr Clin North Am 2014; 37:337–352
46.
Ursu S, Stenger VA, Shear MK, et al: Overactive action monitoring in obsessive-compulsive disorder: evidence from functional magnetic resonance imaging. Psychol Sci 2003; 14:347–353
47.
Chowdhury NS, Livesey EJ, Blaszczynski A, et al: Pathological gambling and motor impulsivity: a systematic review with meta-analysis. J Gambl Stud 2017; 33:1213–1239
48.
Baykal S, Karabekiroğlu K, Şenses A, et al: Neuropsychological and clinical profiles of children and adolescents diagnosed with childhood obsessive compulsive disorder. Noro Psikiyatri Arsivi 2014; 51:334–343
49.
Norman LJ, Carlisi CO, Christakou A, et al: Shared and disorder-specific task-positive and default mode network dysfunctions during sustained attention in paediatric attention-deficit/hyperactivity disorder and obsessive/compulsive disorder. Neuroimage Clin 2017; 15:181–193
50.
Kaiser S, Unger J, Kiefer M, et al: Executive control deficit in depression: event-related potentials in a go/nogo task. Psychiatry Res 2003; 122:169–184
51.
Basso MR, Bornstein RA, Carona F, et al: Depression accounts for executive function deficits in obsessive-compulsive disorder. Neuropsychiatry Neuropsychol Behav Neurol 2001; 14:241–245
52.
Aycicegi A, Dinn WM, Harris CL, et al: Neuropsychological function in obsessive-compulsive disorder: effects of comorbid conditions on task performance. Eur Psychiatry 2003; 18:241–248
53.
Berlin GS, Lee H-J: Response inhibition and error-monitoring processes in individuals with obsessive-compulsive disorder. J Obsessive Compuls Relat Disord 2018; 16:21–27
54.
Dai Q, Feng Z: Deficient interference inhibition for negative stimuli in depression: an event-related potential study. Clin Neurophysiol 2011; 122:52–61
55.
Kok A: Event-related-potential (ERP) reflections of mental resources: a review and synthesis. Biol Psychol 1997; 45:19–56
56.
Bari A, Robbins TW: Inhibition and impulsivity: behavioral and neural basis of response control. Prog Neurobiol 2013; 108:44–79
57.
Eagle DM, Baunez C: Is there an inhibitory-response-control system in the rat? Evidence from anatomical and pharmacological studies of behavioral inhibition. Neurosci Biobehav Rev 2010; 34:50–72
58.
Aron AR, Robbins TW, Poldrack RA: Inhibition and the right inferior frontal cortex. Trends Cogn Sci 2004; 8:170–177
59.
Aron AR, Robbins TW, Poldrack RA: Inhibition and the right inferior frontal cortex: one decade on. Trends Cogn Sci 2014; 18:177–185
60.
Eagle DM, Baunez C, Hutcheson DM, et al: Stop-signal reaction-time task performance: role of prefrontal cortex and subthalamic nucleus. Cereb Cortex 2008; 18:178–188
61.
Lucey JV, Costa DC, Blanes T, et al: Regional cerebral blood flow in obsessive-compulsive disordered patients at rest: differential correlates with obsessive-compulsive and anxious-avoidant dimensions. Br J Psychiatry 1995; 167:629–634
62.
Lacerda AL, Dalgalarrondo P, Caetano D, et al: Elevated thalamic and prefrontal regional cerebral blood flow in obsessive-compulsive disorder: a SPECT study. Psychiatry Res 2003; 123:125–134
63.
Narayan VM, Narr KL, Phillips OR, et al: Greater regional cortical gray matter thickness in obsessive-compulsive disorder. Neuroreport 2008; 19:1551–1555
64.
Morein-Zamir S, Voon V, Dodds CM, et al: Divergent subcortical activity for distinct executive functions: stopping and shifting in obsessive compulsive disorder. Psychol Med 2016; 46:829–840
65.
Harrison BJ, Soriano-Mas C, Pujol J, et al: Altered corticostriatal functional connectivity in obsessive-compulsive disorder. Arch Gen Psychiatry 2009; 66:1189–1200

Information & Authors

Information

Published In

Go to The Journal of Neuropsychiatry and Clinical Neurosciences
The Journal of Neuropsychiatry and Clinical Neurosciences
Pages: 228 - 238
PubMed: 30888920

History

Received: 25 July 2018
Revision received: 1 October 2018
Accepted: 2 October 2018
Published online: 19 March 2019
Published in print: Summer 2019

Keywords

  1. Obsessive-Compulsive Disorder
  2. Response Inhibition
  3. Heterogeneity
  4. Symptom Cluster
  5. Comorbidity
  6. EEG

Authors

Details

Loes J. Koorenhof, Ph.D.
The School of Life, Health and Chemical Sciences, Open University, Milton Keynes, United Kingdom (Koorenhof); and the Department of Psychology, Institute of Psychiatry, Psychology and Neuroscience, King’s College London (Dommett).
Eleanor J. Dommett, Ph.D. [email protected]
The School of Life, Health and Chemical Sciences, Open University, Milton Keynes, United Kingdom (Koorenhof); and the Department of Psychology, Institute of Psychiatry, Psychology and Neuroscience, King’s College London (Dommett).

Notes

Send correspondence to Dr. Dommett ([email protected]).

Competing Interests

The Open University had no role in the study planning and execution of this study.

Funding Information

Supported by an Open University doctoral studentship to Dr. Koorenhof and conducted under the supervision of Antonio Martins-Mourao, Stephen J. Swithenby, and Eleanor Dommett.The authors report no financial relationships with commercial interests.

Metrics & Citations

Metrics

Citations

Export Citations

If you have the appropriate software installed, you can download article citation data to the citation manager of your choice. Simply select your manager software from the list below and click Download.

For more information or tips please see 'Downloading to a citation manager' in the Help menu.

Format
Citation style
Style
Copy to clipboard

View Options

View options

PDF/EPUB

View PDF/EPUB

Login options

Already a subscriber? Access your subscription through your login credentials or your institution for full access to this article.

Personal login Institutional Login Open Athens login
Purchase Options

Purchase this article to access the full text.

PPV Articles - Journal of Neuropsychiatry and Clinical Neurosciences

PPV Articles - Journal of Neuropsychiatry and Clinical Neurosciences

Not a subscriber?

Subscribe Now / Learn More

PsychiatryOnline subscription options offer access to the DSM-5-TR® library, books, journals, CME, and patient resources. This all-in-one virtual library provides psychiatrists and mental health professionals with key resources for diagnosis, treatment, research, and professional development.

Need more help? PsychiatryOnline Customer Service may be reached by emailing [email protected] or by calling 800-368-5777 (in the U.S.) or 703-907-7322 (outside the U.S.).

Media

Figures

Other

Tables

Share

Share

Share article link

Share