In 2003 the report of the New Freedom Commission (
1) called for making evidence-based practices routinely available in the public mental health system. But widespread dissemination is not sufficient, because in order to be effective these practices must be implemented with high fidelity to the original program models. Fidelity scales are tools for assessing fidelity to program models (
2). A fundamental assumption is that programs implemented with high fidelity will achieve client outcomes similar to those in the controlled studies that established the model's effectiveness. To date, few evidence-based practices have fidelity scales with demonstrable predictive validity.
One exception is the individual placement and support (IPS) model of supported employment, which is a systematic approach to helping clients with severe mental illness obtain competitive employment (
3). It is based on eight principles: eligibility based on client choice, focus on competitive employment, integration of mental health and employment services, attention to client preferences, work incentives planning, rapid job search, systematic job development, and individualized job supports (
4). Systematic reviews have concluded that IPS is an evidence-based practice (
5–
9). The 15-item IPS Fidelity Scale (IPS-15) was developed (
10) and has been widely adopted in routine practice as a quality improvement tool and in formal research studies to monitor treatment integrity and drift. Nine of ten evaluations have found a positive association between the IPS-15 and competitive employment outcomes (
11).
Since the publication of the IPS-15 in 1997, researchers and fidelity assessors have noted deficiencies in the IPS-15, some owing to underspecification of the IPS model in early publications. Specifically, early conceptualizations of the IPS model (
12,
13) gave little attention to benefits counseling about Social Security, Medicaid, and other government programs in relation to gaining employment. Feedback from experts, practitioners, and program leaders (
14) led to the incorporation of this factor in the IPS model (
15). Another omission from the IPS-15 is a measurement of job development, which has always been a key component of the IPS model. Research conducted since the publication of the IPS-15 has suggested the importance of both benefits counseling (
16) and job development (
17).
Other psychometric weaknesses were noted in the IPS-15, even in the original publication (
10). The most commonly noted weakness was that possible scores on the total scale have a restricted range, with only a narrow differentiation between fair and good fidelity. Fidelity assessors reported that 15 items were not of sufficient scope to fully document deficiencies in program implementation and that assessors often improvised by supplementing assessments with qualitative feedback. The expansion of the scale was also facilitated by a growing literature on IPS implementation (
18–
21).
Further deficiencies in the IPS-15 concern weaknesses in the item descriptions, such as global and impressionistic rating criteria; subsequent IPS research now justifies more precise scaling. For all these reasons, a task force of IPS researchers and trainers convened in a series of meetings starting in 2007, which culminated in the development of an expanded and revised scale. The group revised the scale by clarifying explanations, adding new items, splitting items with multiple components into separate items, and changing item anchors, such as defining more stringent anchors for caseload standards (established in field surveys) (
22). For the first time, a comprehensive manual for conducting the fidelity assessment was created, based on more than ten years of field experience (
23).
Worldwide adoption of the IPS-25 has begun (
20). Since 2008, fidelity assessors have gained experience with this new scale. Validation studies of IPS-25 are needed.
In summary, deficiencies of the IPS-15 became apparent over time, and trainers and researchers collaborated to develop a more comprehensive and well-specified fidelity tool. Trainers find the new tool more useful for providing training and technical assistance. However, we need to make certain that predictive validity has not been sacrificed. The study reported here examined the hypothesis that the IPS-25 is correlated with competitive employment outcomes. We also evaluated other psychometric properties of this scale.
Methods
Overview
The study drew on secondary data analysis from an ongoing quality improvement strategy employed in an IPS learning collaborative in 13 states devoted to implementing high-fidelity IPS services (
24). The Dartmouth College Institutional Review Board approved the study as exempt.
Sample
Eight of the 13 states in the IPS learning collaborative participated. We excluded the one state not using the IPS-25 and three states that were still in the start-up phase of IPS implementation. One state opted not to participate in the project.
The sample consisted of 79 sites; the number of sites per state varied (range two to 21), consistent with the stage of IPS dissemination within each state. On average, programs had an active caseload of 59 clients (range ten to 334). Most sites had reported outcomes for at least one year before the most recent fidelity assessment. However, 17 sites had been reporting outcomes for fewer than three quarters before the date of the fidelity assessment used in the analysis.
Measures
Fidelity.
The IPS-25 (also known as the Supported Employment Fidelity Scale) assesses adherence to the evidence-based principles of supported employment (
23). Each item is rated on a 5-point behaviorally anchored dimension, with a rating of 5 indicating close adherence to the model and 1 representing substantial lack of model adherence. For example, rapid job search is scored 5 if the first contact with an employer is on average within one month after program entry, whereas 1 represents a delay of up to one year. Ratings of 4, 3, and 2 represent gradations between these two extremes.
The total score on the IPS-25 is the summed total of item scores. Therefore, the lowest possible score is 25, and the highest possible score is 125. The scale developers defined benchmarks to communicate descriptive labels regarding progress in attaining IPS fidelity. High fidelity is defined as 100 (mean item score of 4.0), following the convention in the literature (
25). Programs scoring between 74 and 99 are considered to have achieved fair fidelity, and those with scores below 74 (mean item score of <3.0) have not implemented IPS. At the upper end, 115 (mean item score of 4.6) and above is labeled exemplary fidelity, presenting a challenging but attainable target for program implementation.
The fidelity manual recommends that two trained fidelity assessors conduct a 1.5-day site visit to complete the IPS-25. Assessors follow a detailed protocol with instructions for preparing sites for the visit, critical elements in the fidelity assessment, and sample interview questions (
23). Assessors interview the vocational program leader and two or more employment specialists, observe team meetings and community contacts with employers, interview clients, and review client charts. After the site visit, assessors independently make fidelity ratings. They then reconcile any discrepancies to arrive at final fidelity ratings. For quality improvement purposes, assessors prepare a fidelity report summarizing ratings and providing recommendations for improvement. The fidelity scale and manual are in the public domain (
www.dartmouth.edu/~ips/page19/page19.html).
Competitive employment rate.
Competitive employment is defined as employment in integrated work settings in the competitive job market at prevailing wages, with supervision provided by personnel employed by the business. We used the quarterly competitive employment rate, based on at least one day of competitive employment during a specified three-month period. The site-level competitive employment rate was calculated as the number of clients employed divided by number of clients active on the caseload during the quarter in which the fidelity assessment was completed.
Program longevity.
As a proxy measure for program longevity in providing IPS services, we recorded the number of quarters each program site had been reporting outcomes.
Data collection procedures
As part of the agreement for participating in the IPS learning collaborative, individual sites agree to collect annual fidelity assessments and quarterly competitive employment outcomes (
24,
26). Fidelity reviews were conducted according to each state's procedures. The fidelity assessors for each state included trainers from technical assistance centers and state mental health and vocational rehabilitation agencies. Several steps were taken to enhance quality control in the use of the IPS-25. First, the IPS fidelity manual was distributed to the state trainers (
23). The state trainers then attended 2008 and 2009 annual conferences, which included workshops on its application. In addition, bimonthly teleconferences were held with state trainers to discuss the IPS-25.
As part of the agreement for the learning collaborative, each state appointed a coordinator to routinely compile quarterly outcome data and report them to the Dartmouth Psychiatric Research Center (
26). For this study, state coordinators also compiled site-level fidelity data by using a standardized spreadsheet from their most recent on-site fidelity reviews, which occurred between August 2008 and July 2010.
Coordinators transmitted the fidelity spreadsheets to the research team, which merged the fidelity and outcome data files by using site codes. We used site outcome data for the quarter in which the fidelity review occurred. We used the competitive employment rate for the subsequent quarter in three sites missing employment data for the same quarter as the fidelity assessment.
Data analysis
Exploratory data analysis was used to plan statistical methods (
27). Item-level correlations with employment were used to identify fidelity items with poor predictive validity. We also examined statistical significance for the 25 bivariate item correlations (using the Pearson correlation) without correcting for multiple comparisons. All measures used in the main analyses had adequate variability, and the distributions generally conformed with the assumptions of parametric tests. Q-Q plots for primary correlational analyses suggested Pearson correlations were suitable to assess the levels of association between the four measures of interest—that is, the two primary measures (IPS-25 and competitive employment rate) and two secondary measures (local unemployment rate and program longevity). Using multiple regression, we examined the fidelity-outcome relationship, controlling for unemployment rate and program longevity. Finally, we conducted the analysis of variance linear trend analysis on the classification based on benchmark fidelity levels.
The primary hypothesis was that the IPS-25 would be positively associated with the competitive employment rate. Our two secondary hypotheses were that the unemployment rate would be negatively correlated with the competitive employment rate and that program longevity would be positively correlated with both the IPS-25 and competitive employment rate.
Results
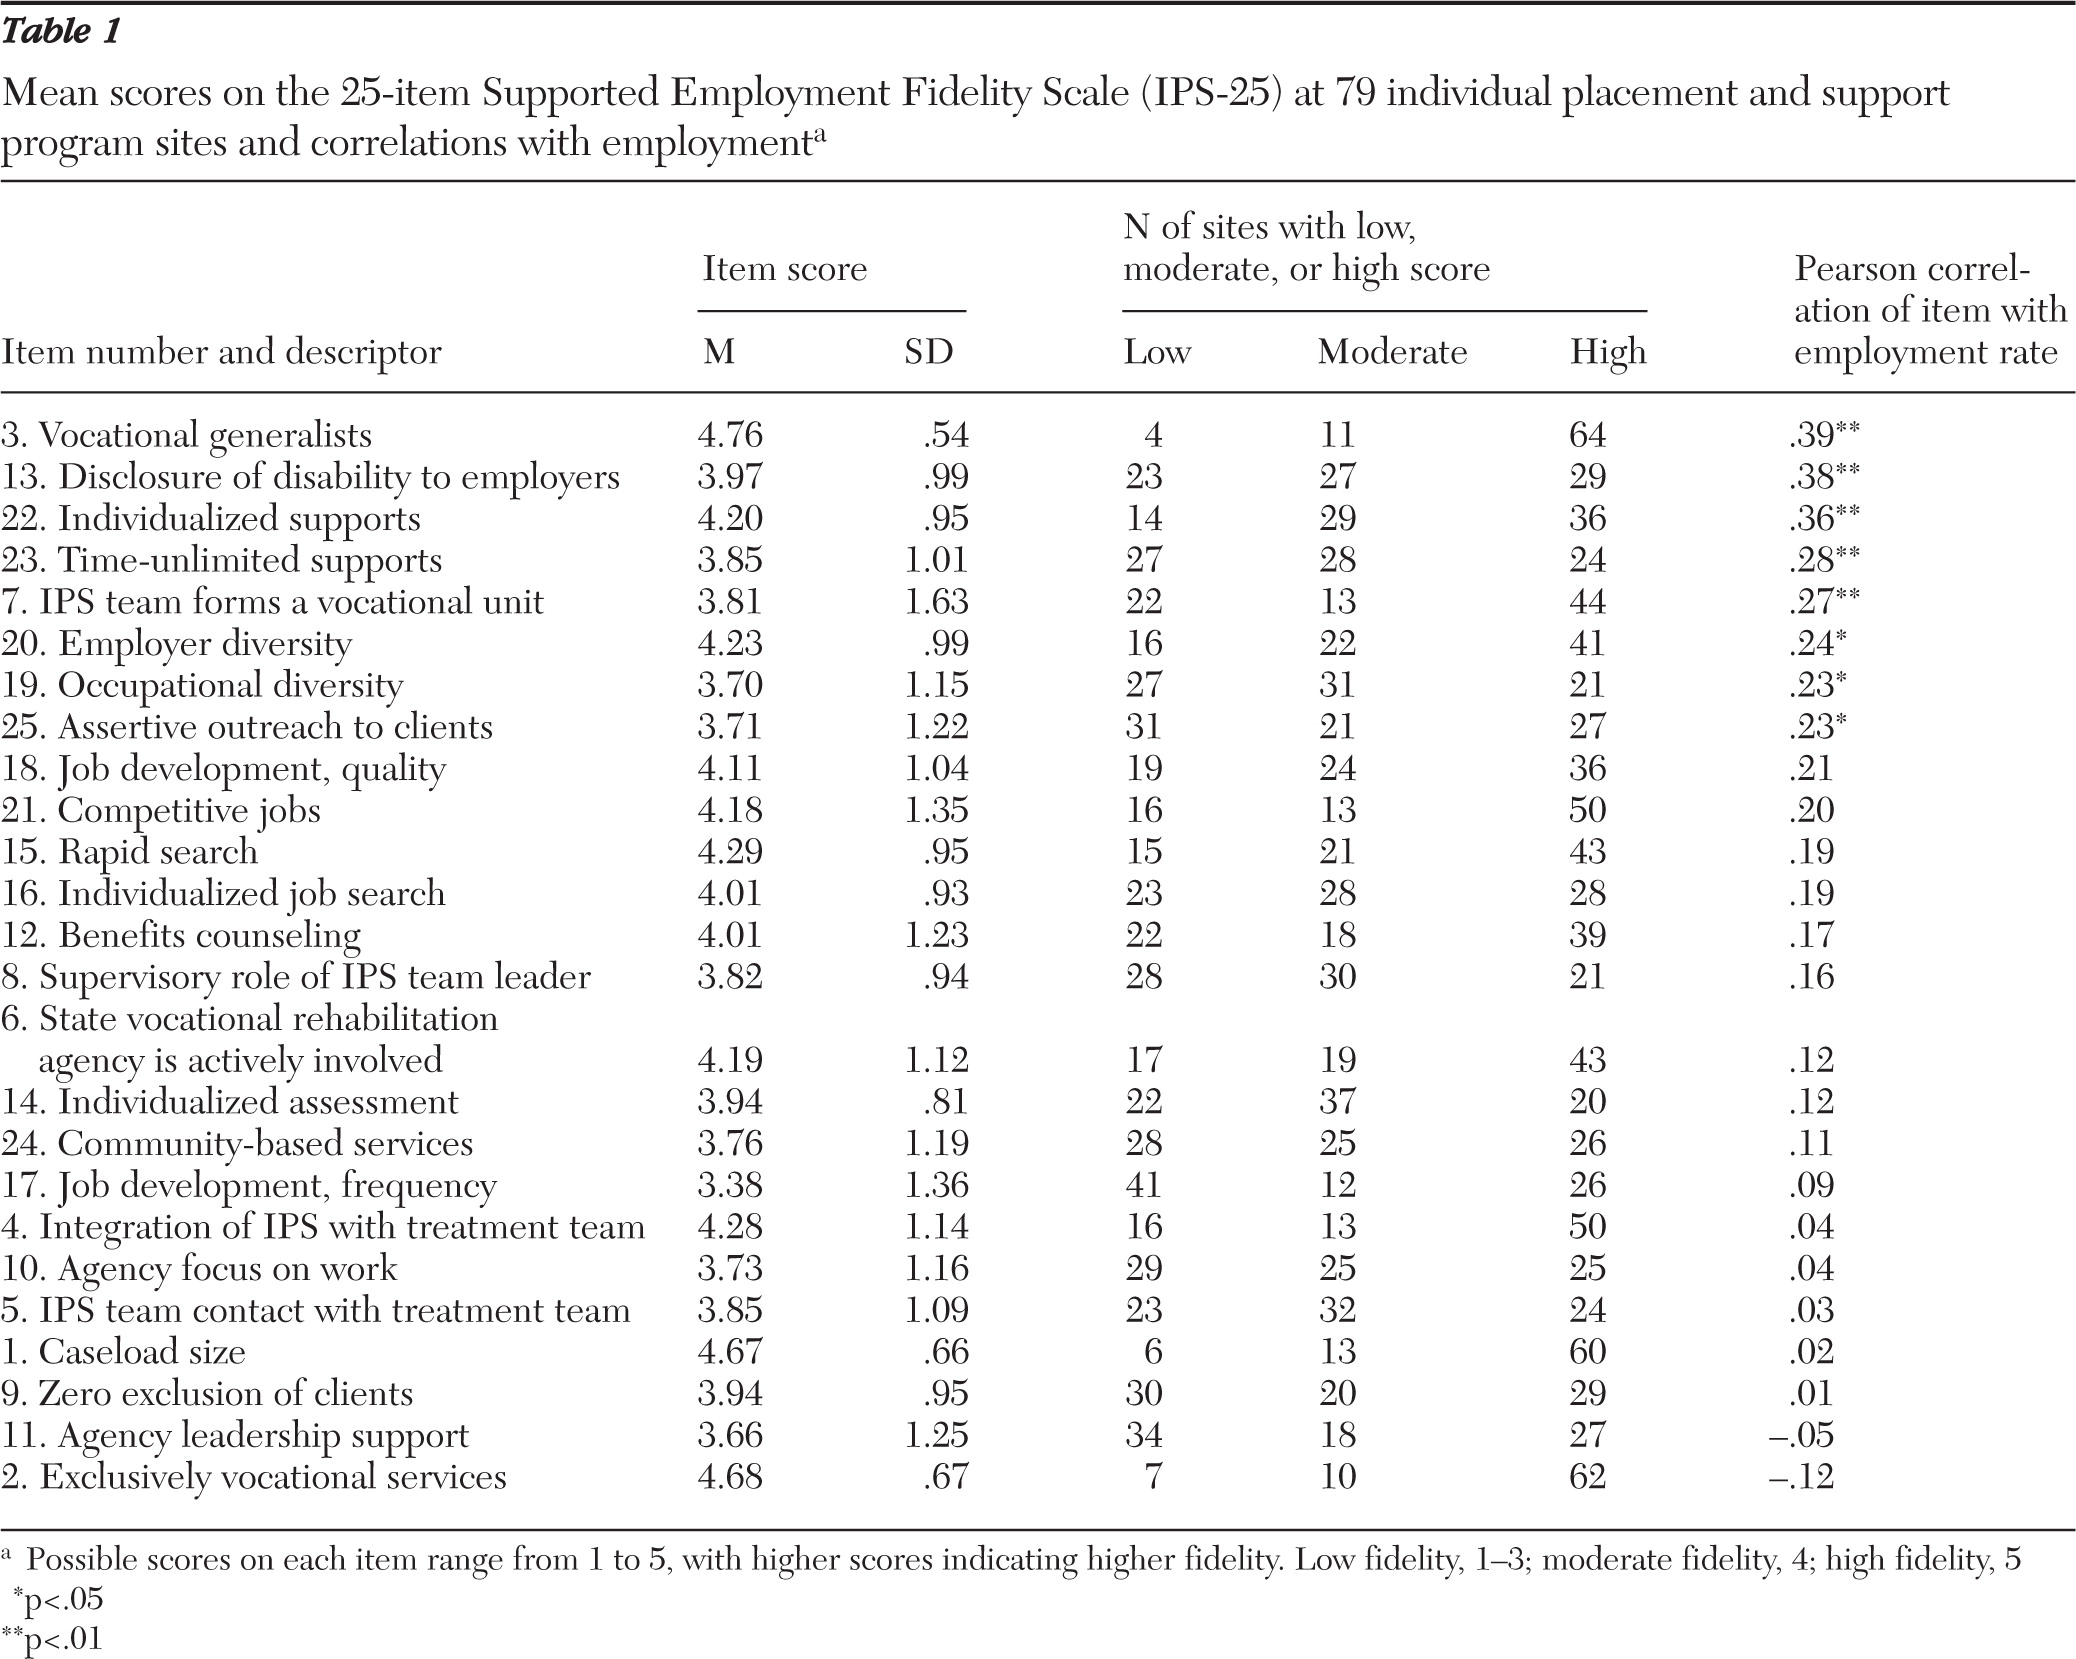
Descriptive statistics of the IPS-25 items sorted by item correlations with employment are shown in
Table 1. Item distributions were negatively skewed. The item scores indicate that some aspects of fidelity, such as caseload size, exclusively vocational services, focus on competitive employment, and rapid job search, are well understood and widely implemented in IPS programs. Other facets of fidelity, such as frequency of job development, community-based services, zero exclusion of clients, and contact with the treatment team, are less widely implemented. The internal consistency (Cronbach's alpha) for the total scale was .88. With two exceptions, all the correlations between items and employment were positive, and eight were statistically significant. Items related to vocational generalists, disclosure of disability, individualized and time-unlimited supports, and the vocational unit were the most strongly correlated with employment.
The mean±SD for the IPS-25 total score was 101±13, with a range of 56 to 123. Overall, 52 sites (66%) achieved a fidelity score of 100 or more, the cut-off for high fidelity. The mean±SD competitive employment rate was 37%±13%, with a range of 0% to 63%.
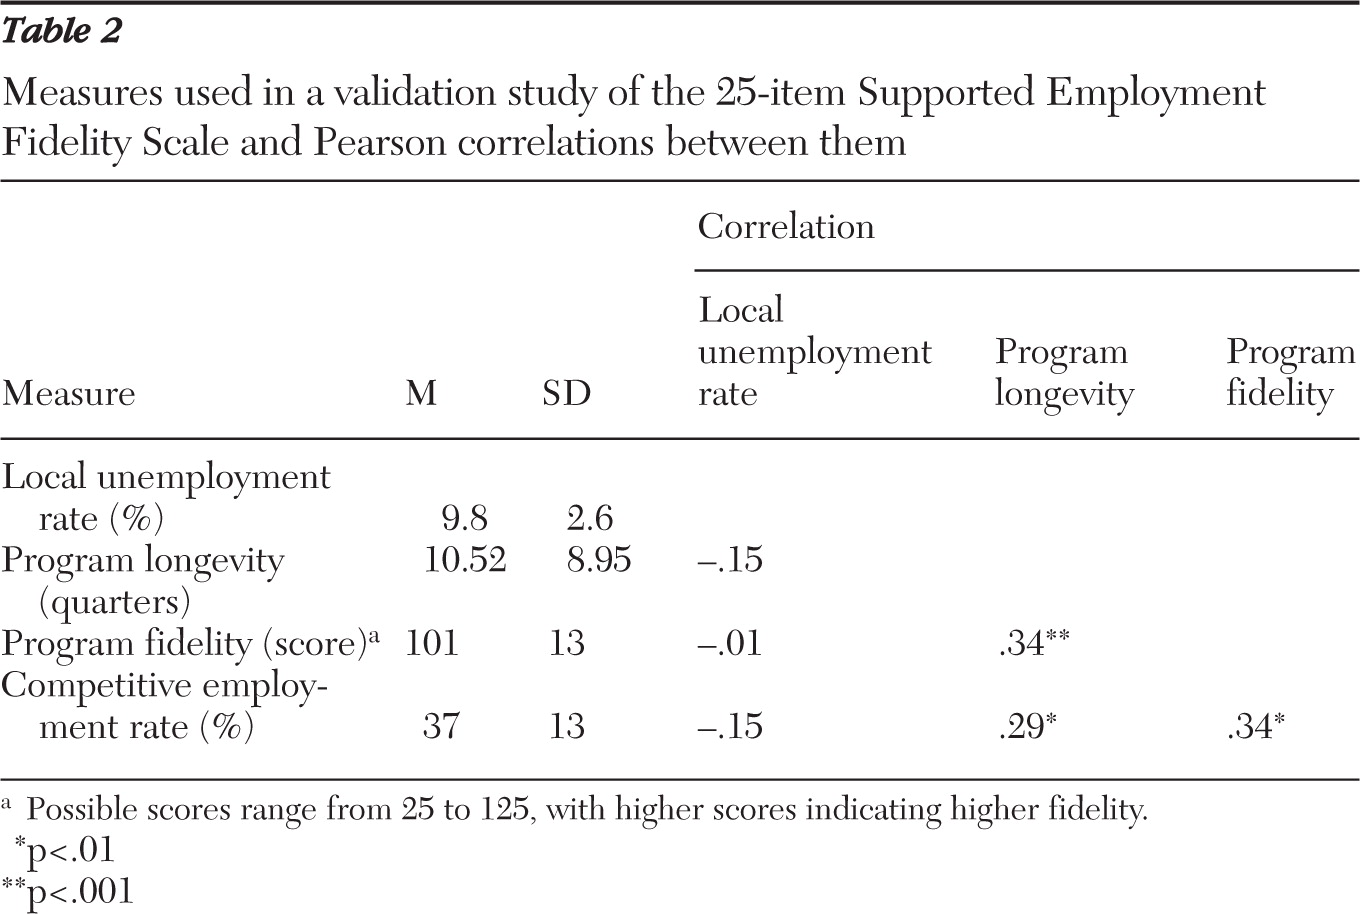
As shown in
Table 2, IPS-25 fidelity was significantly correlated with employment rate, as hypothesized. Contrary to our hypothesis, the local unemployment rate was unrelated to the competitive employment rate. Finally, as hypothesized, program longevity was positively correlated with both fidelity and the competitive employment rate. Multiple regression analysis entering three predictor variables (IPS-25, unemployment rate, and program longevity) and the competitive employment rate as the criterion found that the IPS-25 was the only significant predictor (partial correlation=.24, p<.05).
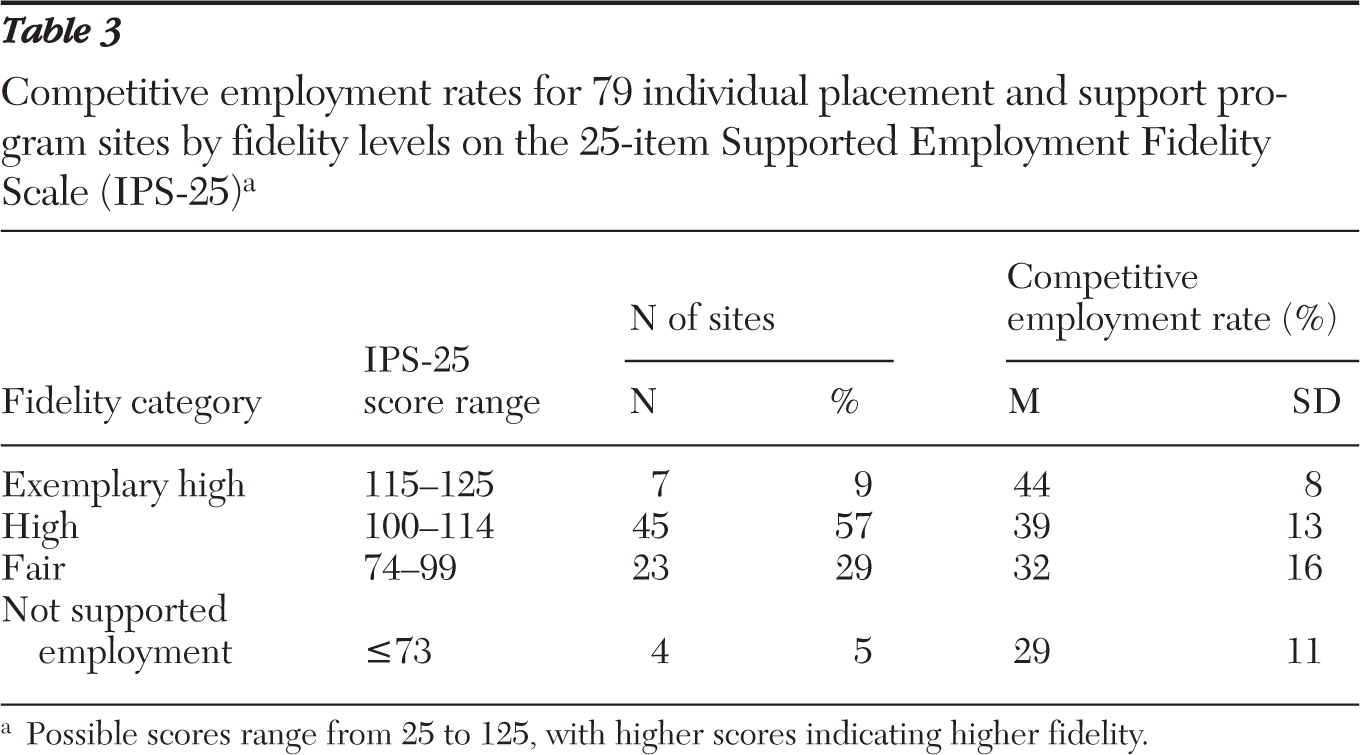
We also examined the fidelity-outcome relationship by using the fidelity benchmark classification (
Table 3). The mean competitive employment rate increased monotonically from “IPS not implemented” (29%) to fair fidelity (32%), high fidelity (39%), and exemplary high fidelity (44%) (F=6.80, df=1 and 75, p=.01).
Discussion
The findings provide preliminary evidence for the psychometric adequacy of the IPS-25. The IPS-25 had satisfactory internal consistency. As hypothesized, fidelity was significantly correlated with the employment rate, even after the analysis controlled for local unemployment rate and program longevity. We also found that program longevity was associated with both fidelity and competitive employment outcome. The longer sites had participated in the learning collaborative, the better their fidelity and the better their outcomes, which are two goals of the collaborative. Given the intentional effort to improve fidelity through periodic fidelity reviews, the findings of higher fidelity and higher rates of competitive employment for more established programs are consistent with the hypothesis that fidelity is associated with better outcome.
Thus the study reported here adds to the literature suggesting that higher fidelity to the IPS model is associated with better employment outcomes (
11). It reinforces the importance of measuring IPS fidelity for both research and quality improvement. The descriptive data also clarify the extent to which IPS components have been fully adopted within field settings and suggest directions for further model development.
Notably, all participating sites aspired to high fidelity to the IPS model, leading to a restriction of range in fidelity scores, as reflected in the preponderance of sites rated in the fair fidelity range and higher. Predictive validity would have been increased had we included more sites with both very low fidelity and poor employment outcomes, as the program longevity correlations suggest. Consistent with the restriction-of-range interpretation, one IPS-15 study with a very strong fidelity-outcome correlation (r=.76) used a sample that included sites with a variety of non-evidence-based models (
28).
One pertinent question is whether the predictive validity for the IPS-25 is equal to or exceeds that for the IPS-15. One basis for comparison is a review of IPS-15 studies, which found a mean correlation of .39 (range −.07 to .76) between the IPS-15 and competitive employment in six studies that reported this statistic (
11). Thus the evidence is currently stronger for the predictive validity of the IPS-15 than for the IPS-25, justifying its continued use. But fidelity assessors familiar with both scales agree that the IPS-25 is a far more useful tool for providing feedback to sites for quality improvement as well as for educating staff about model principles, especially in the area of job development. From a scientific perspective, an optimal solution is to use both scales until further evidence accumulates.
The IPS learning collaborative has made fidelity assessment the linchpin of its approach to quality improvement. Its two critical assumptions are that IPS is effective and that the fidelity scale measures the key components that make it effective. Regarding the first assumption, the evidence from randomized controlled trials is overwhelming (
5). The study reported here provides evidence that the second assumption has merit. Improving program fidelity from poor fidelity (a score of less than 74 on the IPS-25) to good fidelity (100 or more) might be expected to result in an average increase in the competitive employment rate in the range of 10%. Moreover, several studies have provided direct evidence that programs receiving appropriate fidelity consultation can increase from poor to good IPS fidelity over a relatively brief time—within one year in one study (
29). A direct test is needed of the hypothesis of improved employment as a result of improved fidelity as measured by the IPS-25.
Woolf and Johnson (
30) have framed the question of quality improvement strategy in terms of the break-even point for investing resources in better fidelity or in further enhancements of an evidence-based practice. Although this break-even point for the IPS model has not been determined, the results of this study suggest that measuring fidelity and making improvements based on these assessments is worthwhile. Fidelity assessments do not conflict with other management practices and are sensible steps to take before augmenting IPS with complex and costly interventions.
The local economy—as reflected in the local unemployment rate—has been shown to be associated with competitive employment outcomes for IPS programs in some studies (
6,
31,
32). The lack of a significant association in this study is puzzling. From other sources we know that people with disabilities were differentially affected by the widespread hiring freezes during the recessionary period in which this study was conducted (
33). More specifically, longitudinal data from the IPS learning collaborative suggest that the overall employment rate for the total sample was suppressed approximately 3% to 5% during this period (
26). We speculate that some IPS programs developed strategies that counteracted poor economic conditions.
Study limitations include the fact that the IPS-25 has been introduced into the field only recently, and fidelity assessors may suggest further item refinements as experience accumulates. In our view, content validity based on actual use should be the primary guide to scale revision. Some IPS-25 items may eventually be discarded as not useful. Other items, such as the role of collaboration with the state vocational rehabilitation agency, are culture bound and inapplicable in countries with different legislation regarding mental health and rehabilitation services. Because of the recent dissemination of the IPS-25, another limitation is that assessors may be less reliable in administering it (even with a comprehensive fidelity manual); with more experience, fidelity assessment may increase in validity. A further limitation concerns the potential variability in the collection of the employment data. Despite steps taken to enhance data quality, reliability across numerous sources reporting the data was not ensured. On the other hand, one strength of this study is that it was conducted under routine practice conditions. As a practical matter, we are interested in the validity of a fidelity scale in the hands of people who are on the front line seeking to implement evidence-based practices. Another limitation is external validity; states and sites participating in the learning collaborative are primarily early adopters (
34), and findings from the sites included in this volunteer sample may not generalize.
Fidelity is not the only factor affecting outcome; at most it explains 25% of the variance in outcome (
35). Factors such as practitioner skills (
36), cultural and societal factors, systems factors, and community factors exert powerful influences on outcomes. Future psychometric studies should include such factors as covariates.
Conclusions
A revised fidelity scale, the IPS-25, is being widely disseminated as a quality improvement tool for implementing evidence-based supported employment programs. The preliminary evidence for its predictive validity is promising. This first report on the IPS-25 also provides information to program leaders regarding the relative attainment of IPS components in actual practice.
Acknowledgments and disclosures
The authors thank the state leaders and program leaders in the IPS Learning Collaborative who provided the data for this study.
The authors have received financial support from the Johnson & Johnson Office of Corporate Contributions.


