Racial-Ethnic Differences in Health Service Use in a Large Sample of Homeless Adults With Mental Illness From Five Canadian Cities
Abstract
Objective:
Methods:
Results:
Conclusions:
Methods
Design
Study Population
Theoretical Framework
Outcomes
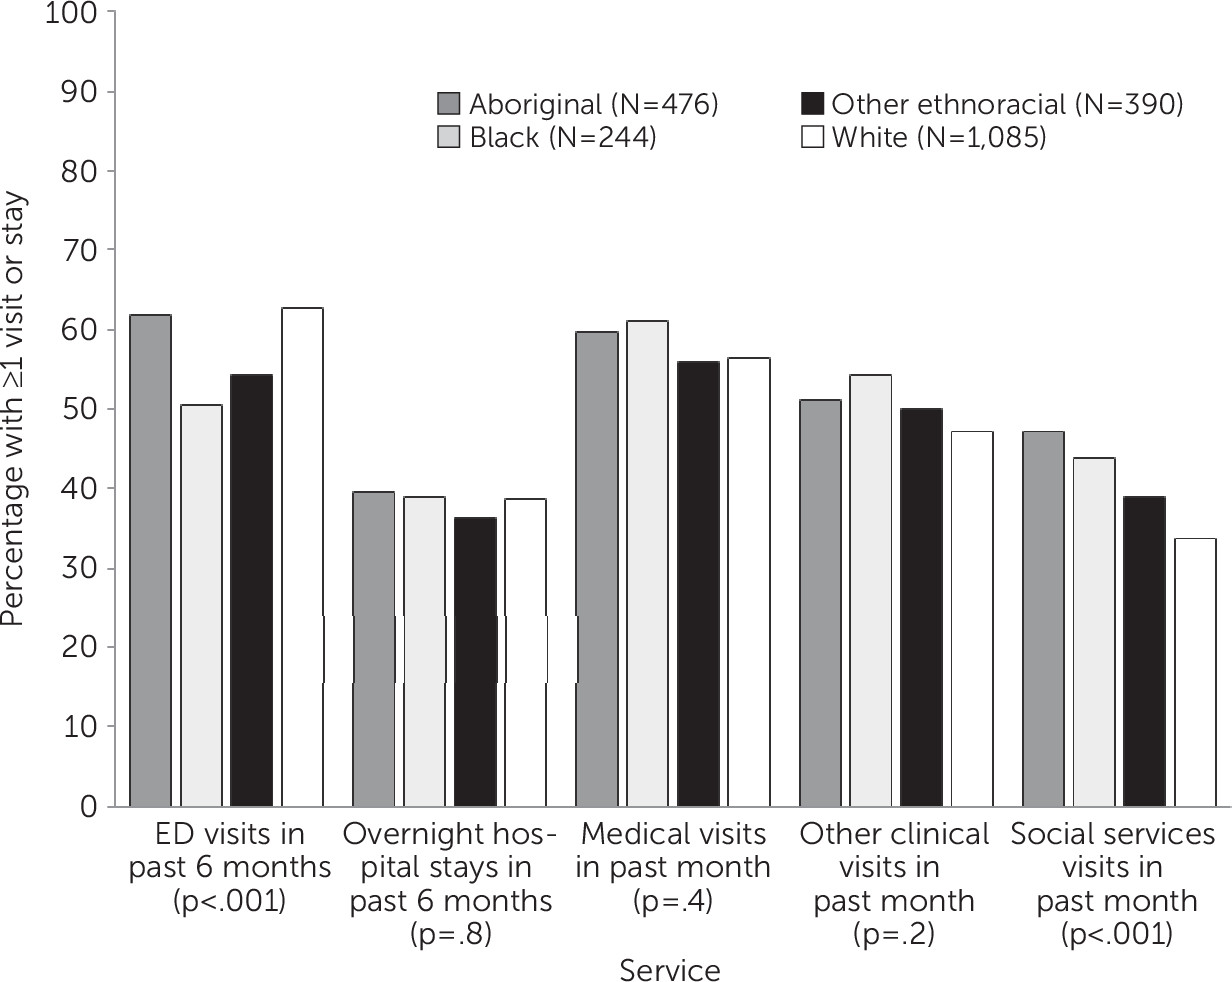
Emergency department, medical, other clinical and social provider visits.
Hospitalizations.
Explanatory Variables
Racial-ethnic or cultural identity.
Other predisposing factors.
| Factor and characteristic | Totala (N=2,195) | White (N=1,085) | Aboriginal (N=476) | Black (N=244) | Other (N=390) | ||||||
|---|---|---|---|---|---|---|---|---|---|---|---|
| N | % | N | % | N | % | N | % | N | % | p | |
| Predisposing factor | |||||||||||
| Age (M±SD)b | 40.9±11.2 | 42.9±11.1 | 38.2±10.0 | 37.8±11.6 | 40.5±11.5 | <.001 | |||||
| Sex | .004 | ||||||||||
| Male | 1,480 | 67 | 750 | 69 | 288 | 61 | 170 | 70 | 272 | 70 | |
| Female, transgender, or other | 715 | 33 | 335 | 31 | 188 | 39 | 74 | 30 | 118 | 30 | |
| Lifetime homelessness | <.001 | ||||||||||
| ≥3 years | 1,091 | 51 | 525 | 49 | 274 | 59 | 117 | 48 | 175 | 46 | |
| <3 years | 1,065 | 49 | 544 | 51 | 187 | 41 | 125 | 52 | 209 | 54 | |
| Education | <.001 | ||||||||||
| Completed high school or some postsecondary education | 969 | 44 | 510 | 47 | 126 | 27 | 135 | 56 | 198 | 51 | |
| Did not complete high school | 1,217 | 56 | 572 | 53 | 348 | 74 | 108 | 44 | 189 | 49 | |
| Marital status | .04 | ||||||||||
| Single or never married | 1,540 | 70 | 754 | 70 | 334 | 71 | 189 | 78 | 263 | 67 | |
| Other | 655 | 30 | 331 | 30 | 142 | 30 | 55 | 22 | 127 | 33 | |
| Arrested in past 6 months | .50 | ||||||||||
| Yes | 603 | 28 | 284 | 26 | 136 | 29 | 74 | 31 | 109 | 28 | |
| No | 1,565 | 72 | 790 | 74 | 331 | 71 | 168 | 69 | 276 | 72 | |
| Need factor | |||||||||||
| Needs for mental health services | .58 | ||||||||||
| High | 887 | 40 | 453 | 42 | 191 | 40 | 94 | 39 | 149 | 39 | |
| Moderate | 1,308 | 60 | 632 | 58 | 285 | 60 | 150 | 62 | 241 | 62 | |
| MINI diagnosis of a substance use disorderc | <.001 | ||||||||||
| Yes | 1,488 | 68 | 733 | 68 | 402 | 85 | 129 | 53 | 224 | 57 | |
| No | 707 | 32 | 352 | 32 | 74 | 15 | 115 | 47 | 166 | 43 | |
| Chronic health conditions | <.001 | ||||||||||
| ≥3 | 1,546 | 70 | 775 | 71 | 392 | 82 | 116 | 48 | 263 | 67 | |
| <3 | 649 | 30 | 310 | 29 | 84 | 18 | 128 | 52 | 127 | 33 | |
| SF-12 mental health component score (M±SD)d | 34.2±13.1 | 33.2±13.3 | 34.7±11.4 | 37.4±13.8 | 34.3±13.5 | <.001 | |||||
| SF-12 physical health component score (M±SD)d | 45.0±11.9 | 45.2±12.2 | 43.3±10.8 | 46.6±11.8 | 45.4±12.1 | .001 | |||||
| Enabling factor | |||||||||||
| Has a regular medical doctor | .03 | ||||||||||
| Yes | 1,365 | 62 | 650 | 60 | 324 | 68 | 150 | 62 | 241 | 62 | |
| No | 823 | 38 | 432 | 40 | 151 | 32 | 91 | 38 | 149 | 38 | |
| Has a usual source of health care | .27 | ||||||||||
| Yes | 1,822 | 84 | 891 | 83 | 402 | 85 | 212 | 87 | 317 | 82 | |
| No | 359 | 16 | 186 | 17 | 71 | 15 | 32 | 13 | 70 | 18 | |
| Main source of health caree | .002 | ||||||||||
| ED | 406 | 19 | 234 | 22 | 69 | 15 | 38 | 16 | 65 | 17 | |
| Other | 1,411 | 65 | 657 | 61 | 332 | 70 | 173 | 71 | 249 | 65 | |
| None | 359 | 17 | 186 | 17 | 71 | 15 | 32 | 13 | 70 | 18 | |
| Has an unmet need for health care | <.001 | ||||||||||
| Yes | 1,024 | 47 | 535 | 50 | 242 | 52 | 78 | 32 | 169 | 44 | |
| No | 1,146 | 53 | 541 | 50 | 227 | 48 | 163 | 68 | 215 | 68 | |
Need factors.
Enabling factors.
Statistical Analysis
Results
Racial-Ethnic or Cultural Identity and Access to Care
Racial-Ethnic or Cultural Identity and Health Service Use

| Model and predictor | Emergency department visits | Hospital days | Medical visits | Clinical visits | Social service provider visits | ||||||||||
|---|---|---|---|---|---|---|---|---|---|---|---|---|---|---|---|
| RR | 95% CI | p | RR | 95% CI | p | RR | 95% CI | p | RR | 95% CI | p | RR | 95% CI | p | |
| Unadjusted model | N=2,157 | N=2,190 | N=2,173 | N=2,173 | N=2,173 | ||||||||||
| Racial-ethnic or cultural identity (reference: white) | |||||||||||||||
| Aboriginal | 1.02 | .86–1.21 | .82 | .67 | .49–.93 | .02 | .82 | .70–.97 | .02 | 1.12 | .90–1.39 | .31 | 1.53 | 1.20–1.95 | <.001 |
| Black | .51 | .40–.64 | <.001 | 1.32 | .87–2.00 | .19 | .88 | .71–1.08 | .23 | 1.13 | .85–1.49 | .40 | 1.12 | .82–1.53 | .49 |
| Other | 1.12 | .93–1.34 | .22 | 1.08 | .77–1.53 | .65 | .86 | .72–1.02 | .08 | .94 | .74–1.19 | .61 | 1.25 | .96–1.63 | .09 |
| Adjusted model | N=2,057 | N=2,082 | N=2,074 | N=2,074 | N=2,074 | ||||||||||
| Predisposing factor | |||||||||||||||
| Racial-ethnic or cultural identity (reference: white) | |||||||||||||||
| Aboriginal | .85 | .71–1.01 | .07 | .91 | .64–1.29 | .60 | .84 | .71–.99 | .04 | 1.04 | .82–1.32 | .74 | 1.54 | 1.18–2.01 | .002 |
| Black | .54 | .43–.69 | <.001 | 1.14 | .73–1.78 | .56 | .94 | .76–1.16 | .55 | 1.24 | .92–1.66 | .16 | 1.18 | .85–1.64 | .31 |
| Other | 1.10 | .92–1.32 | .30 | .93 | .65–1.33 | .68 | .85 | .72–1.02 | .08 | .98 | .77–1.25 | .89 | 1.44 | 1.10–1.89 | .008 |
| Age at enrollment | .99 | .98–.99 | <.001 | 1.01 | .99–1.02 | .37 | .99 | .98–1.00 | .002 | .99 | .98–1.00 | .10 | .99 | .98–1.00 | .17 |
| Male | .83 | .71–.95 | .01 | .79 | .59–1.06 | .11 | 1.05 | .91–1.20 | .52 | 1.09 | .90–1.33 | .36 | 1.15 | .92–1.42 | .22 |
| ≥3 years lifetime homelessness | 1.20 | 1.05–1.38 | .008 | .77 | .59–1.01 | .06 | .88 | .77–1.00 | .05 | 1.02 | .85–1.23 | .81 | 1.18 | .97–1.44 | .10 |
| Completed high school or some postsecondary education | 1.29 | 1.13–1.49 | <.001 | 1.26 | .97–1.66 | .09 | 1.28 | 1.12–1.46 | <.001 | 1.16 | .96–1.4 | .12 | 1.20 | .97–1.47 | .09 |
| Single or never married | .86 | .73–1.00 | .05 | 1.27 | .93–1.73 | .13 | .86 | .74–.99 | .04 | .89 | .72–1.1 | .28 | .98 | .78–1.22 | .85 |
| Arrested in past 6 months | 1.28 | 1.10–1.48 | .001 | .78 | .59–1.05 | .11 | 1.06 | .92–1.23 | .40 | .97 | .79–1.18 | .73 | 1.49 | 1.19–1.85 | .001 |
| Need factor | |||||||||||||||
| High needs for mental health services | 1.54 | 1.34–1.77 | <.001 | 2.42 | 1.85–3.17 | <.001 | 1.38 | 1.20–1.57 | <.001 | 1.05 | .87–1.27 | .59 | .89 | .73–1.09 | .27 |
| Diagnosis of a substance use disorder | 1.26 | 1.07–1.47 | .005 | .83 | .61–1.12 | .23 | .91 | .78–1.05 | .20 | 1.41 | 1.15–1.73 | .001 | 1.01 | .80–1.27 | .95 |
| ≥3 chronic health conditions | 1.14 | .96–1.35 | .15 | .86 | .62–1.19 | .37 | 1.30 | 1.10–1.53 | .002 | 1.35 | 1.07–1.71 | .01 | .93 | .73–1.19 | .57 |
| SF-12 components | |||||||||||||||
| MCS | 1.00 | .99–1.00 | .11 | 1.01 | 1.00–1.02 | .25 | .99 | .99–1.00 | .01 | 1.00 | 1.00–1.01 | .37 | 1.00 | .99–1.01 | .62 |
| PCS | .98 | .97–.98 | <.001 | 1.00 | .98–1.01 | .50 | .99 | .98–1.00 | <.001 | 1.01 | 1.00–1.02 | .03 | 1.00 | .99–1.01 | .88 |
| Enabling factors | |||||||||||||||
| Has a regular medical doctor | 1.16 | 1.01–1.34 | .03 | .97 | .74–1.28 | .84 | 1.51 | 1.32–1.73 | <.001 | 1.23 | 1.02–1.47 | .03 | 1.20 | .97–1.48 | .10 |
| Has an unmet need for health care | 1.16 | 1.00–1.33 | .04 | .80 | .59–1.07 | .14 | .98 | .85–1.12 | .74 | 1.28 | 1.05–1.55 | .01 | 1.50 | 1.21–1.84 | <.001 |
Discussion
Conclusions
Acknowledgments
Footnote
References
Information & Authors
Information
Published In

Cover: Bowl, interior, Zuni People, circa 1889. Painted terracotta MNC12330. Cité de la Ceramique, Sevres, France. Photo: Martine Beck-Coppola.
History
Authors
Competing Interests
Funding Information
Metrics & Citations
Metrics
Citations
Export Citations
If you have the appropriate software installed, you can download article citation data to the citation manager of your choice. Simply select your manager software from the list below and click Download.
For more information or tips please see 'Downloading to a citation manager' in the Help menu.
View Options
View options
PDF/EPUB
View PDF/EPUBLogin options
Already a subscriber? Access your subscription through your login credentials or your institution for full access to this article.
Personal login Institutional Login Open Athens loginNot a subscriber?
PsychiatryOnline subscription options offer access to the DSM-5-TR® library, books, journals, CME, and patient resources. This all-in-one virtual library provides psychiatrists and mental health professionals with key resources for diagnosis, treatment, research, and professional development.
Need more help? PsychiatryOnline Customer Service may be reached by emailing [email protected] or by calling 800-368-5777 (in the U.S.) or 703-907-7322 (outside the U.S.).
