There is a growing body of evidence in favor of measurement-based care (MBC) in mental health to improve treatment outcomes, increase patient engagement, and close the gap in treatment effectiveness between clinical research and practice (
1–
4). MBC, the practice of using systematically measured clinical outcomes to inform treatment decisions, also generates data needed to fulfill quality reporting requirements for accreditation and reimbursement. Widespread adoption of MBC in mental health will depend on identifying performance measures that adequately adjust for variability in case mix while maintaining transparency and interpretability.
In 2017, the National Committee for Quality Assurance (NCQA) implemented depression response and remission as health plan performance measures for the Healthcare Effectiveness and Data Information Set (HEDIS) (
5). NCQA defines depression response as a 50% or greater reduction in score on the Patient Health Questionnaire depression module (PHQ-9) (
6,
7). On the basis of the PHQ-9, remission is defined as a follow-up score of <5. Both definitions descended from remission and response measures initially developed for other depression scales and used primarily for pharmacotherapy trials (
8,
9).
Effect size and severity-adjusted effect size (SAES) are alternative measures of depression treatment success used in much of the clinical research establishing evidence-based practices for depression and by many health systems’ internal quality-monitoring programs. Currently used calculations of effect size and SAES have evolved from earlier efforts (such as Jacobson and Truax [
10]) to identify clinically meaningful improvement in the burden of depression symptoms rather than change due to chance. A typical effect size calculation for the PHQ-9 quantifies the absolute change in total score relative to variability in the survey instrument (
11). SAES calculations further adjust for baseline severity by comparing observed change in the PHQ-9 to that expected given an initial score.
The objective of this study was to compare four depression treatment success measures—response, remission, effect size, and SAES—using electronic health record data from two large integrated health systems. We examined two questions relevant to the selection of performance measures: What are the rates of agreement among different measures? For which measures is the probability of treatment success associated with baseline symptom severity?
Methods
Data were collected from the Colorado and Washington regions of Kaiser Permanente, two large integrated health care organizations serving a combined population of approximately 1.4 million members. Enrollment in each system occurs through a mixture of employer-sponsored insurance, individual insurance, capitated Medicare and Medicaid programs, and other state-subsidized low-income insurance programs. Demographic characteristics of members in both systems generally reflect those of the surrounding geographic areas. Each system maintains a research virtual data warehouse containing electronic health record (EHR) and insurance claim data (
12). Institutional review boards at each site approved use of health system data for this project.
The PHQ-9 is a widely used self-reported questionnaire that assesses depression symptoms during the prior 2 weeks (
6). Total scores on the questionnaire range from 0 to 27, and cut points of 5, 10, 15, and 20 demarcate mild, moderate, moderately severe, and severe levels of depressive symptoms, respectively. Both Kaiser Permanente organizations recommend using the PHQ-9 prior to all mental health specialty visits, but implementation of this practice varied during the study period. At Kaiser Permanente Colorado (KPC), PHQ-9 data were collected with tablet computers in the waiting room before appointments. Patients at Kaiser Permanente Washington (KPW) completed paper questionnaires that were then entered into the EHR by the treating provider.
The study sample included new episodes of psychotherapy for depression between February 2016 and January 2017. A new episode was defined as the patient’s having no procedure code for a psychotherapy visit in the prior 365 days. The sample was further limited to patients ages 13 or older at the initial visit (baseline) with a total PHQ-9 score of ≥10 at baseline and at least one PHQ-9 score recorded between 14 and 180 days after baseline (follow-up). Episodes which had no follow-up PHQ-9 score but were otherwise eligible for inclusion were included in sensitivity analyses that adjusted for loss to follow-up.
Only psychotherapy visits to internal or group practice providers were included so that data were available in EHRs. For new psychotherapy episodes for which a PHQ-9 score was not recorded at the initial visit, the nearest PHQ-9 score recorded in the preceding 14 days or following 7 days was adopted as the baseline score. For incomplete questionnaires that had at least six of the nine items completed, the mean score for completed items was assumed for unanswered items to obtain a total score. PHQ-9 questionnaires with fewer than six completed items were discarded. All PHQ-9 scores during the follow-up period were extracted from the EHR.
Patient characteristics at episode onset were also extracted from health system records, including demographic characteristics, insurance type, current psychotropic medication use, current or past psychiatric diagnoses, and history of psychiatric hospitalizations and emergency department visits. The distribution of baseline characteristics for episodes with and without an available follow-up PHQ-9 score were compared within each health system by using a two-sample t test for continuous variables and a chi-square test for categorical variables.
Binary indicators of depression treatment success for each episode were defined for the best (i.e., lowest) PHQ-9 score observed between 14 and 180 days after episode onset. The window we used to assess outcome was earlier and wider than that used for some existing quality indicators (
5) in order to capture early treatment success among patients who did not return for later follow-up measurements (
13). Response was defined as a reduction of 50% or more between baseline and follow-up PHQ-9 score. Remission was defined as a follow-up PHQ-9 score of <5. Therefore, given the study inclusion criteria of a baseline PHQ-9 score ≥10, all episodes with observed response also had remission by definition.
Continuous effect size and SAES measures were calculated by using episode data from each health system to estimate the reference standard deviation and regression models (
11). Effect size for an episode is equal to the difference between follow-up and baseline PHQ-9 scores divided by the standard deviation of baseline PHQ-9 scores. Successful treatment effect size was defined as an effect size ≥0.8 for the primary analysis, and other thresholds (0.6, 1, and 1.2) were considered for sensitivity analyses. Sensitivity analyses also examined the impact of using two alternate approaches for calculating the standard deviation: first, standard deviation of the difference between follow-up and baseline scores; and second, standard deviation of baseline PHQ-9 scores from all eligible baseline episodes regardless of availability of follow-up score.
Calculations for SAES required two steps (
11). First, we fit a linear regression model using all episodes to estimate the average follow-up PHQ-9 score given a particular baseline PHQ-9 score. For each episode, the residual between the observed follow-up PHQ-9 score and that predicted by the regression model (given the observed baseline PHQ-9 score) was calculated. Second, the standard deviation of the absolute change in PHQ-9 scores from baseline to follow-up was estimated. SAES for an episode is equal to the sum of the episode residual and the average change in score for all episodes divided by the standard deviation of all changes in scores. Successful SAES was defined as SAES ≥0.8 for the primary analysis, and other thresholds (0.6, 1, and 1.2) were considered for sensitivity analyses.
Descriptive analyses summarized the number and proportion of episodes with treatment success on each of four measures for the best and final PHQ-9 follow-up scores. Cross-tabulation of success rates and graphical displays were used to examine agreement among performance measures. Logistic regression was used to evaluate evidence of association between baseline PHQ-9 score (independent variable) and success on each measure (dependent variable). The primary analysis used an additive adjustment for site to maximize statistical power, and sensitivity analyses included an interaction between site and baseline score. Logistic regression models did not include other baseline characteristics, because the outcome measures examined do not, in practice, incorporate additional adjustment variables.
Additional sensitivity analyses were performed to evaluate the impact on study conclusions of loss to follow-up. Probability of follow-up was estimated for all eligible baseline episodes by using logistic regression adjusted for baseline PHQ-9 and other baseline covariates as selected by lasso penalization (
14,
15). Baseline covariates for this regression were patient characteristics at episode onset, including demographic factors and history of psychiatric diagnoses, psychotropic medication prescriptions, and emergency department and inpatient hospitalizations with psychiatric diagnoses. Our primary analysis of the association between baseline score and treatment success was repeated for each of the four measures by using logistic regression with inverse probability weighting for follow-up. An alternate SAES outcome was also defined by using inverse probability weighting for the linear regression model of expected follow-up PHQ-9 score given the baseline score.
All analyses were repeated by using the final PHQ-9 score available between 14 and 180 days after baseline instead of the best score.
Results
We identified 2,559 eligible psychotherapy episodes at KPC and 2,995 at KPW (see flow diagram in
online supplement). The mean±SD baseline PHQ-9 score was similar at each site: 16.9±4.4 at KPC and 16.6±4.6 at KPW (see figure in
online supplement). Persons with episodes in the analytic data set were primarily female, white, non-Hispanic, and commercially insured and had diagnoses of depression and anxiety (
Table 1). For approximately half of episodes, antidepressant prescriptions were filled in the 90 days preceding baseline.
The baseline PHQ-9 scores of episodes were similar, whether or not follow-up PHQ-9 scores were available (1,561 episodes at KPC and 970 at KPW were missing follow-up scores). However, episodes with and without follow-up scores differed on several characteristics, including patient age, race, ethnicity, insurance type, and recent antidepressant or antipsychotic medication fills (
Table 1).
For episodes in the analytic data set, the median number of PHQ-9 follow-up scores (i.e., a score recorded between 14 and 180 days after baseline) was two (interquartile range [IQR]=1–4) at KPC and three (IQR=1–5) at KPW. PHQ-9 scores were recorded for most mental health encounters during the follow-up period (74% of 10,305 KPC visits and 82% of 13,884 KPW visits). For the average episode, the final PHQ-9 score was recorded more than 3 months after treatment initiation (median=93 days; IQR=42–148 days), indicating that patients received less intensive treatment rather than a shorter duration of treatment. The mean of the best score for follow-up episodes was 9.4±6.0 at KPC and 9.7±5.9 at KPW (see figure in online supplement). (Treatment episodes are described in more detail in the online supplement.)
By any measure, treatment success rates were similar at the two sites (
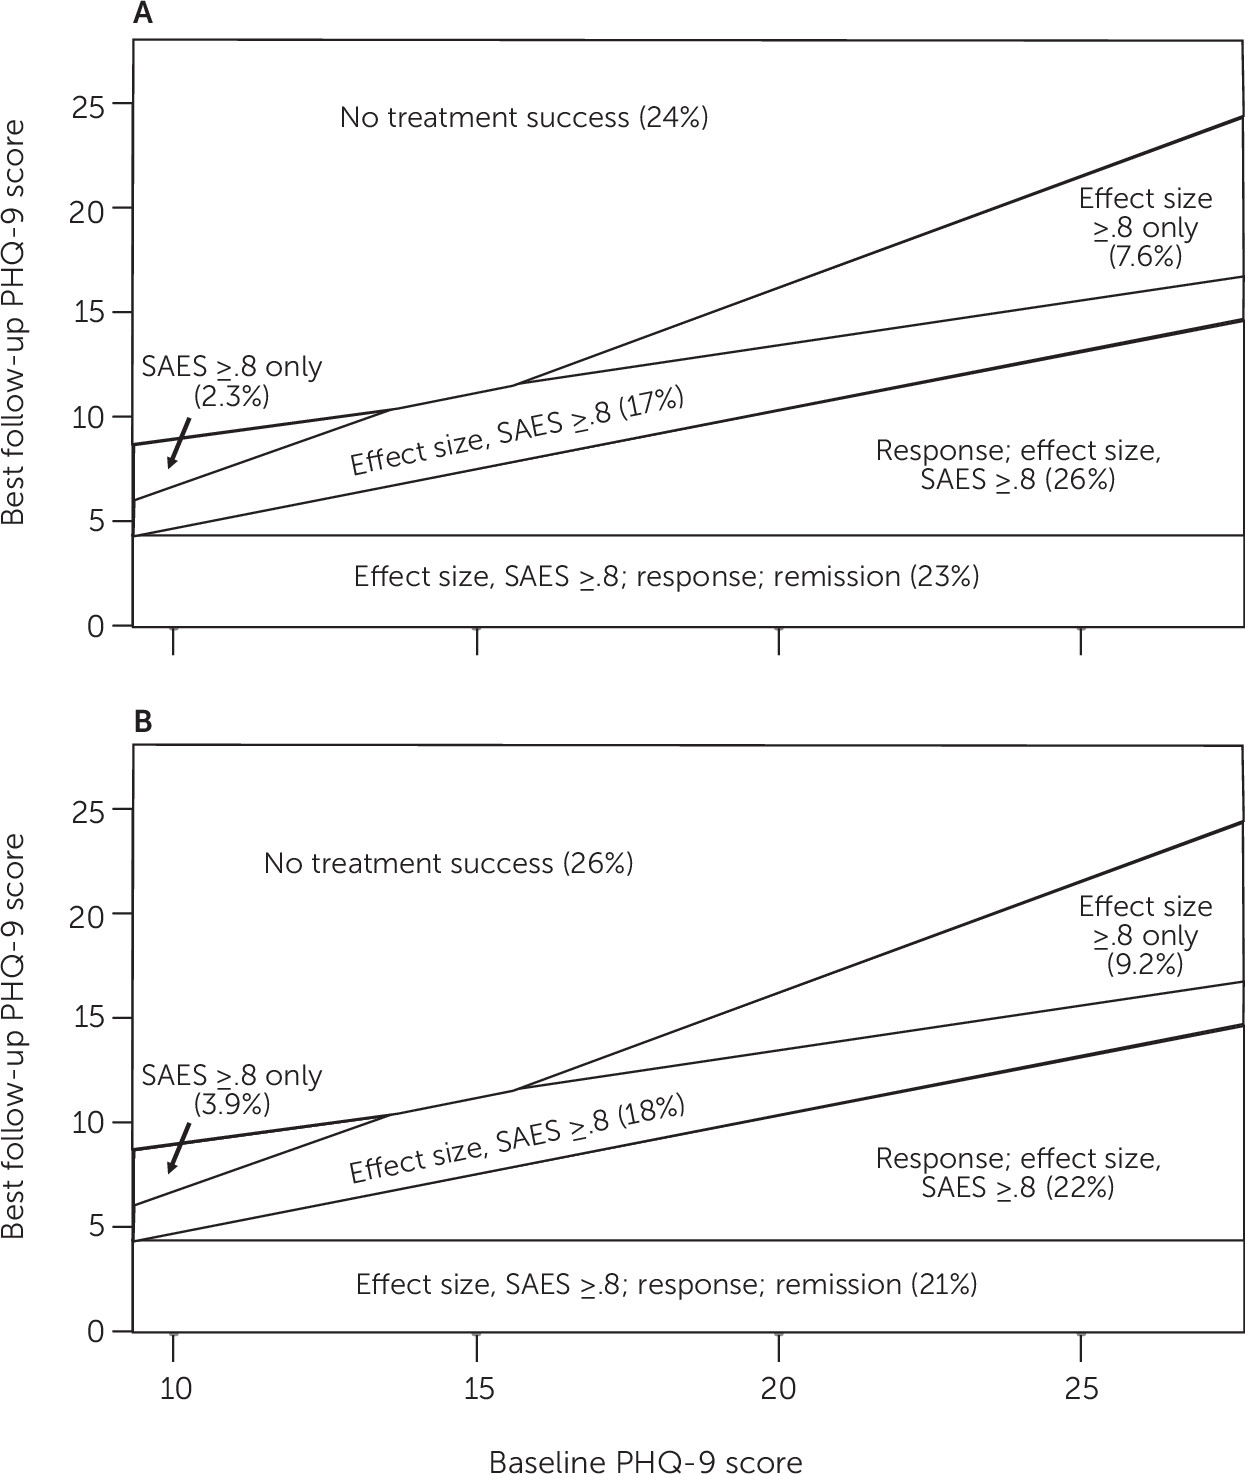
Table 2). Effect size ≥0.8 was the more frequently attained treatment success measure at each site (72% across sites), followed by SAES ≥0.8 (66%), response (46%), and remission (22%). All episodes with successful treatment response also demonstrated effect size ≥0.8 and SAES ≥0.8 (see table in
online supplement). Similarly, all episodes with remission were successful on all other measures. Effect size and SAES measures did not show this pattern, however, because some episodes achieved effect size ≥0.8 without SAES ≥0.8 and vice versa. This ordering of treatment success measures is illustrated in
Figure 1.
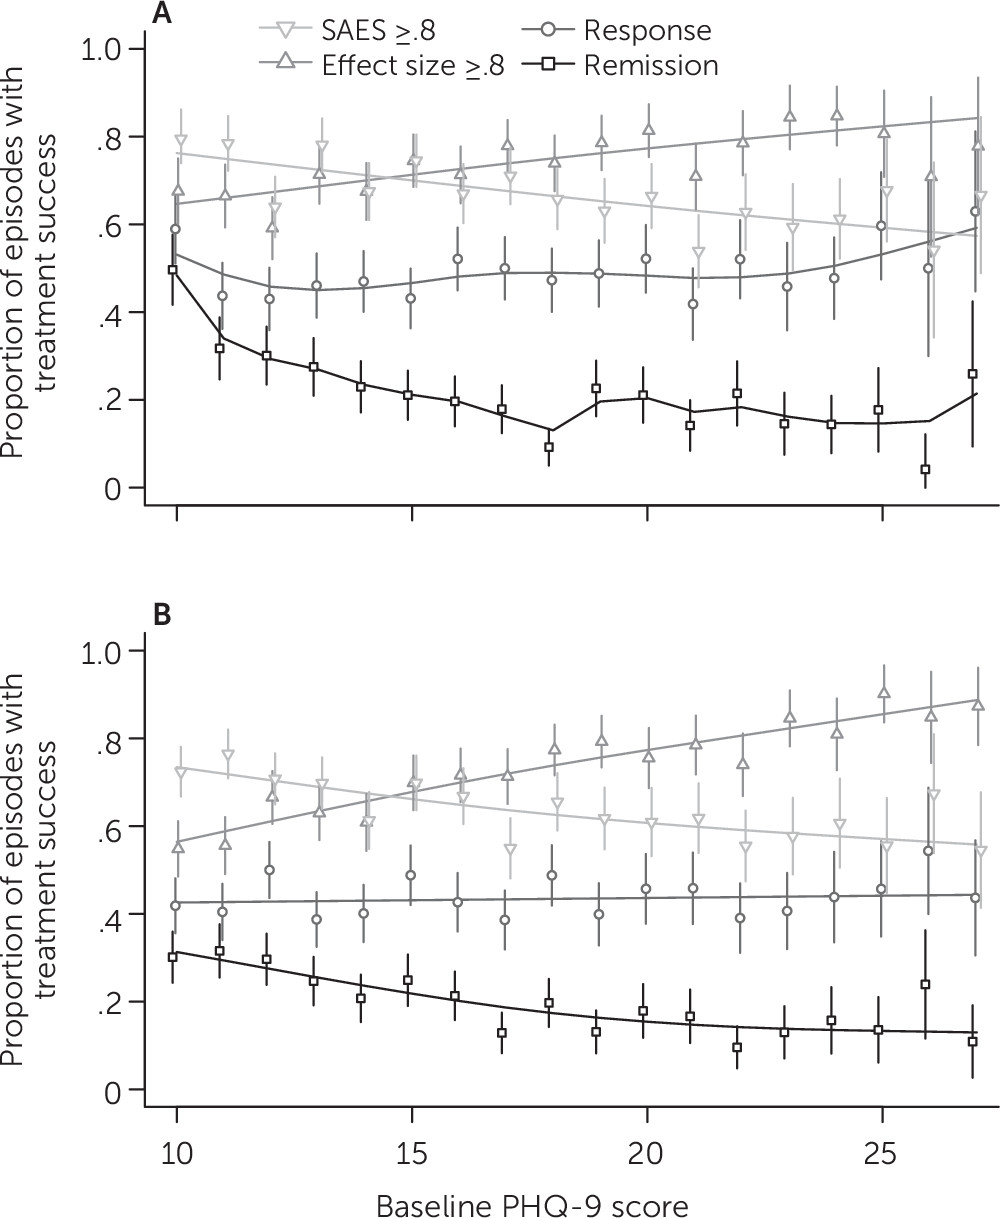
There was no association between probability of successful response and baseline PHQ-9 score; response rates were similar across all baseline scores (
Figure 2). Effect size ≥0.8 was more likely in episodes with higher baseline PHQ-9 scores (odds ratio [OR]=2.31, 95% confidence interval [CI]=2.01–2.65, p<0.001, for a 10-point increase in baseline PHQ-9 score), whereas SAES ≥0.8 favored lower baseline scores (OR=0.61, 95% CI=0.54–0.69, p<0.001). Remission was also more likely for episodes with low baseline PHQ-9 scores (OR=0.43, 95% CI=0.37–0.50, p<0.001). Results were similar if the primary analysis was stratified by site (see table in
online supplement).
These findings about the relationship between baseline PHQ-9 scores and treatment success rates were sustained in all sensitivity analyses. Analyses weighted for differential loss to follow-up showed that all measures but response favored episodes with higher or lower baseline symptom severity (see table in online supplement). Estimated associations were also robust to variations in the method used for calculating effect size and SAES as well as to thresholds other than 0.8 to define success (see table and figures in online supplement). Using other percentage improvement thresholds to define response showed a slight positive association, but the magnitude of the estimates (OR for 10-point difference was below 1.25 for all) were considerably smaller than the associations seen for other measures (see table and figure in online supplement). Defining treatment outcomes by using the final follow-up PHQ-9 score (rather than the best score) also found the same relationships between success rates and baseline PHQ-9 scores (see tables in online supplement).
Discussion
Our analysis of treatment outcomes for 5,554 depression episodes at two large integrated health systems found that rates of treatment success varied considerably across measures. Effect size ≥0.8 was the success measure most likely to be met, whereas remission was the least likely. We also found that agreement between performance measures followed a pattern: all episodes with remission had effect size ≥0.8 and SAES ≥0.8 and, by definition, successful treatment response, and all episodes with response had effect size ≥0.8 and SAES ≥0.8.
Rates of successful treatment response were not associated with initial symptom severity, whereas rates of other measures of treatment success depended on baseline PHQ-9 scores. The probability of effect size ≥0.8 was higher among episodes with higher baseline PHQ-9 scores. Rates of remission and SAES ≥0.8 were higher among episodes with lower baseline PHQ-9 scores. Extensive sensitivity analyses showed that conclusions were not affected if alternate calculations or thresholds were used to define success or if analyses were adjusted for loss to follow-up (see online supplement).
Because success rates were independent of baseline severity, we conclude that treatment response better enables fair and unbiased comparison of providers or clinics in our setting, compared with the other measures examined. If a performance measure favors providers who see patients with either more or less severe symptoms at baseline, providers are incentivized to treat only patients who are likely to be successful, and providers who take all comers may be penalized. There is an opportunity for future work in this area to consider how adjustment for baseline characteristics, including patient demographic factors and history of mental health treatment, could improve the accuracy and fairness of depression care monitoring and performance measures. This study examined the relationship between baseline symptom severity and treatment outcomes as they are currently calculated and did not include additional covariate adjustment. Other measures of change in depression symptom burden (such as reliable clinically significant change criteria) could also be evaluated in future analyses (
16).
In addition to permitting fair and unbiased comparisons, an ideal measure of treatment outcome will meet two other criteria: the measure is credible to clinicians and clinical leaders, and the measure distinguishes clinically meaningful from trivial change. Response and remission, newly designated health plan performance measures for HEDIS, provide understandable and transparent measures of depression treatment outcomes. Both measures can be easily calculated without statistical expertise or proprietary software and are readily understood and credible to mental health providers and other stakeholders. Unlike effect size and SAES, response and remission do not rely on assumptions about expected change and variability in symptom scores. Although effect size and SAES have the advantage of adjusting for noise in the survey instrument, conclusions based on effect size and SAES are sensitive to the choice of reference population and method of calculation (
11). With proprietary software or other guarded data analyses, these selections are not revealed, and any comparison between providers or systems without the same reference population and calculation methods is meaningless. This analysis used an internal reference population, but appropriate reference groups would vary across settings.
Response and remission also offer clinically valid measures of improvement in depression symptoms. Depression remission is the ideal outcome for an individual undergoing psychotherapy, because patients who reach remission have better daily function and long-term prognosis than responders; however, response also represents a meaningful reduction in symptom burden and is a helpful marker to inform treatment decisions (
17). Because some patients will never achieve remission (i.e., those with treatment-resistant depression) and because remission is more likely for episodes with lower initial symptom severity, response is a preferable performance measure for comparing providers fairly.
As MBC relies on repeated assessments, treatment dropout impedes MBC in mental health care. In this study, baseline symptom severity was similar for episodes with and without follow-up PHQ-9 scores. Having a follow-up score was associated with other baseline characteristics, including demographic factors, insurance coverage, and clinical history, but sensitivity analyses accounting for differences in follow-up did not change our conclusions. Emphasis on MBC and accreditation programs such as HEDIS, which include process measures for completed follow-up alongside quality performance measures, will decrease missingness, and health systems could consider means of administering the survey outside the clinic for patients who have completed treatment. For example, PHQ-9 questionnaires could be completed electronically through secure online patient portals.
We should acknowledge some important limitations. Our findings regarding different outcome specifications for the PHQ-9 might not generalize to other self-reported or clinician-administered measures of depression severity. Findings also might not generalize to clinical settings serving different patient populations or providing different types of treatment. More specifically, patients in the setting studied made relatively infrequent visits, and many discontinued treatment early. Patterns of improvement might be different for patients receiving more intensive or sustained treatment. This study examined quality measures for comparing health system performance in an observational setting. Different definitions of treatment episodes and outcomes may be more appropriate for comparing the effectiveness of treatment options.
Conclusions
MBC has the potential to improve depression treatment outcomes, but its implementation relies on identifying appropriate markers of treatment success. This study examined four measures previously shown to indicate clinically meaningful improvement in depression symptoms: response, remission, effect size ≥0.8, and SAES ≥0.8. Response and remission, current HEDIS measures of depression care performance, are also easy to understand and calculate at the point of care. Our findings show that treatment response is a preferable measure for comparing performance of providers because it does not favor episodes with more or less severe symptom burden at baseline.


