Introduction
About 60 years ago
Eysenck (1952) reviewed the published research on adult psychotherapy and concluded, “The figures fail to support the hypothesis that psychotherapy facilitates recovery from neurotic disorder” (p. 323). Five years later
Levitt (1957) reviewed the research on child and adolescent psychotherapy and reached a verdict similar to that of Eysenck: “. . . the results of the present study fail to support the view that psychotherapy with ‘neurotic’ children is effective” (p. 195). These two articles triggered many criticisms from throughout the world, but these two psychologists updated their literature reviews and came to the same conclusions made in their first articles (
Eysenck, 1961;
Levitt, 1963).
In spite of such negative reviews of research on psychotherapy, psychotherapists continued to practice. On rare occasions they reported their results. For example,
Heilbrunn (1966) evaluated her outcomes from 17 years of practicing psychoanalysis and psychoanalytic therapy and published her results in the
American Journal of Psychotherapy. She claimed that 77 of 173 patients (i.e., 45%) improved; however, she excluded more than 80 patients seen for less than 20 sessions. When I read her paper a few months before becoming a licensed psychologist in California, I resolved to do something similar. That is the purpose of the present paper.
Throughout the 1950s and 1960s researchers were responding to the challenges posed by Eysenck and Levitt. In 1970 Meltzoff and Kornreich reviewed that research. They concluded that well-designed and controlled research had demonstrated very positive outcomes from psychotherapy. They also reviewed research on characteristics of patients and therapists that contribute to positive treatment outcomes, and on patient-therapist relationship variables that make a difference. Although their review provided encouragement to psychotherapists in all work settings, it did not reveal what kind of outcomes were obtained by therapists in private practice. It did not identify brief outcome measures suitable for repeated administrations to gauge patient change across time.
Seven years later
Smith and Glass (1977) introduced a
quantitative approach for performing literature reviews of controlled treatment-outcome studies on adults. They called it “meta-analysis.” Three years later Smith, Glass, and Miller (
1980) expanded and updated the previous review. Although many methodologists criticized their approach, many other psychologists (and researchers from many other disciplines) adopted and adapted meta-analysis for reviewing research findings. Many investigators have performed meta-analyses of controlled treatment-outcome research on psychotherapy for children and adolescents. In analyzing the findings from 27 meta-analyses of child, adolescent, and adult psychotherapy research, the mean and standard deviation effect size (ES) was 0.76 (0.24). 95% CI [0.66, 0.86] (
Abbass, Kisley, & Kroenke, 2009;
Anderson & Lambert, 1995;
Bratton, Ray, Rhine, & Jones, 2005;
Casey & Berman, 1985;
Driessen, Cuijpers, de Matt, Abbass, de Jonghe, & Dekker, 2010;
Erion, 2006;
Fossum, Handegard, Martinussen, & Morch, 2008;
Kazdin, Bass, Ayers, & Rodgers, 1990;
Leichsenring, Rabung, & Leiging, 2004;
Lewinsohn & Clarke, 1999;
Maughan, Christiansen, Jenson, Olympia, & Clark, 2005;
McCleod & Weisz, 2004;
Messer & Abbass, 2010;
Michael & Crowley, 2002;
Oei & Dingle, 2008; Olympia & Clark, 2005;
Peleikis & Dahl, 2005;
Reinecke, Ryan, & DuBois, 1998a,
1998b;
Shadish et al., 1997;
Shapiro & Shapiro, 1982;
Smith & Glass, 1977;
Smith et al., 1980;
Smith, Bartz, & Richards, 2007;
Stage & Quiroz, 1997;
Weisz, McCarty, & Valeri, 2006;
Weisz, Weiss, Alicke, & Klotz, 1987;
Weisz, Weiss, Han, Granger, & Morton, 1995). I have used meta-analytic techniques as one of my basic ways of expressing magnitude of change within and across the patients of my private practice. My results have consistently surpassed the mean ESs given in the reviews listed above.
The most common meta-analyses are reviews of the results of random controlled treatments or trials (RCTs) in which one or more groups of treated cases are compared to one or more control or contrast groups. In contrast, my meta-analyses have compared how a patient was functioning at intake to how much that patient has changed over time. Meta-analyses of such within-cases results have not appeared as frequently as those of RCTs, but they do exist. In analyzing the findings from 18 meta-analyses of within-patients-outcomes (pre-therapy versus post-therapy) research, the mean (SD) ES was 1.35 (0.39), 95% CI [1.16, 1.55] (
Burlingame, Fuhriman, & Mosier, 2003;
Clement, 2008;
de Maat, de Jonghe, Schoevers, & Dekker, 2009;
Driessen, Cuijpers de Maat, Abbass, de Jonghe, & Dekker, 2010;
Friedman, Cardemil, Uebelacker, Beevers, Chestnut, & Miller, 2005;
Hofman, Sawyer, Witt, & Oh, 2010;
Huber, Henrich, & Klug, 2005;
Kazdin & Whitley, 2006;
Leichsenring & Leibing, 2003;
Leichsenring, Rabung, & Leibing, 2004;
Maughan, Christiansen, Jenson, Olympia, & Clark, 2005;
Michael & Crowley, 2002;
Minami, Wampold, Serlin, Kircher, & Brown, 2007;
Norton & Philipp, 2008;
Oei & Dingle, 2008;
Stiles, Barkham, Connell, & Mellor-Clark, 2008;
Stiles, Barkham, Mellor-Clark, & Connell, 2008;
Stiles, Barkham, Twigg, Mellor-Clark, & Cooper, 2006).
A one-way ANOVA on the mean ES of the 28 reviews of RCT research listed above and the 18 reviews of within-cases studies produced the following results: F (1, 43) = 39.80, p = 1.299E −007. Published meta-analyses of mean ESs from RCTs have greatly underestimated how much a given patient improves during a course of psychotherapy.
Some of the meta-analyses carried out throughout the 1980s and early 1990s identified specific psychological treatments that were effective for treating particular disorders, for example, depression (
Dobson, 1989;
Steinbrueck, Maxwell, & Howard, 1983), generalized anxiety disorder (
Gould, Otto, Pollack, & Yap, 1997), obsessive-compulsive disorder (
Cox, Swinson, Morrison, & Lee, 1993;
Christensen, Hadzi-Pavlovic, Andrews, & Mattick, 1987). In response to such findings David Barlow, president of the American Psychological Association’s Division of Clinical Psychology, appointed a Task Force on Promotion and Dissemination of Psychological Procedures in 1993 (
Sanderson & Woody, 1995a,
1995b). During the ensuing years many journal articles and books identified, described, and provided treatment manuals for such empirically supported treatments. But there were many protests against these lists. For many years at the annual conventions of the American Psychological Association (APA) there were debates about the appropriateness of such lists.
Partly in response to these debates APA president Ron Levant created a Presidential Task Force on Evidence-Based Practice in 2005 to investigate the issues raised. That task force produced a report that ultimately became a policy statement of the association (
APA Presidential Task Force, 2006). The task force concluded, “Evidence-based practice requires that psychologists recognize the strengths and limitations of evidence obtained from different types of research. Research has shown that the treatment method. . . . the individual psychologist. . . . the treatment relationship . . . .and the patient . . . . are all vital contributors to the success of psychological practice” (p. 275). The report called for the collection of
effectiveness evidence to complement
efficacy results from randomize controlled trials (RCTs).
Unfortunately there is very little published effectiveness data gathered from the routine private practice of psychotherapy. References to “usual clinical care” have been misleading (e.g.,
Weisz, Jensen-Doss, & Hawley, 2006) because they overwhelmingly refer to findings from institutional settings, such as clinics, hospitals, and residential treatment centers. In contrast, according to the APA database on “Employment Characteristics of APA Members,” between 58% to 78% of psychologists who are employed full-time providing mental health services are in independent practice. In addition there are many more psychologists who are salaried by colleges, universities, hospitals, clinics, etc. who maintain part-time private practices. We know almost nothing about their treatment outcomes. The present article provides an exception.
Most of the exceptions that do exist involve
samples from an individual practice or from a group practice rather than presenting outcomes for all cases seen by an individual therapist or by a group of private practitioners. For example, Persons, Burns, and Perloff (
1988) gave their results from treating 70 depressed adult patients in private practice using cognitive therapy. Similarly,
Wise (2003) presented treatment outcomes for an intensive outpatient program with 225 patients.
There is another movement that complements empirically supported treatments and evidence-based practice. It is the call for
practice-based evidence. Mellor-Clark, Barkham, Connell, and Evans (1999) gave an early example. Their article introduced the Clinical Outcomes in Routine Evaluation (CORE) information management system as well as emphasized the importance of collecting practice-based evidence to complement that obtained through RCTs and other avenues. More recently Barkham, Hardy, and Mellor-Clark (
2010) edited a book calling for and demonstrating practice-based evidence. The present article is an example of practice-based evidence of the effectiveness of psychotherapy within a private practice.
Method
In general, I followed the methods described in several earlier articles (
Clement, 1996,
1999,
2011), in which I used a five-level Global Estimate of Outcome (GEO) score as follows: 1 ~ Much Worse at termination than at intake (i.e., the level of functioning was at least 50% worse than at intake), 2 ~ Worse at termination than at intake (i.e., the level of functioning was 11% to 49% worse than at intake), 3 ~ No Change since intake (i.e., the level of functioning at termination was within plus or minus 10% of what it had been at intake), 4 ~ Better than at intake (i.e., the level of functioning at termination was 11% to 49% better than at intake), and 5 ~ Much Better than at intake (i.e., the level of functioning at termination was 50% or better than at intake)(cf.,
Clement, 1994). When ESs were available I converted to GEO scores as follows: If ES = -1.50 or less, the GEO score was 1; if ES = -0.51 to -1.49, the GEO score was 2; if ES = -0.50 to +0.50, the GEO score was 3; if ES = +0.51 to +1.49, the GEO score was 4; and if ES = +1.50 or greater, the GEO score was 5 (cf.,
Clement, 1999,
2008,
2011).
In the fall of 1988 I began reviewing all closed cases and assigned a GEO score based on all materials within the folder. For some cases, particularly children, observational data facilitated making a quantitative judgment. For a majority of cases such observational data did not exist.
About 25 years ago I started using problem checklists to evaluate functioning at intake and at subsequent re-evaluations. Each checklist contains over 60 items. These checklists are available in
Clement (1999). The patient or the parent of a minor patient rates each problem using a 10-point Scale of Functioning (SOF): 10 = Excellent Functioning, 9 = Good Functioning, 8 = Slight Problem, 7 = Some Problem, 6 = Moderate Problem, 5 = Serious Problem, 4 = Major Problem, 3 = Unable to Function, 2 = In Some Danger of Hurting Self or Others, and 1 = In Persistent Danger of Hurting Self or Others. The mean (SD) number of items scored at intake has been 16.72 (11.13), 95% CI [15.58, 17.86], the median has been 14, and the range has been 1–62.
I also calculate a Global Assessment of Functioning (GAF) score at intake by determining the mean of the SOF scores, subtracting the standard deviation of the SOF scores for the patient from the mean, and multiplying the result by 10. This approach to determining the GAF score at intake uses the quantitative ratings of the patient as described in the preceding paragraph to determine level of functioning. The more common practice is for the therapist to make an impressionistic estimate of the patient’s level of functioning. Using my method the mean (SD) GAF score at intake across all cases has been 44.42 (12.84), 95% CI [43.73, 45.11], the median has been 45, and the range has been 2 to 85.
Therapist
I am a Caucasian male of Western European descent. I grew up on a small farm north of Seattle. I started my career in 1965 at the Division of Medical Psychology, UCLA Department of Psychiatry. In 1967 I joined the faculty of the Graduate School of Psychology, Fuller Theological Seminary. Given my rural origins, I have always had a bias toward identifying what works to solve a given kind of problem and toward obtaining empirical evidence regarding how much the phenomenon in question has changed. I do not identify with any of the brand-name psychotherapies, for example, psychodynamic, client-centered, behavioral, cognitive, cognitive-behavioral, Gestalt, etc. Part of my approach has been to lean on theoretical models that have been supported by empirical research. In this spirit I spent the first 23 years of my career doing controlled treatment outcome studies of psychotherapy with children. In late 1988 I left academia and shifted from part-time to full-time private practice. I have always been interested in measuring treatment outcomes within my private practice. I have affirmed the empirically oriented movements including empirically supported treatments, evidence-based practice, and now practice-based evidence.
Participants
From July 1966 through July 2011 I had 2,258 intakes to my private practice. Of these 201 came only for psychological assessment, 386 (18.76%) dropped out without receiving any identified intervention, 40 cases involved consultation without any intervention, 32 intervention cases had not yet produced outcome data, and 1,599 cases had produced outcome data.
Diagnoses
My career has spanned all editions of the
Diagnostic and Statistical Manual (DSM) of the American Psychiatric Association; however, originally I used
DSM-III-R (
American Psychiatric Association, 1987) to record diagnoses for patients seen during the first 22 years of my practice. Before performing the analyses for the present article I updated all diagnoses using
DSM-IV-TR (
American Psychiatric Association, 2000).
In decreasing order of frequency the most common diagnoses were as follows: dysthymic disorder (n = 468); adjustment disorders (n = 403); attention-deficit/hyperactivity disorder, combined or predominantly hyperactive/impulsive (326); oppositional defiant disorder (283); generalized anxiety disorder (239); partner relational problem (220); major depression (165); social phobia (141); attention-deficit/hyperactivity disorder, predominantly inattentive type (121); no diagnosis (101); specific phobia (87); obsessive-compulsive disorder (85); panic disorder with and without agoraphobia (68); separation anxiety disorder (54); acute stress disorder and posttraumatic stress disorder (48); parent-child relational problem (41); sibling relational problem and relational problem NOS (40); bipolar disorders (38); academic problems (36); anxiety disorders NOS (23); body dysmorphic, hypochondriasis, or somatoform disorder (20); sexual disorders (16); Tourette’s disorder (15); schizophrenias and schizoaffective disorder (13); and autistic disorder and pervasive developmental disorder NOS (10).
Of all patients seen I had recorded only one Axis I diagnosis for 66% of them, two Axis I diagnoses for 34%, three Axis I diagnoses for 13%, four Axis I diagnoses for 4%, and one Axis II diagnoses for 2.5%. I do not know how these numbers compare with trends in other life-span private practices.
Sessions per Case
Of the 1,599 treatment cases with outcome data the mean (SD) number of sessions per case was 18.82 (29.89), 95% CI [17.35, 20.29], the median was 10, and the range was 1-344. Three-quarters of my patients completed treatment within 20 sessions, and approximately 82% finished within 25 sessions; therefore, the majority of my practice has consisted of what the literature identifies as “short-term therapy” (e.g.,
Watkins, 2012).
Storage and Retrieval of Data
When I opened a new case, I entered essential data about the patient into an electronic database (Microsoft Access). The database includes fields for identifying information on the patient, diagnoses, level of functioning at intake, and treatment outcome scores as well as other facts. All patients ever seen by me in my private practice were included. I could retrieve information from the database by running a query on one or more fields, such as age, sex, or diagnosis. Similarly, I could arrange the retrieved information by giving a sort command, for example, to list patients by age from the youngest to the oldest. Before analyzing any quantitative data I pasted the query from Access into Microsoft Excel.
Statistical Analyses
I copied raw data from Excel and used the StatMost statistical software package (1994) to perform statistical analyses.
Cancellations and No-Shows
Although I did not track cancellations and no-shows during much of my career, I have done so since January 1999. The mean (SD) percentage of cancelled and broken appointments per week has been 15.97 (0.07), 95% CI [15.44, 16.51].
Results
Who Made Referrals to Me?
In descending order of frequency the following have been my sources of referrals: psychologists 23.85%, patients 18.96%, managed care companies 18.52%, miscellaneous sources 15.36%, physicians 8.13%, school personnel 4.57%, unknown sources 2.66%, clergy members 2.58%, family members of the patient 1.87%, health care providers other than those mentioned elsewhere in this paragraph 1.87%, attorneys 1.02%, friends of the patient 0.27, social workers 0.27%, and patient him/herself 0.09%.
How Did Outcome Vary by Therapist Estimate and by Patient (or Parent) Rating?
For more than half of the 45 years in question, I did not calculate ESs; therefore, the GEO scores from those years were based on my assessment of all information within each patient’s record. In addition, since I started determining ESs many patients have drifted away from therapy without completing a termination interview. Obtaining self-ratings from patients after they stopped coming to sessions has been very difficult, so that there are many cases for which I have had to determine the GEO scores without the benefit of the patient’s self-rating. Only about 35% of treated patient provided self-ratings at termination using the Scale of Functioning and one of my checklists. For these patients I followed the procedures for transforming an ES into a GEO score as described in the first paragraph of the Methods section above. I wondered who would evaluate my outcomes more favorably: Would I or the patients do so?
My estimates were the basis of GEO scores for 1,041 cases. The mean (SD) of these ratings was 3.78 (0.80), 95% CI [3.73, 3.83]. The patient’s or parents’ ratings using the SOF and subsequent ESs were the basis of GEO scores for 558 cases. The mean (SD) of these ratings was 4.43 (0.73), 95% CI [4.37, 4.49]. An analysis of variance on these data produced the following results: F (1, 1,597) = 260.14, p = 0.0000. Patients and parents rated the outcomes more positively than I did.
How Much Did Patients Improve?
Percent Improved
Out of all treated cases with outcome data 4 (0.25%) were Much Worse, 11 (0.69%) were Worse, 497 (31.08%) showed No Change from intake, 546 (34.15%) were Improved, and 541 (33.83%) were Much Improved, for an overall improvement rate of about 68%.
Global Estimate of Outcome (GEO) Score
The mean GEO (SD) score for 1,599 cases was 4.01 (0.84), 95% CI [3.97, 4.05], the median was 4.00, and the range was 1-5.
Effect Size
The mean (SD) ES for 558 cases at termination was 1.90 (1.61), 95% CI [1.77, 2.04], the median was 1.62, and the range was from −2.91 to + 15.22. Of all ESs 3.14% were negative.
How Did Outcomes Vary By Diagnosis?
Percent Improved
Table 1 shows outcome by diagnosis with the best outcomes listed toward the top of the table and the worst outcomes listed toward the bottom. The table only includes diagnoses with at least 10 cases. For this list Chi Square was 99.18 with 23
df, p = 0.0000.
Effect Size
Table 2 lists mean ES by diagnosis in descending order of effectiveness. The table only includes diagnoses with 10 or more cases. For this list
F (1, 464) = 1.38,
p = 0.1768.
How Did Outcomes Vary by Patient Age?
Percent Improved
In decreasing order of effectiveness the results were as follows: age 0.5 (6 months?)-5 years, 85.33% improved (n = 75); age 6 years-12years, 71.59% improved (n = 352); age 20 years-29 years, 70.11% (n = 174); age 30 years-39 years, 68.04% (n = 291); age 40 years-49 years, 65.61% (n = 253); age 60 years-88years 63.64% (n = 44); age 50 years-59 years 63.49% (n = 126); and age 13 years-19 years, 63.41% (n = 276). The Pearson correlation between the mid point of each age range and the percent improved was r = -0.68, n = 8, p = 0.0609.
Effect Size
The mean ESs in descending order of magnitude by age group were as follows: age 60 years–88 years, 2.55 (3.54), 95% CI [0.66, 4.44], n = 16; age 0.5–5 years, 2.34 (1.78), 95% CI [1.62, 3.06], n = 26; age 50 years–59 years, 2.09 (1.76), 95% CI [1.59, 2.60], n = 49; age 30 years–39 years, 2.05 (1.54), 95% CI [1.74, 2.35], n = 102; age 20 years–29 years, 1.96 (1.58), 95% CI [1.56, 2.36], n = 62; age 6 years 12 years, 1.83 (1.46), 95% CI [1.55, 2.10], n = 110; age 40 years–49 years, 1.75 (1.56), 95% CI [1.45, 2.05], n = 105; and age 13 years–19 years, 1.66 (1.29), 95% CI [1.40, 1.92], n = 99. The Pearson correlation between the mid point of each age range and the mean ES was r = 0.42, n = 8, p = 0.3010.
How Did Outcomes Vary by Sex of the Patient?
Percent Improved
Of female patients 68.76% improved (n = 653). Of all male patients 67.60 % improved (n = 929). Although this is a slight difference, it has held up across the decades.
Effect Size
For all female patients the mean ES was 1.94 (1.73), 95% CI [1.71, 2.16], n = 225. For all male patients the mean ES was 1.85 (1.15), 95% CI [1.69, 2.01], n = 354.
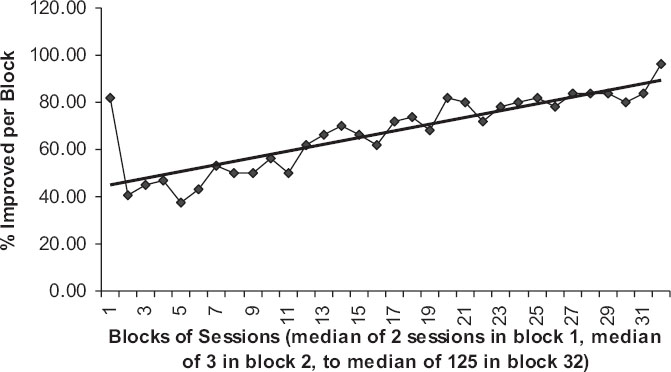
Was There a Relationship between Treatment Length and Outcome?
Percent Improved
To answer this I ordered all treatment cases from the least number of sessions to the most number of sessions. Then I identified blocks of adjacent sessions. The first six blocks contained 49 cases each. The remaining 26 blocks contained 50 cases each. The first block had only one or two sessions per case with a median of two. The second block had a median of three sessions. The final block had a median of 125 sessions. Then I calculated the mean % improved within each block.
Figure 1 presents the results in graphic form. The Pearson correlation between median sessions per block and percent improved was as follows:
r = 0.63,
n = 32,
p = 9.56E-05.
Effect Size
There was great variability in the improvement patients achieved with a given amount of therapy as measured by ES. The Pearson correlation of ES versus sessions-per-individual case was as follows: r = 0.00, n = 683. I did a second analysis similar to the one presented in the preceding paragraph. I created blocks of sessions from the fewest sessions to the most. The first eight blocks contained 28 entries. The remaining 17 blocks contained 27. The median number of sessions per block ranged from 3 for the first block to 115 for the last block on the right. Then I determined the mean ES within each of these 25 blocks. The Pearson correlation between median sessions and mean ES was as follows: r = 0.07, n = 25, p = 0.7339.
For some individual patients I obtained from two to five ESs across time. For such cases I determined the Spearman rank order correlation by comparing the order the ESs were obtained (i.e., first, second, etc.) with the magnitude of each ES within a patient (i.e., 1st = smallest ES, 2nd = next larger ES, etc.). The results were as follows: rSpearman = 0.63, n = 194, p = 5.42E-23.
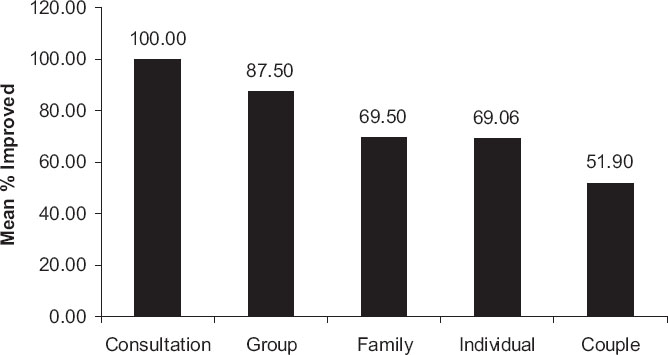
Was there a Relationship between Treatment Format (Modality) and Outcome?
Percent Improved
Figure 2 shows the mean percent improved for each of five treatment formats. A Chi Square performed on the depicted data was 18.24 with 4
df,
p = 0.001108.
ES. Sufficient data to analyze outcome by treatment format were only available for three formats. The mean ES for individual therapy was 2.00 (1.72), 95% CI [1.82, 2.17], n = 366. The mean ES for family therapy was 1.77 (1.41), 95% CI [1.56, 1.98], n = 172. The mean ES for couples therapy was 1.37 (1.34), 95% CI [0.96, 1.79], n = 42. An analysis of variance on these data produced the following results: F(2, 577) = 3.44, p = 0.0326.
Has My Therapeutic Effectiveness Changed over Time?
Percent improved
The Pearson correlation between mean percent improved and year of my career was as follows: r = -0.35, n = 45, p = 0.013. For the first 22 years of my career I maintained a part-time practice. For the more recent 23 years I shifted to full-time private practice. Given this fact I ran a Pearson correlation between the number of new cases opened per year versus the mean percent improved: r = -0.31, n = 45, p = 0.0391: the more cases seen in a given year, the poorer the outcome. I also determined the percentage of managed care cases seen each year and calculated a Pearson correlation between percentage of managed care cases and mean percent improved per year: r = -0.32, n = 45, p = 0.0319: the more managed care cases seen in a given year, the poorer the outcome. I computed the Pearson correlation between year of my career and percent of all cases that were children (12 years old and younger): r = -0.31, n = 45, p = 0.0375: as the years went by, a smaller proportion of my annual caseload consisted of children. Finally, I correlated percent improved each year versus percent of cases that were children each year: r = 0.51, n = 45, p = 0.0003: the greater the proportion of my annual caseload consisting of children, the better my outcomes.
Effect size
I have only had 10 or more ESs per year for the most recent 20 years. I ran a Pearson correlation between the year of my practice and the mean ES within each year. The result was as follows: r = -0.29, n = 20, p = 0.1661.