Although the retests were scheduled annually, the mean retest intervals among the LOSD patients were slightly longer than the corresponding retest intervals among the other groups. For example, the mean retest interval between MMSE 1 and MMSE 2 among LOSD patients was 17.2 (SD=9.8) months, whereas the intervals for the other groups were all between 12.6 and 13.0 months (all P<0.05). Please note, however, that because of these longer retest intervals, the LOSD patients had an even longer duration over which to manifest possible cognitive decline.
MMSE Changes
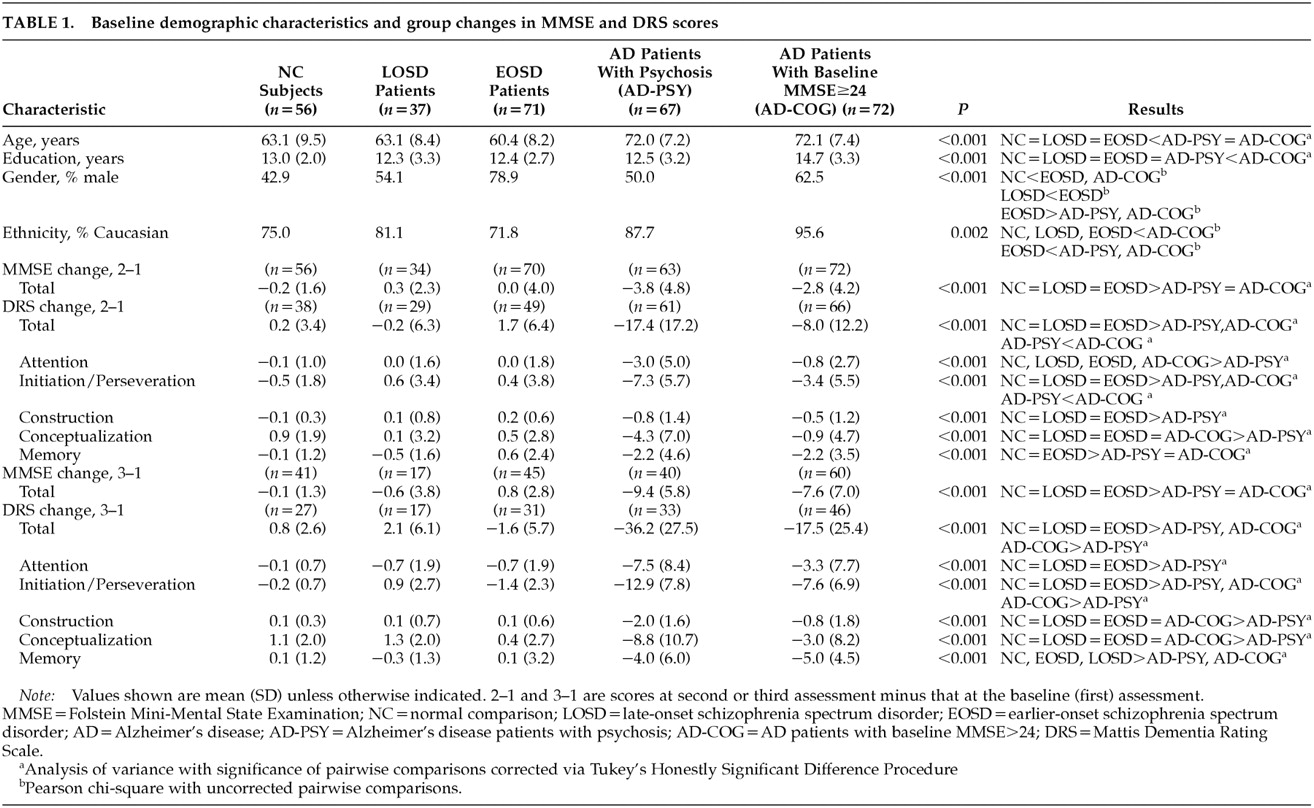
The repeated-measures ANOVA for MMSE scores at baseline (first) and second assessments (MMSE 1 and MMSE 2, respectively) showed significant group effects (F=129.63, df=4 , 289, P<0.001), significant time effects (F=33.00, df=1 , 290, P<0.001), and a significant group-by-time interaction (F=14.69, df=4 , 290, P<0.001). Age was not a significant covariate (F=0.20, df=1 , 289, P=0.659). Follow-up analyses of the group-by-time interaction with the planned pairwise repeated-measures ANOVAs revealed no significant group-by-time effects when LOSD patients were compared with NCs (F=1.65, df=1,88, P=0.203) or with EOSD patients (F=0.18, df=1 ,102 , P=0.673). In contrast, there were significant group-by-time effects comparing MMSE performance over time in the LOSD group relative to that in the AD-PSY group (F=22.16, df=1,95, P<0.001) and the AD-COG group (F=16.82, df=1 , 104, P<0.001), wherein each of the AD patient groups showed significantly greater declines in MMSE scores than did the LOSD patients. The AD-PSY patients' mean MMSE total score dropped from 18.6 (SD=4.9) at baseline to 14.8 (SD=5.6) at the next assessment, and the AD-COG patients' mean MMSE total score dropped from 25.7 (SD=1.3) to 22.9 (SD=4.3); whereas the corresponding values for LOSD patients were 27.2 (SD=2.4) at baseline and 27.6 (SD=2.2) at the next assessment. Similar results were observed when the groups were limited to subjects ages 60 to 69 years; that is, there was no decline from MMSE 1 to MMSE 2 among the NCs (n=22; mean [SD]: MMSE 1=29.0 [1.1], MMSE 2=29.0 [1.1]), the LOSD patients (n=13; MMSE 1=27.1 [2.5], MMSE 2=27.8 [1.3]), or the EOSD patients (n=28; MMSE 1=26.5 [3.0], MMSE 2=26.8 [3.0]). In contrast, among AD patients in this age group, there was a decline in both the AD-PSY group (n=16; MMSE 1 =19.6 [3.3], MMSE 2=14.9 [5.1]) and the AD-COG group (n=13; MMSE 1=25.6 [1.3], MMSE 2=21.9 [4.2]); repeated-measures ANOVA indicated that these differences represented a significant group-by-time interaction (F=12.35, df=4,87, P<0.001). Similar results were observed when the repeated-measures ANOVA was limited to subjects ages 70 to 79, wherein the mean (SD) MMSE 1 and MMSE 2 scores were 28.7 (1.1) and 28.2 (1.2) for the NCs (n=16); 27.7 (2.5) and 26.7 (2.7) among LOSD patients (n=9); 25.3 (3.7) and 25.4 (2.6) among EOSD patients (n=11); 18.4 (5.5) and 14.0 (5.9) among AD-PSY patients (n=33); and 25.9 (1.4) and 23.0 (4.6) among AD-COG patients. Again, the latter two differences represented a significant group-by-time interaction (F=4.29, df=4 , 109, P<0.003).
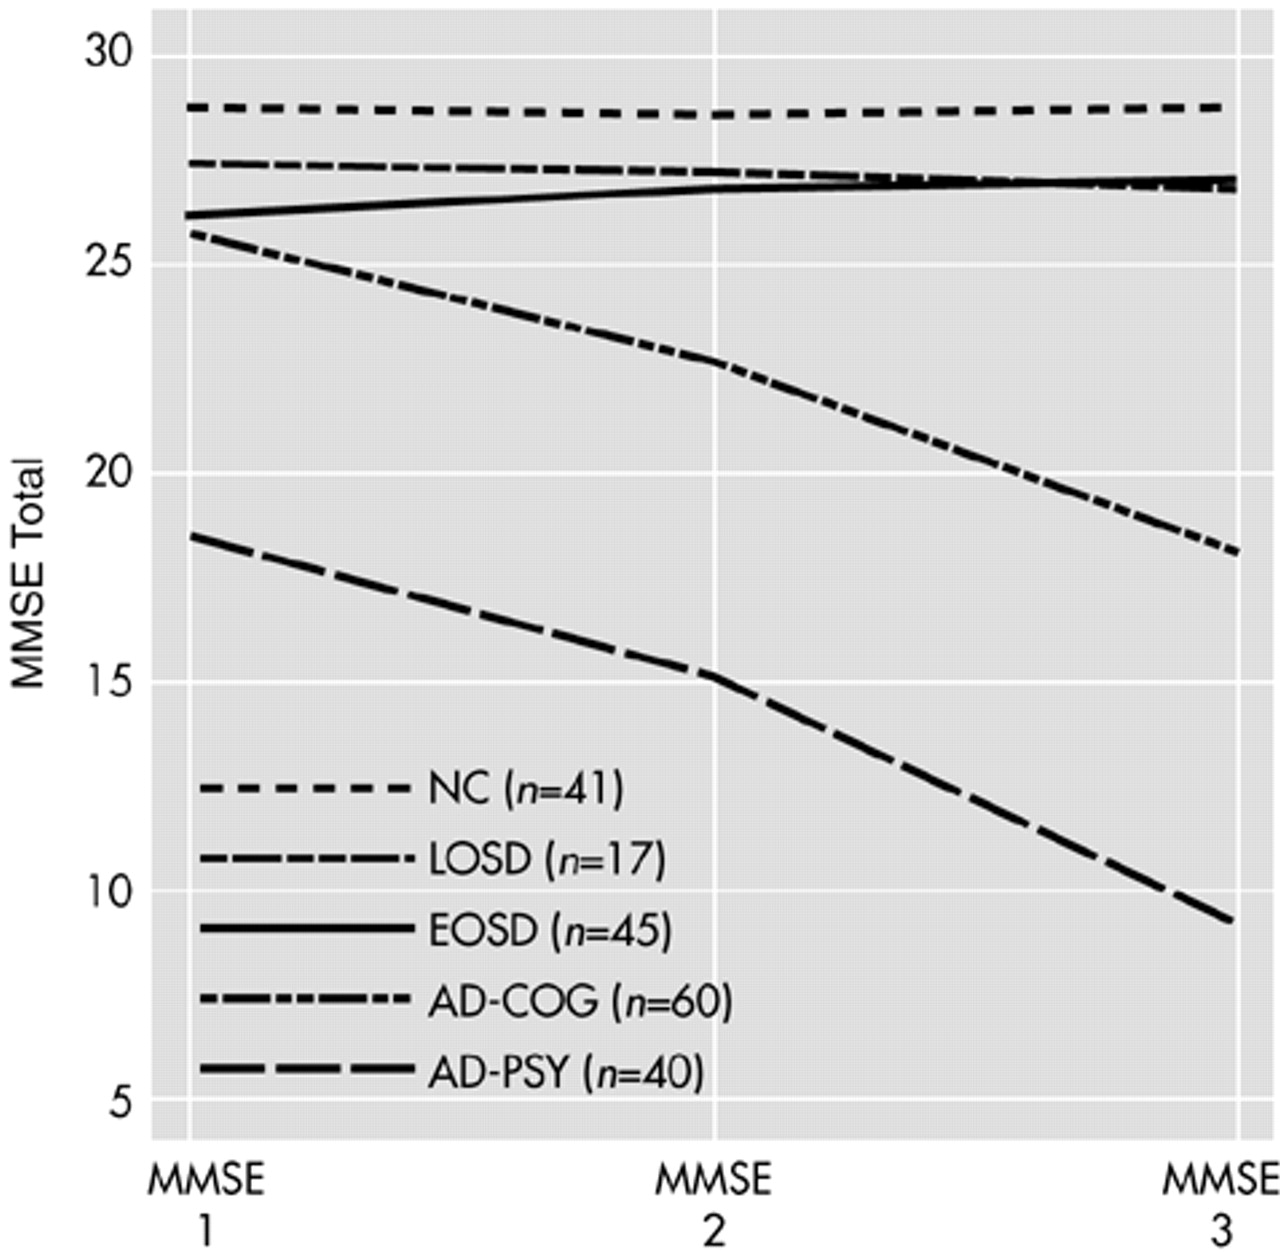
Repeated-measures ANOVA, with age as a covariate, using the MMSE data from those subjects in each of the five groups for whom we had MMSE data for three time points revealed a similar pattern, i.e., the overall repeated-measures ANOVA yielded significant group effects (
F=110.91, df=4 , 197,
P<0.001), significant time effects (
F=60.17, df=2 , 396,
P<0.001), and a significant group-by-time interaction (
F=29.41, df=8 , 396,
P<0.001). Again, age was not a significant covariate (
F=1.36, df=1 , 197,
P=0.245). Pairwise comparisons revealed no significant group-by-time interactions in comparing the LOSD patients with the NCs (
F=0.59, df=2 , 112,
P=0.555) or EOSD patients (
F=1.82, df=2 , 120,
P=167), whereas the AD-PSY and AD-COG groups showed significantly greater declines in MMSE performance relative to the LOSD (
F=23.65, df=2 , 110,
P<0.001, and
F=12.55, df=2 , 150,
P<0.001, respectively), as well as showing greater declines relative to the EOSD and NC groups (all
P<0.001). The changes from MMSE 1 through MMSE 3 are also illustrated in
Figure 1 for those subjects with all three data points.
To examine the possibility that the 17 LOSD patients with MMSE 3 data represented a biased subsample of the larger LOSD group, we also compared the characteristics of these 17 LOSD patients with all three MMSE assessments to the characteristics of the remainder of the LOSD patients. We found that the mean (and SD) change from MMSE 1 to MMSE 2 was a drop of 0.2 (2.3) points among the LOSD patients with MMSE 1, 2, and 3, versus a mean increase of 0.8 (2.3) points among those LOSD patients lacking MMSE 3 data. This difference was not significant (t=1.26, df=32, P=0.216). There were also no significant differences between these two groups in age (t=1.17, df=35, P=0.248), education (t=0.65, df=35, P=0.522), or baseline MMSE score (MMSE 1; t=–0.96, df=35, P=0.345). There was a trend toward a higher proportion of men among the LOSD patients with MMSE 3 data (70.6% vs. 40.0%, n=37; χ2=3.46, df=1, P=0.063).
DRS Changes
As with the MMSE results, analyses of the LOSD patients' DRS scores over time revealed no indication of cognitive decline. The repeated-measures ANOVA for DRS 1 to DRS 2 indicated the presence of significant group effects (F=90.80, df=4 , 237, P<0.001), significant time effects (F=38.36, df=1 , 238, P<0.001), and a significant group-by-time interaction (F=25.82, df=4 , 238, P<0.001). Age was not a significant covariate (F=0.44, df=1 , 237, P=0.509). Planned follow-up comparisons revealed a significant group-by-time interaction comparing longitudinal DRS performance among the LOSD patients relative to the AD-PSY patients (F=27.20, df=1,88, P<0.001), and to the AD-COG patients (F=10.61, df=1,93, P=0.002). Inspection of the mean (and SD) scores revealed that the mean DRS total score among the AD-PSY patients dropped from 103.8 (17.0) at DRS 1 to 86.5 (22.9) at DRS 2, and among the AD-COG patients it dropped from 120.1 (8.9) at DRS 1 to 112.0 (16.0), whereas the corresponding values for LOSD patients were 132.7 (10.8) and 132.5 (10.7). There were no significant group-by-time interactions when the LOSD patients' DRS performance was compared with that of the NCs (F=0.08, df=1,65, P=0.784) or the EOSD patients (F=1.54, df=1,76, P=0.219). Similar results were observed when the repeated-measures ANOVA was limited to subjects ages 60 to 69, wherein the mean (and SD) DRS 1 and DRS 2 total scores were 141.3 (2.3) and 141.3 (3.1) for NCs (n=18); 132.2 (16.0) and 131.8 (15.8) among LOSD patients (n=10); 134.2 (16.0) and 133.4 (9.0) among EOSD patients (n=22); 108.5 (9.9) and 86.4 (25.4) among AD-PSY patients (n=17); and 120.3 (8.0) and 111.2 (11.6) among AD-COG patients (n=11), which yielded a significant group-by-time interaction (F=10.66, df=4,73, P<0.001). Among those ages 70 to 79, the mean (and SD) DRS 1 and DRS 2 scores were 139.9 (3.1) and 140.5 (3.0) among the NCs (n=12); 132.7 (6.9) and 132.2 (7.3) among the LOSD patients (n=9); 123.0 (13.0) and 129.1 (7.6) among the EOSD patients (n=7); 100.0 (20.8) and 81.8 (23.8) among the AD-PSY patients (n=30); and 120.4 (9.5) and 111.5 (18.4) among the AD-COG patients (n=42), which represented a significant group-by-time interaction (F=8.92, df=4,95, P<0.001).
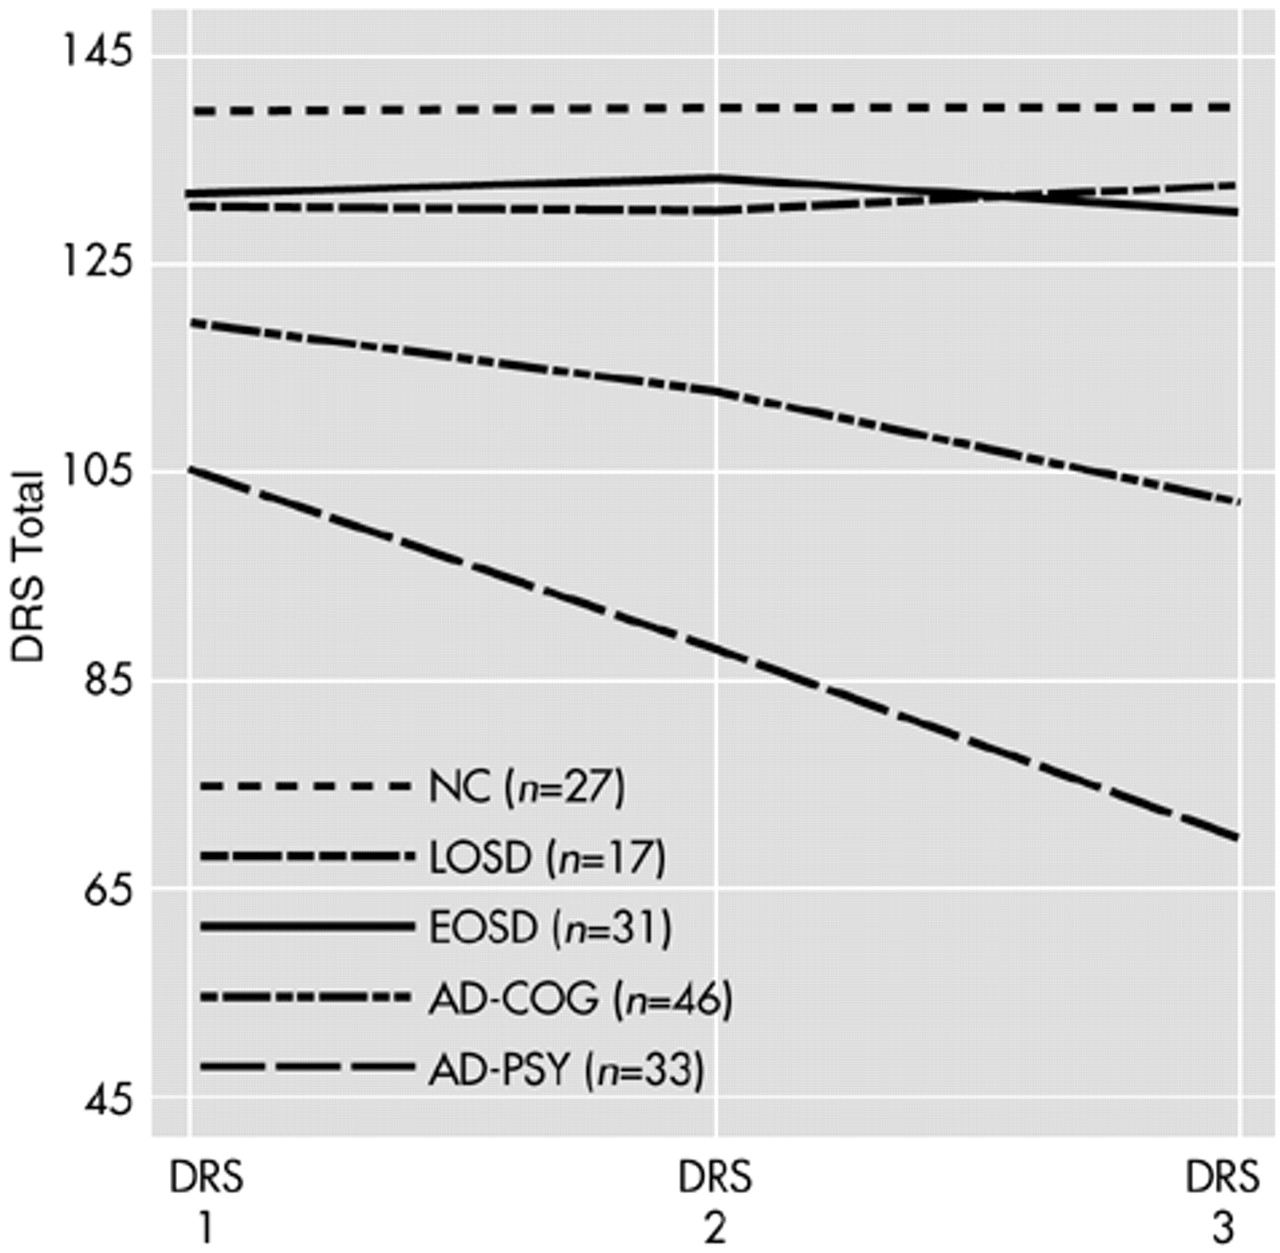
The mean DRS total scores for the subset of subjects with DRS assessments for each of the three time points (DRS 1, DRS 2, and DRS 3) are illustrated in
Figure 2. A repeated-measures ANOVA for DRS scores at these three time points revealed significant group effects (
F=63.03, df=4 , 148,
P<0.001), significant time effects (
F=31.73, df=2 , 298,
P<0.001), and a significant group-by-time interaction (
F=16.57, df=8 , 298,
P<0.001). Age was not a significant covariate (
F=0.84, df=1 , 148,
P=0.361). Paralleling the findings for the entire sample from DRS 1 to DRS 2, planned follow-up comparisons revealed that the significant group-by-time interaction was attributable to the consistent decline in DRS performance among the two AD groups, whereas there were no significant group-by-time interactions in comparing changes on the DRS among the LOSD patients relative to the NCs or the EOSD patients.


