Foci of high signal intensity on T2-weighted magnetic resonance imaging (MRI) in white matter are common findings in the brains of asymptomatic elderly individuals.
1–2 The corresponding appearance on computed tomography (CT) of extensive white matter hyperintensities (WMHs) is a periventricular lucency, referred to as leukoaraiosis.
3 White matter hyperintensities have been associated with cerebral ischemia, multiple sclerosis, hydrocephalus, trauma, inflammatory disease, radiation injury, amyloidosis, and other causes, and their etiology is varied.
4 Their pathology is similarly varied with reports of normal findings to complete infarction.
5–8The high frequency of WMHs in the elderly, with rates of nearly 90% being reported in some healthy samples,
9 has raised the issue of their functional relevance. Studies examining the effects of WMHs on cognition have not been consistent. When WMHs are extensive, patients are described as having frontal-subcortical patterns of cognitive deficits.
10 The neuropsychological deficits with less extensive WMHs are likely to be subtle, and a threshold effect has been argued.
11 White matter hyperintensities are commonly associated with stroke and risk factors of stroke such as age, arterial hypertension, cardiac disease, and diabetes mellitus.
12 However, the impact of WHMs on dementia remains open to dispute.
13Perfusion imaging with MRI is a new technique that combines the high resolution of MRI with the ability to measure regional cerebral blood volume (rCBV) and flow (rCBF).
19 It, therefore, enables the measurement of rCBV in individual WMHs irrespective of their size. In this study, we use perfusion imaging with MRI to examine rCBV in WMHs in stroke patients and comparison subjects. We set out to address the following questions: 1) Is rCBV abnormal in the regions of WMHs? 2) If yes, is this abnormality a feature of all WMHs, irrespective of their sizes? 3) In large WMHs, is there a gradient of rCBV, with the inner core being more ischemic? 4) Do WMHs have a penumbra of reduced rCBV? 5) Is the perfusion of WMHs in healthy subjects less abnormal than that of stroke patients, or are WMHs similar in their perfusion irrespective of the extent of cerebrovascular disease in an individual?
SUBJECTS AND METHODS
Subjects
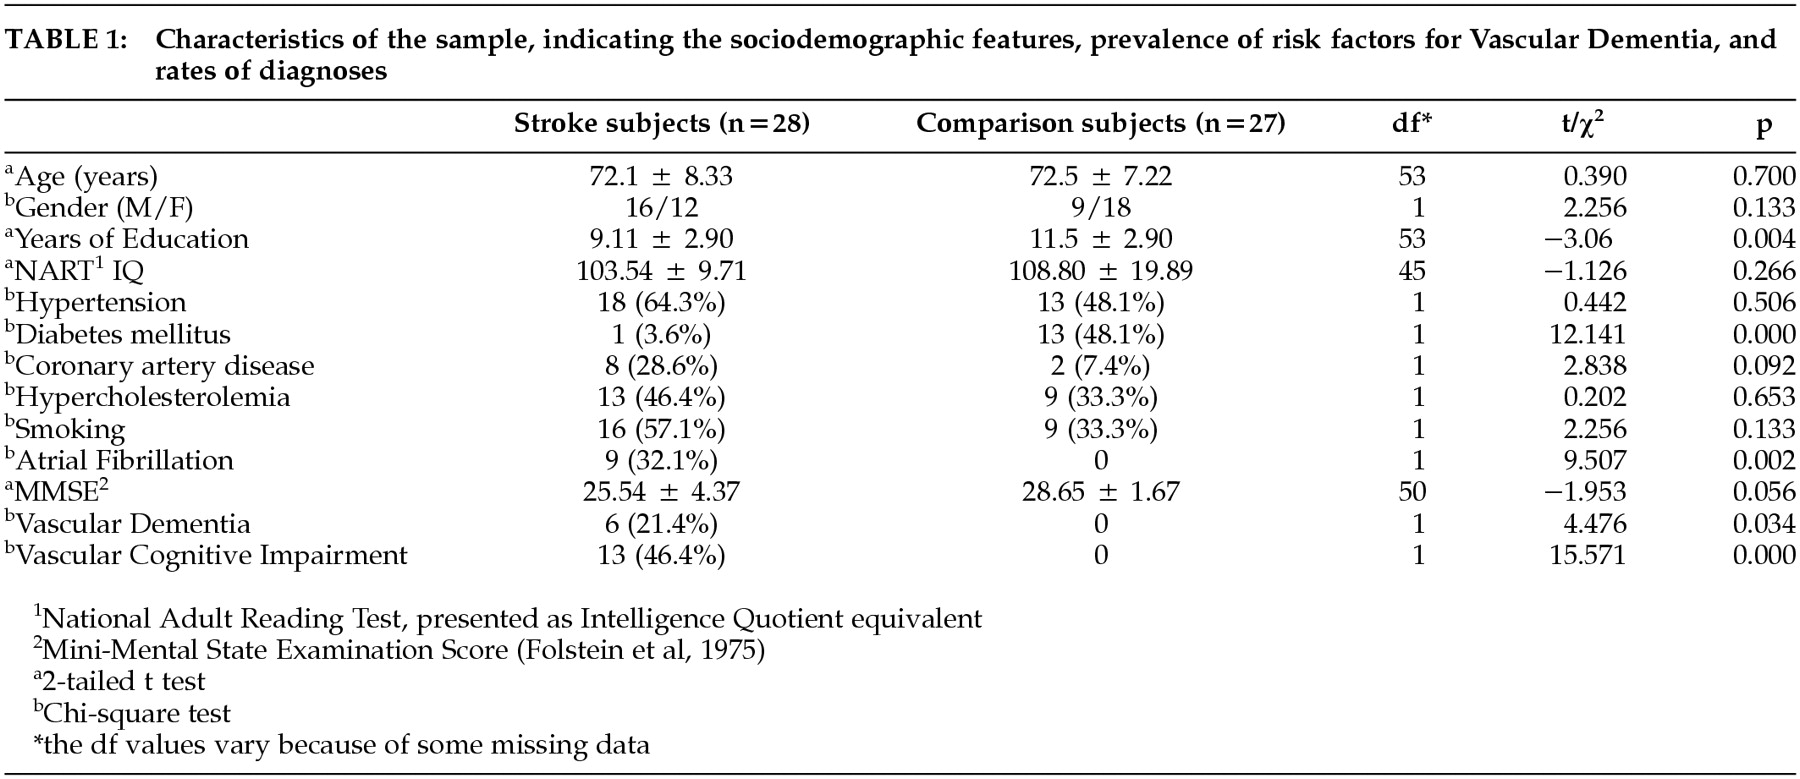
The sample comprised 28 stroke patients (mean age 72.1 years; male/female 16/12) and 27 healthy comparison subjects (mean age 72.5 years, male/female 9/18) matched for age. The stroke subjects were consecutive admissions to either of two teaching hospitals affiliated with the University of New South Wales who agreed to participate in the Sydney Stroke Study. Two independent neurologists made the diagnosis of acute ischemic stroke, and hemorrhagic strokes were excluded. Subjects were also excluded if they had persistent impairment of consciousness (> 7 days) or another neurological disorder. All subjects were required to have a good knowledge of English and give written informed consent for perfusion MRI. Comparison subjects were unpaid volunteers from the same neighborhood as the patients. The institutional ethics committee approved the study. The sociodemographic characteristics of the subjects are presented in
Table 1.
Patient Assessment Procedures
Subjects were recruited soon after admission to the hospital and a baseline assessment was performed. They were then examined 3 to 6 months later, at which point an MRI scan and a neuropsychological assessment were carried out.
Magnetic Resonance Imaging Scans
Magnetic resonance imaging scans were performed on a 1.5T SE Signa Echospeed scanner (GE Medical Systems, Milwaukee, WI, USA). Conventional MRI was performed using the following protocol: 1) a scout midsagittal cut for AC-PC plane alignment (2D, TR 300 msec, TE 14 msec; thickness 5 mm, NEX 1.5); 2) 1.5 mm thick T1-weighted contiguous coronal sections through whole brain using a FSPGR sequence and 3D acquisition (TR 14.3 msec, TE 5.4 msec); 3) 4 mm thick T2-weighted fluid attenuated inversion recovery (FLAIR) coronal slices through whole brain (TR 8900 msec, TE 145 msec, TI 2200 msec, FOV 25).
Perfusion Weighted Imaging (PWI) was performed with Gadolinium-DTPA (gadopentetate dimeglumine: Magnevist, Schering AG, Germany) as the contrast agent using a spin-echo echo-planar (SE-EPI) pulse sequence (TR 2200 msec, TE 80 msec) during the first pass of the bolus of contrast agent. The acquisition matrix was 128 × 128, with a field of view of 298 × 298 mm, and the slice thickness was 7.0 mm, with a between-slice gap of 2.5 mm. Forty volumes of dynamic images, with each volume covering 8 slices, were then obtained at a rate of 2.225 seconds between volumes. Slices covered the cerebrum parallel to the anterior commissure-posterior commissure line from the middle cranial fossa to the centrum semiovalis. The first four image sets were obtained before the injection of contrast to establish an unenhanced baseline. Because of the circulation time, most patients had at least an additional six unenhanced image sets. Contrast agent (0.2 mmol/kg of the body weight) was injected manually by an experienced radiologist (RS) at a rate of approximately 3–5 mL/s (total volume of 18 mL) as an IV bolus through a large bore intravenous cannula. This was then flushed with 20-ml saline.
Computation of rCBV
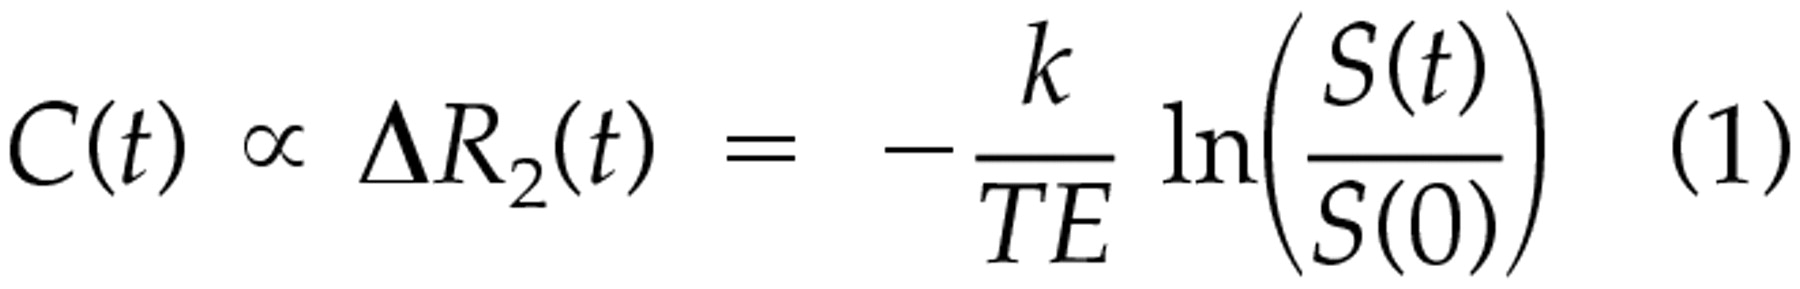
The raw T2-weighted echo-planar imaging (EPI) was transferred to a Windows NT workstation for processing. All software programs for postprocessing were developed in-house using C and Matlab. Perfusion weighted imaging employs contrast from extrinsic agents that are superimposed on intrinsic contrast between tissues. As in other imaging techniques, the concept of contrast in MRI relates to signal differences in the images. It is assumed that there is a linear relationship between paramagnetic contrast agent concentration and the change in transverse relaxation rate R2, and therefore the tracer concentration-time curves C(t). This is shown in the following equation:
k is the proportionality factor, and S(t) and S(0) are the signal intensities at time t and t = 0.
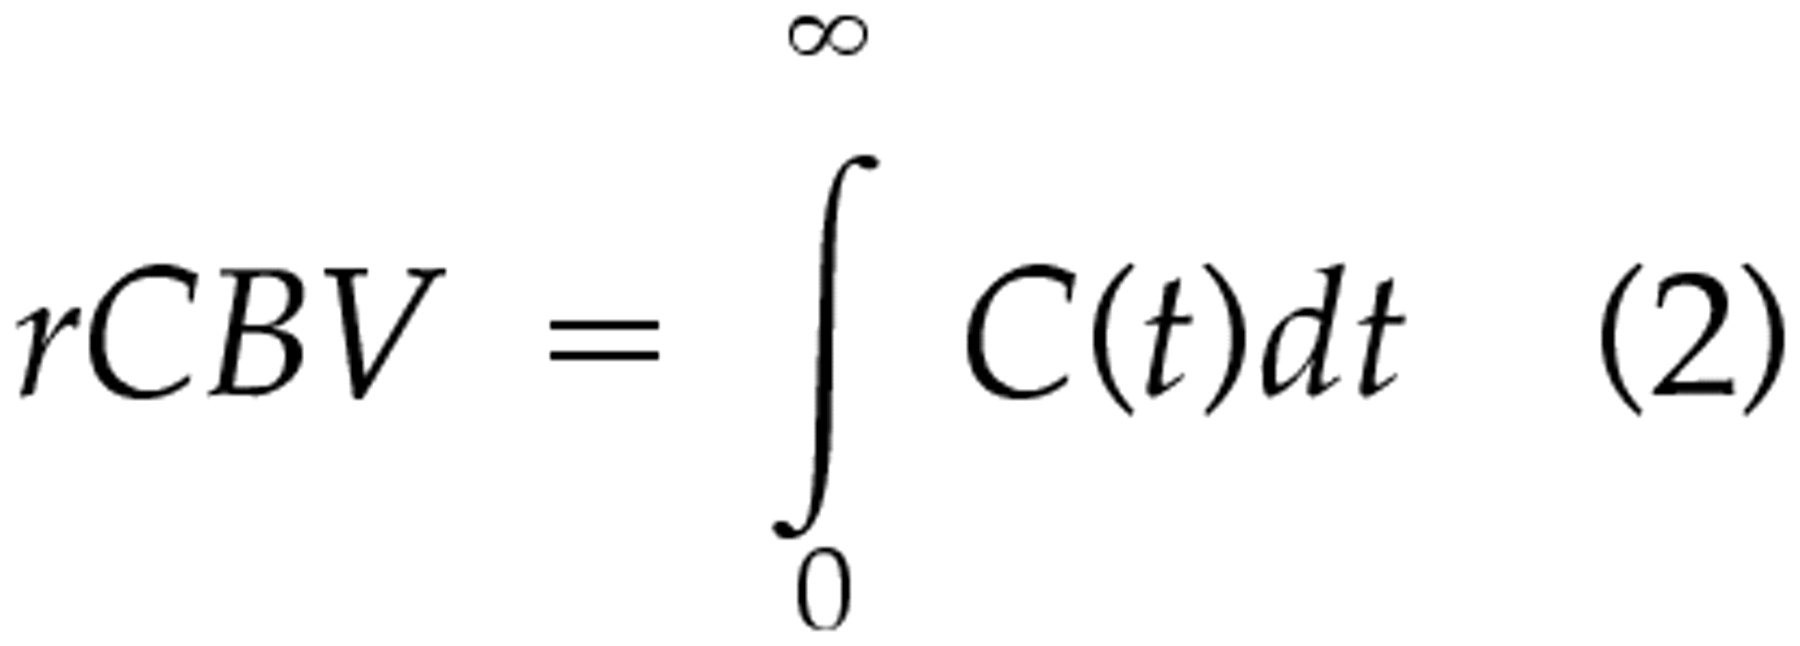
In the case of brain tissue with an intact blood brain barrier (BBB), the distribution space of common paramagnetic contrast agents is equal to the intravascular, extracellular space (i.e. the plasma volume). Relative CBV refers to the blood volume fraction of tissue and is commonly determined by integrating the area under the first-pass response of the concentration time curve:
However, to measure CBF and absolute CBV, we needed to deconvolve the measured tissue concentration-time curve with the observed arterial blood input function (AIF). Arterial blood input function can be measured directly with arterial blood sampling or determined from voxels of the same PWI or additional images around large vessels. Due to the partial volume effect of slice thickness and noise, accurate arterial sampling could not be determined. Only relative CBV was calculated.
The calculation of
C(
t) in Equation 2 is commonly achieved by parametric modeling of the data such as fitting a gamma-variate function. However, parametric modeling assumes a common pattern for the concentration-time relationship for all types of tissues involved in the calculation. Parametric modeling may fail to fit a particular type of curve for every voxel in the image as a result of low signal to noise ratio (SNR) and/or moderate to high degrees of tissue pathologies such as the white matter hyperintensity areas discussed in this paper. This is because a single parametric model is unable to fully describe both normal and pathological tissues. After examining the PWI data, we found that our SE-EPIs had low SNR. To accommodate WMH regions as well as normal tissues, we did not make prior assumptions on the pattern of the time series. Therefore, we applied a nonparametric linear regression method
20 on the time series to reduce the effect of noise.
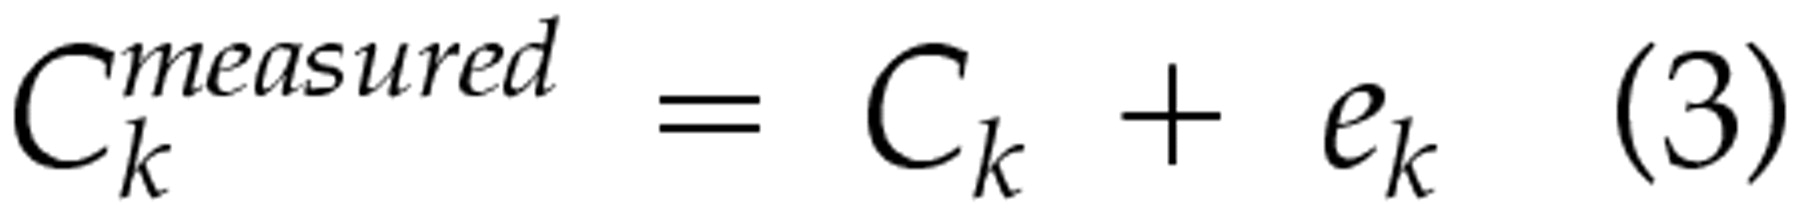
Let Cmeasuredk be the noisy version of an ideal continuous series C(t) measured at time tk = kT. We then have:
where ek, k = 1,2, …, n are uncorrelated random variables with zero mean and the same variance σ2.
We can estimate
C(
t) by Nadaraya-Watson estimator W̆(
t),
21 which is defined as W̆(
t) =
nk=1W̆
k(
t)
Cmeasuredk where W̆
k is defined as: W̆
k =
Wk(
t)/
nk=1W(
t) and we used a Gaussian kernel in this study for W̆
k.
The preprocessing of the images before calculating rCBV using Equation 2 includes:
a.
using masks generated from the image of each individual subject to remove nonbrain tissue voxels from calculation;
b.
replacing signal intensity values of brain tissue voxels with the nonparametric modeling results; and
c.
converting the non-parametric modeled signal intensity into tracer concentration using Equation 1.
Two non-parametric fitting examples, one on normal white matter and the other on WMH of the same scan, are shown in
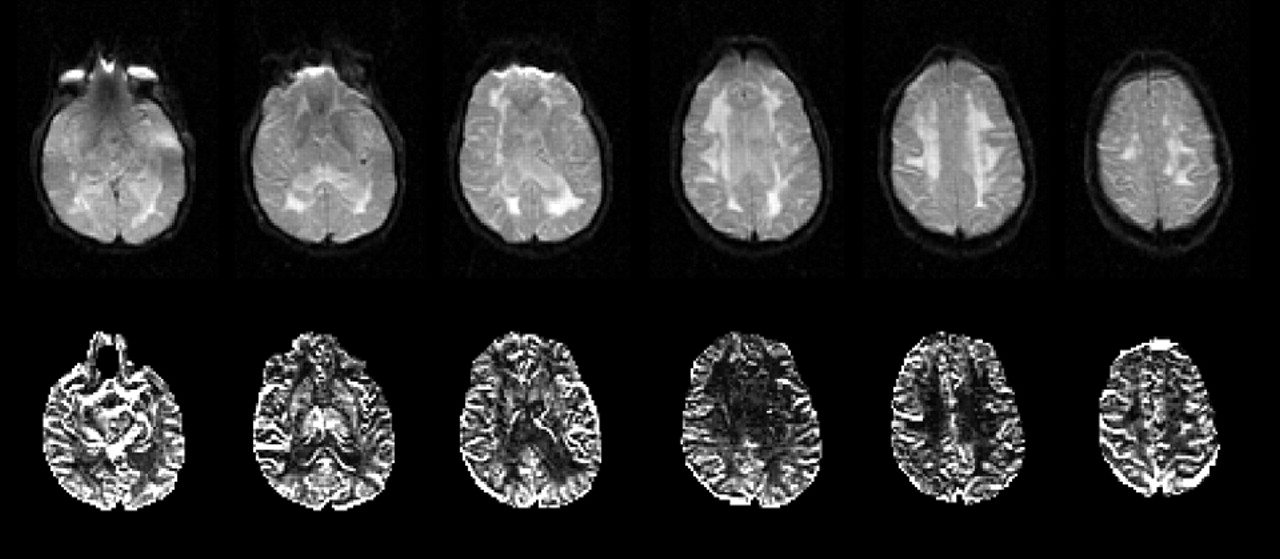
Figure 1, and some rCBV maps generated using this method are shown in
Figure 2.
Image Analysis
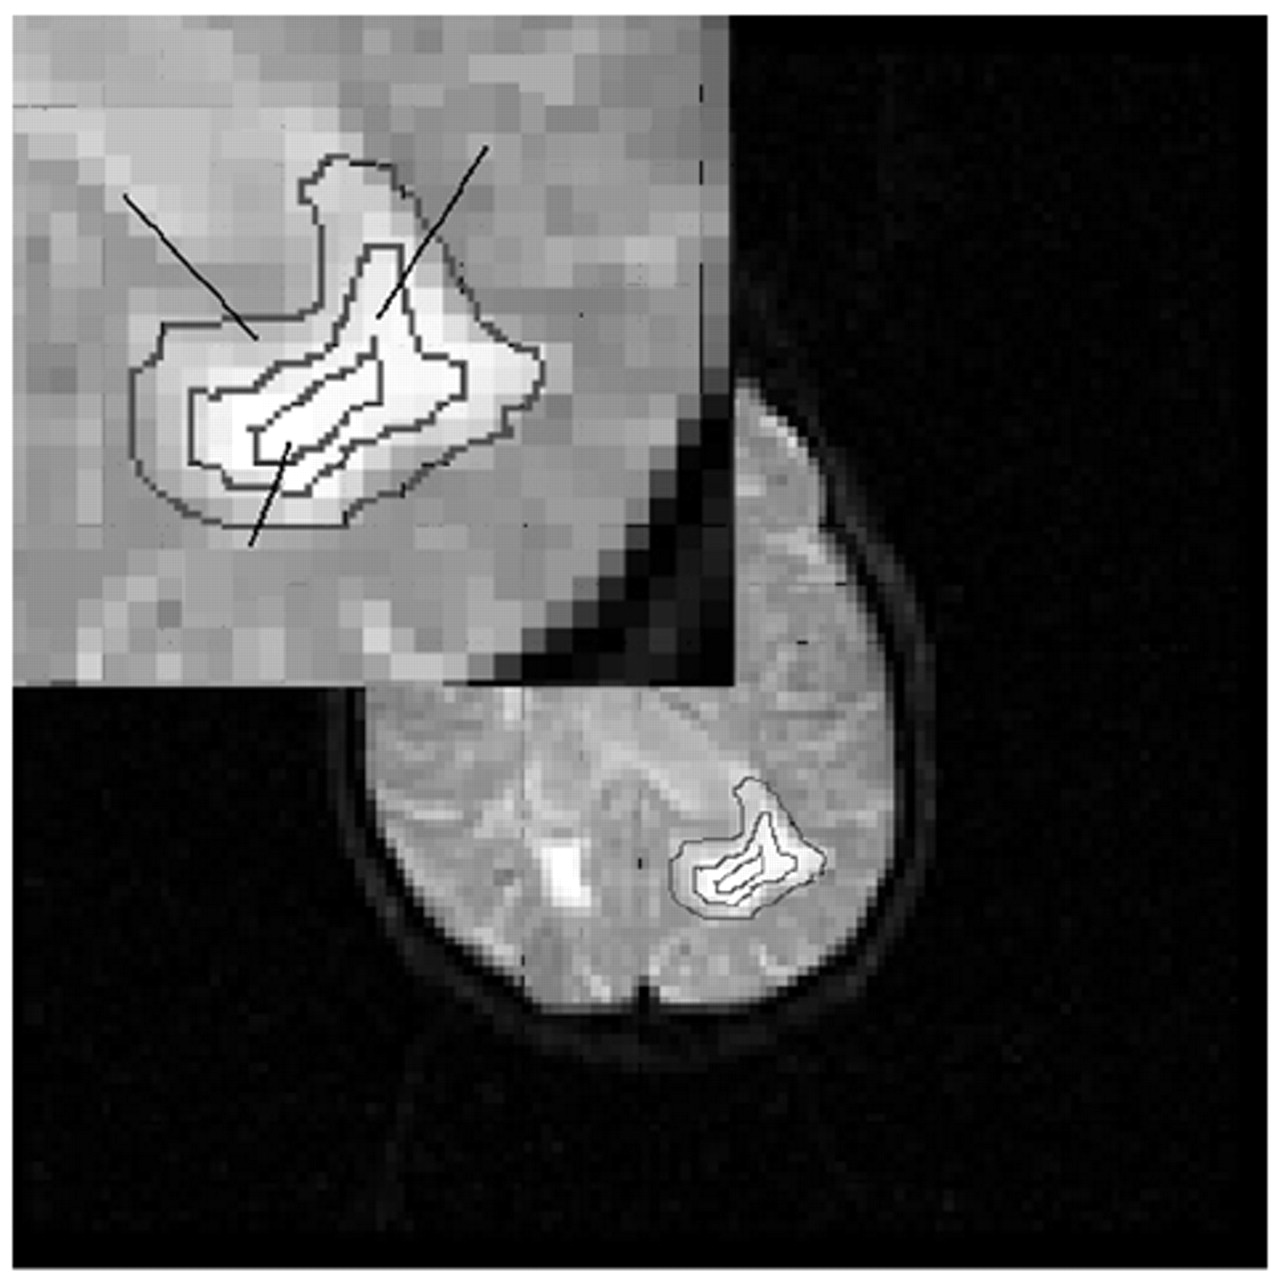
All rCBV images have been normalized for whole brain for global differences by using the mean value for all cerebral voxels as the denominator. We multiplied the normalized rCBV by 50 to make these values easier to appraise visually. The rCBV values are therefore presented in arbitrary units. Tracing of regions of interest (ROIs) was performed using the software package ANALYZE (Biomedical Imaging Resource, Mayo Clinic, Rochester, MN, USA). Regions of interest were obtained by manually tracing T2-weighted EPI axial slices. Two types of ROIs were traced: WMHs and the corresponding normal appearing white matter on the contralateral side of the same size (providing it did not have an abnormal signal), serving as a control ROI. Due to the relatively poor spatial resolution of EPIs (2.34 × 2.34 mm in-plane resolution), we visually examined the anatomical T1-weighted and FLAIR sequence MRIs of the same subject in order to reduce misidentification error. To examine the perfusion gradient in WMH areas, we subdivided large WMHs (>20 mm diameter) into three concentric rings of equal width, as shown in
Figure 3: core ring, inner ring, and outer ring. Smaller WMHs (5–20 mm) were not subdivided. More WMHs than control ROIs were traced because not all corresponding white matter on the contralateral sides of WMHs appeared normal to effectively trace a control ROI.
To check the validity of rCBV computation and analysis, we measured the mean rCBV of gray matter. The ROIs of gray matter were traced from a single slice that included the caudate, putamen. and globus pallidus (traced as a single ROI: basal ganglia), and thalamus. The gray matter rCBV was then calculated using the mean of rCBV measured from these ROIs.
Figure 4 shows an example of an axial EPI image on which the gray matter ROIs were traced and calculated. All statistical analyses were performed using the SPSS package (Version 11: SPSS Inc, Chicago, IL, USA).
RESULTS
The mean (SD) rCBV in the gray matter was 50.0 (3.8) arbitrary units, which was significantly greater in the comparison group (51.6 [2.8]) than in the stroke group (48.5 [4.0]) (t = −3.27, df = 53, p = 0.002). The mean (SD) rCBV in the white matter was 34.07 (6.82) (i.e., 69% of the gray matter). The rCBV in normal white matter was not different between stroke and comparison subjects.
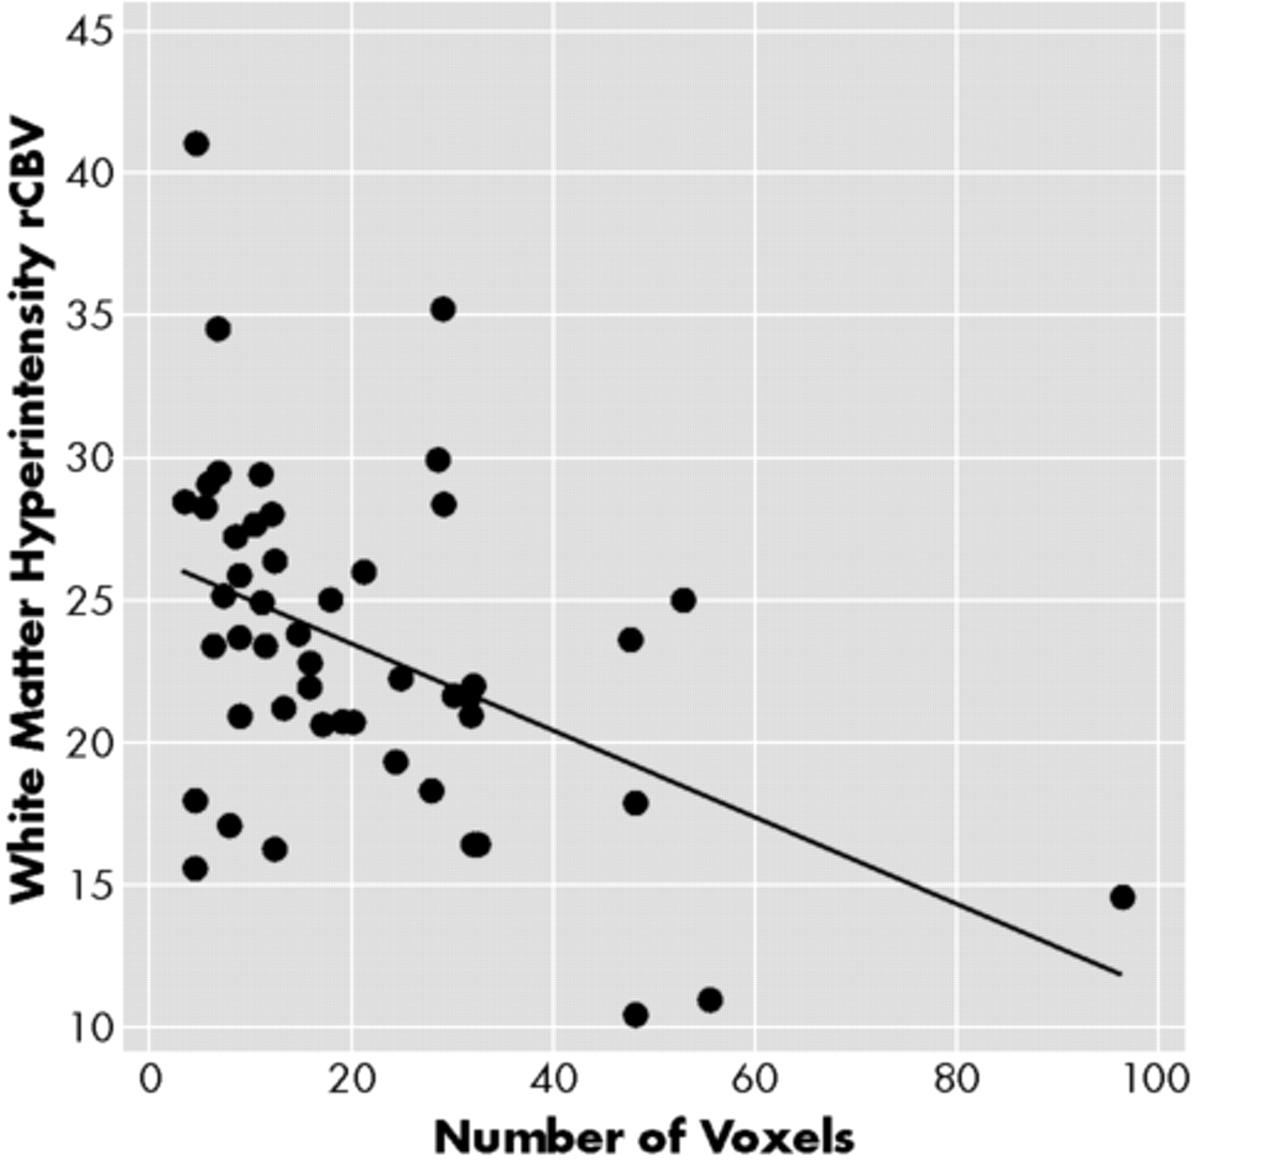
In all, 257 WMH ROIs (small WMH = 175; large WMH = 82) were identified in the subjects, which were at a rate of 6.9 per stroke patient and 2.3 per comparison subject. Forty nine of the 55 subjects subjects (27 stroke subjects, 22 comparison subjects) had small WMHs and 22 (16 stroke subjects, 6 comparison subjects) had large WMHs. Normal white matter ROIs were traced from the contralateral side of the WMHs among the 49 subjects. Since many subjects had multiple WMHs yielding nonindependent observations, the mean value of rCBV for each ROI for each was computed so that any subject contributed only one value in each comparison. The size of the WMHs was found to be significantly correlated with rCBV and Pearson's r = −0.455 (
n = 49
p = 0.001), as shown in
Figure 5. We compared the rCBV of various WMH regions between stroke and comparison groups using the general linear model (GLM) with ROI size as a covariate and found no significant difference in rCBV between these two groups. The differences of rCBV in normal white matter (WM), small WMH, and large WMH (mean) between the stroke and comparison groups were nonsignificant 3.1 (
F = 2.59;
p = 0.114), −1.0 (
F = 0.311;
p = 0.580), and −4.1 (
F = 2.62;
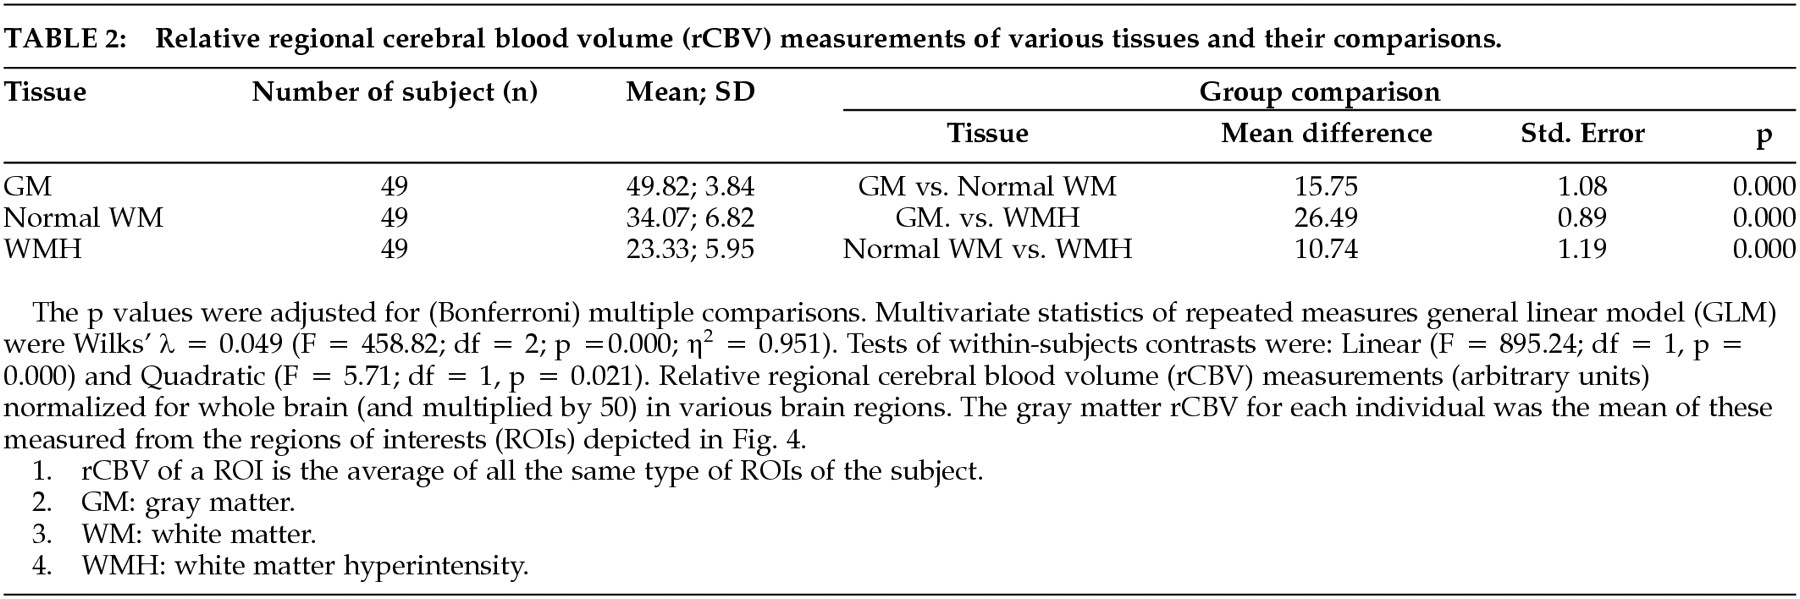
p = 0.122), respectively. Therefore, we pooled the rCBV of both groups in further analyses. A repeated measures general linear model was used for statistical analysis since the rCBVs of small WMH, three concentric areas of large WMH, gray matter, and normal WM of the same subject were not independent observations. Using this analysis, we found that the rCBVs in gray matter (49.82; 3.84), WMHs (23.33; 5.95), and contralateral ROIs were significantly different. (Wilks' λ = 0.049;
F = 458.82;
df = 2;
p = 0.000; η
2 = 0.951). This was true for WMHs of all sizes, irrespective of the subject group, as shown in
Table 2.
As stated above, 20 mm diameter was the cut-off between small and large WMHs. The mean size of the small WMHs was 30.5 pixels (72.0 mm
2) for stroke patients and 10.7 pixels (25.1 mm
2) for comparison subjects. The mean size of large WMHs was 100.0 pixels (235.0 mm
2) for patients and 67.3 (158.2 mm
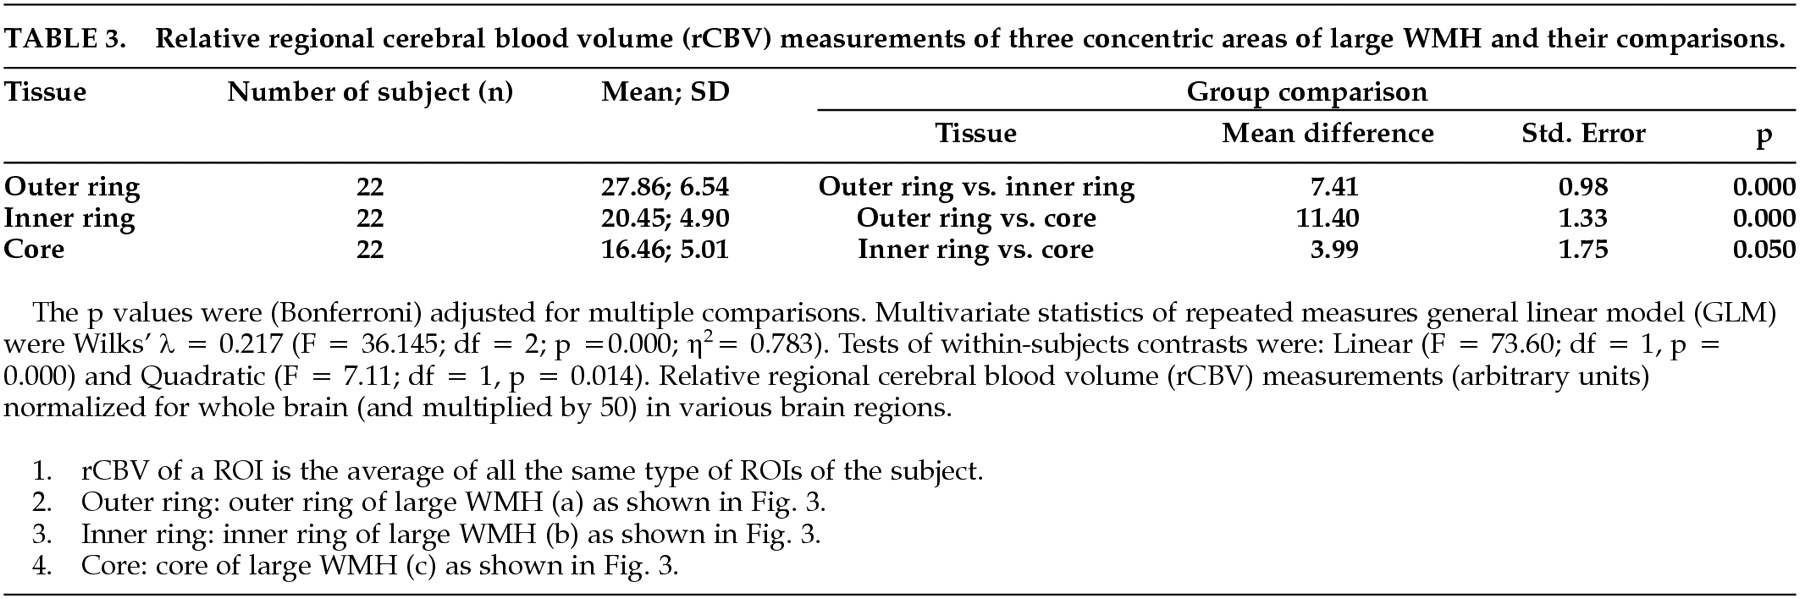
2) for comparison subjects. We examined the large WMH for a gradient of rCBV from the outer ring to the core. Using repeated measures general linear model for analysis, we found a significant increase in rCBV from the inner core to the outer ring (Wilks' λ = 0.217;
F = 36.15;
df = 2;
p = 0.000; η
2 = 0.783), while the mean rCBV of the outer ring (27.86; 6.54) was lower than the normal WM rCBV (34.07; 6.82), as shown in
Table 2 and
Table 3. The rCBV gradient for large WMHs was tested by examining linear (
F = 73.60;
df = 1,
p = 0.000) and quadratic contrasts (
F = 7.11;
df = 1,
p = 0.014). We observed change in rCBV levels across concentric areas and change from the outer ring to the inner ring was greater than that from the inner ring to the core, as indicated by the quadratic contrasts.
DISCUSSION
Exogenous contrast-based perfusion MRI is well suited for imaging hemodynamic perturbations in the microvasculature.
22 Because it is combined with a high resolution of MRI, exogenous contrast-based perfusion MRI is a technique that provides an ability to quantitate rCBV in small brain regions, in comparison with other functional neuroimaging techniques. This technique has been used to detect microvasculature deficits in ischemic brains and has been validated in animal models.
23 In this study, we measured relative rather than absolute rCBV. For the latter, measurement of the arterial input fraction is necessary, which we were unable to perform consistently in our subjects due to the following possible reasons: 1) Partial volume effect made an accurate delineation of the middle cerebral artery (MCA) difficult. 2) Location of the slices did not, in some cases, cover the MCA. Many studies have used a separate, additional pulse sequence to obtain the MCA in order to calculate AIF, which we did not. 3) We suspect that the high rates of pathology in these brains increased the inhomogeneity, thereby producing susceptibility artifacts. Since AIF could not be determined for many subjects, we chose to report only the relative rCBV data, which are meaningful in their own right. The gray/white matter ratio of rCBV suggests to us that the relative values obtained by us were biologically meaningful.
We found the white matter that appeared normal on MRI in stroke subjects had normal rCBV in comparison with healthy subjects. rCBV was reduced in regions of WMH, and this reduction was directly proportional to the size of the WMH. Within the larger WMHs, the core was the most ischemic region, with the outer ring approaching, but still being lower than, the rCBV in normal white matter. The level of rCBV abnormality in WMHs was similar, irrespective of whether the brain belonged to a stroke patient or an asymptomatic comparison subject.
These findings suggest that WMHs are regions of relative ischemia, but do not have an absolute absence of blood in the microvasculature. The measurement of rCBV in these regions assumes that the blood brain barrier is intact, an assumption supported by the observation that there was no difference between pre and postcontrast signal (ΔR
2) between patients and comparison subjects, as well as by previously published literature.
19,24 The presence of reduced rCBV in regions of WMH does not imply that ischemia is the primary mechanism for their development. While this has not been empirically established, it can be argued that a similar finding may be obtained from WMHs due to demyelination or other causes. In the absence of any other causes in our subjects, and the fact that changes in cerebral vasculature are common in the elderly, ischemia does appear to be the most likely cause for these changes.
Our results are not inconsistent with two previous studies of rCBF in patients with leukoaraiosis.
19,24 Markus et al
24 studied 8 patients with marked leukoaraiosis and found that rCBF was reduced in the white matter of patients, and the rCBV was also reduced, albeit nonsignificantly. These authors examined the white matter as a whole, and did not study nonconfluent WMHs individually, which may have reduced the power of their study to see differences in rCBV. In a more recent study,
19 the same group of authors examined rCBF in 21 patients with ischemic leukoaraiosis, and reported that CBF in WMHs in the centrum semiovale was reduced by 35%. The CBF in the normal-appearing WM of the centrum semiovale was not significantly different in patients from healthy comparison subjects. The CBF in the periventricular WM was however lower in the patients. We did not examine the rCBV differentially in the peri-ventricular and centrum semiovale regions in our subjects. In addition, the relative measurement of rCBV in our study should be contrasted with the absolute measurement of rCBF in the other two
19,24 studies. Previous studies using other imaging technologies, such as SPECT,
25 Xe-CT
17 and PET
14 have all concluded that rCBF is reduced in patients with leukoaraiosis. Our study, however, is the first to attempt to measure rCBV within small and large WMHs separately.
The etiology of WMHs is poorly understood, but a commonly held view is that they are ischemic in origin. The white matter is classically considered to be less vulnerable to ischemia than gray matter, but this relates to ischemia produced by large artery occlusion.
26 Recent work has shown that the white matter is in fact quite vulnerable to ischemic injury.
27 Moreover, the ischemic lesions seen commonly in elderly individuals are likely to be due to changes in the microvasculature rather than due to large vessel disease. The histopathology of WMHs has been examined in a number of studies and has been found to be quite variable.
28 Punctate WMHs show focal demyelination or perivascular tissue changes.
29,9 Midsized WMHs may be an extension of these changes and may represent early stages of gliosis.
7 Large and confluent WMHs contain areas of tissue necrosis surrounded by varying amounts of demyelination, gliosis, edema, and axonal disruption.
8 The pathology will vary depending upon the combination of processes involved in a particular subject. The arterioles in the white matter disease areas are noted to be sclerotic with fibrohyaline thickening.
30 In stroke patients, it is likely that some of these arterioles are occluded with consequent microinfarcts.
28 It is therefore understandable that the rCBV in these regions is decreased, and this is seen irrespective of whether subjects have a history of strokes or not.
There are several limitations to our study. Firstly, we measured relative rather than absolute rCBV but, as mentioned earlier, the aim of the study was to examine the relative hypoperfusion in specific brain regions. The gray/white matter rCBV ratio found in our study is 1.45. It differs slightly from the findings of Wenz et al
31 who also reported an age-dependent decline in rCBV of 6% per decade. A ratio of 2.1 was found for the normal subjects younger than 50 in their study and 1.9 for the ones over 50. The difference in our study possibly comes from two sources: the average age of the subjects in our study was 72 years, and we traced our gray matter ROI differently (see
Figure 4). We applied bands of equal width to the rims of axial slices to extract cortical areas, which inevitably consisted of both cortex and some white matter tissue.
Secondly, we did not measure rCBF that would have given us a more direct measure of perfusion. The rCBV measure, nevertheless, provided us with information about the microvasculature in these regions. Other authors
24 have demonstrated that changes in rCBF and rCBV do not parallel each other, and each can provide meaningful information. Thirdly, the large slice thickness of perfusion scans in comparison with the size of the WMHs may have resulted in a partial volume effect. We believe that this was likely to decrease rather than increase the likelihood of demonstrating a gradient of rCBV in the lesions. In tracing the contralateral regions of normal-appearing WM, we made certain that the trace was at least one voxel away from any hyperintensity. Fourthly, we measured relative rather than absolute rCBV. We have mentioned above the possible reasons for the inability to measure the AIF. We had initially planned to use MEDx (SGI version 3.1: Sensor Systems, Herndon, VA, USA) to compute rCBV, rCBF and MTT (mean transit time). However, we found that of the 55 scans, about half had failed to generate the satisfactory gamma-variate function fit despite a relatively clear mean signal intensity attenuation. The reasons for that may be the low signal-to-noise ratio in elderly subjects, and the presence of a high degree of pathological tissue such as WMHs.
In summary, this study has demonstrated that WMHs seen commonly in stroke patients and comparison elderly individuals are regions of reduced relative rCBV, which is proportional to the size of the lesions and has a gradient within the lesions themselves. It suggests that microvasculature is reduced in these lesions. The findings further support the functional significance of these lesions and their possible ischemic etiology.