Under capitation, a contractor is paid a fixed amount per year per enrollee to provide a prescribed set of services for a specified population(
1,
2). Several states have implemented or are considering implementing capitation for mental health services for children and adolescents eligible for Medicaid, including Arkansas, Arizona, Florida, Iowa, Massachusetts, Michigan, and Tennessee. Structuring capitation rates for this population has become a very important policy issue in these states (
3,
4,
5,
6).
In capitation arrangements, the concerns of both the enrollees (children and adolescents eligible for Medicaid) and the payer (Medicaid) include access to and quality of care, such as continuity of care. The payer is also concerned about the costs of contracting because of the limited Medicaid budget. On the other hand, a contractor's major concern is profitability or financial solvency. A contractor realizes a net profit when the average cost of services is lower than the capitation rate. Otherwise the contractor experiences a loss.
If a contractor realizes a net loss, it may reduce the number of services provided or change the types of services offered, both of which may have negative effects on access to and quality of care for the enrollees (
7). The contractor may opt to file for bankruptcy and cease to provide services, also negatively affecting access to and quality of care. Finally, the contractor may seek to raise the capitation rate, which increases the Medicaid budget. Therefore, ensuring a contractor's financial solvency is not only in the interest of the contractor, but also of the payer and the enrollees.
When multiple contractors are involved, some will have net profits while others will have net losses, creating a profit variation among the contractors. It is desirable to minimize this variation so that the negative effects on access, quality, and costs of care are limited. This study examined profit variations in multiple simulated scenarios of capitation of mental health services for children and adolescents eligible for Medicaid in Arkansas. Although the study looked at a single state, the results may provide guidance for policy makers in other states interested in structuring similar capitation arrangements.
Methods
Medicaid-eligible individuals under 21 years of age who used services in any of the 19 community mental health centers in Arkansas in 1994 were included in the study. Quantities of services were measured by the time (hours) consumed providing each service. Because information on cost in dollars for the services was not available, the average Medicaid reimbursement per hour was multiplied by the number of hours of a service to estimate the cost for the service. The total cost for a given individual was calculated by summing the costs of all the services incurred during the year.
Simulations were performed by altering three variables—number of capitation rates, number of contractors, and enrollment schemes. For the first variable, we examined one capitation rate versus two capitation rates. With one capitation rate, all the contractors would be paid the same rate per enrollee. With two rates, each contractor would be paid a higher rate for enrollees who are heavy users and a lower rate for normal users. Heavy users were defined as patients with annual costs at or above the 95th percentile of the cost distribution, and normal users were the remaining patients. For the second variable, we examined two, three, four, and five contractors, respectively.
For the third variable in the simulations, we examined enrollees' self-selection of providers, random assignment of enrollees to providers, and assignment of enrollees by geographic area. In self-selection, we assumed that the first contractor had 10 percent more heavy users than each of the other contractors. For example, when there were two contractors, the first contractor was assumed to have 55 percent of the heavy users and the other contractor 45 percent. In random assignment, patients were assigned randomly statewide among the contractors. In geographic assignment, patients were assigned to a contractor according to their county of residence.
To derive the capitation rate or rates, we assumed budget neutrality—that is, we assumed that the overall budget for capitation would have been equal to the actual Medicaid expenditures in 1994. Specifically, with one capitation rate, the rate was equal to the actual per-patient cost. With two capitation rates, the higher rate was equal to the actual per-patient cost of the heavy users, and the lower rate was equal to that of the normal users.
The profit of a contractor was the difference between the total revenue and total cost. Total revenue was the number of enrollees multiplied by the capitation rate. The number of heavy and normal users were multiplied by their respective capitation rates when the simulation involved two capitation rates. The total cost was the sum of the 1994 actual cost of services incurred by the contractor's enrollees. The profit ratio was equal to a contractor's profit divided by its total cost. The standard deviation of the profit ratios from all contractors measures the variation in profit and thus reflects the desirability of a simulated scenario.
Results
A total of 10,448 children and adolescents were identified who were Medicaid eligible and who used services in any of the 19 community mental health centers in Arkansas in 1994. A total of 59.9 percent were males, 59.7 percent were Caucasians, and 80.3 percent were between six and 17 years old. The most frequent diagnoses were attention deficit disorder (15.1 percent), oppositional defiant disorder (13.5 percent), conduct disorder (12.7 percent), and depression (12.1 percent). The majority of the patients (84.2 percent) had no reported comorbid psychiatric disorders, and only 1.7 percent had at least one comorbid psychiatric disorder.
The average annual per-person cost of services was $2,763, which was used as the capitation rate in scenarios with one capitation rate, based on the assumption of budget neutrality. Two-thirds (66 percent) of the costs were incurred by the heavy users, who averaged $36,226 per person per year and one-third was incurred by the normal users, who averaged $1,000 per person per year. These average costs were used as the capitation rates for heavy and normal users in scenarios with two capitation rates.
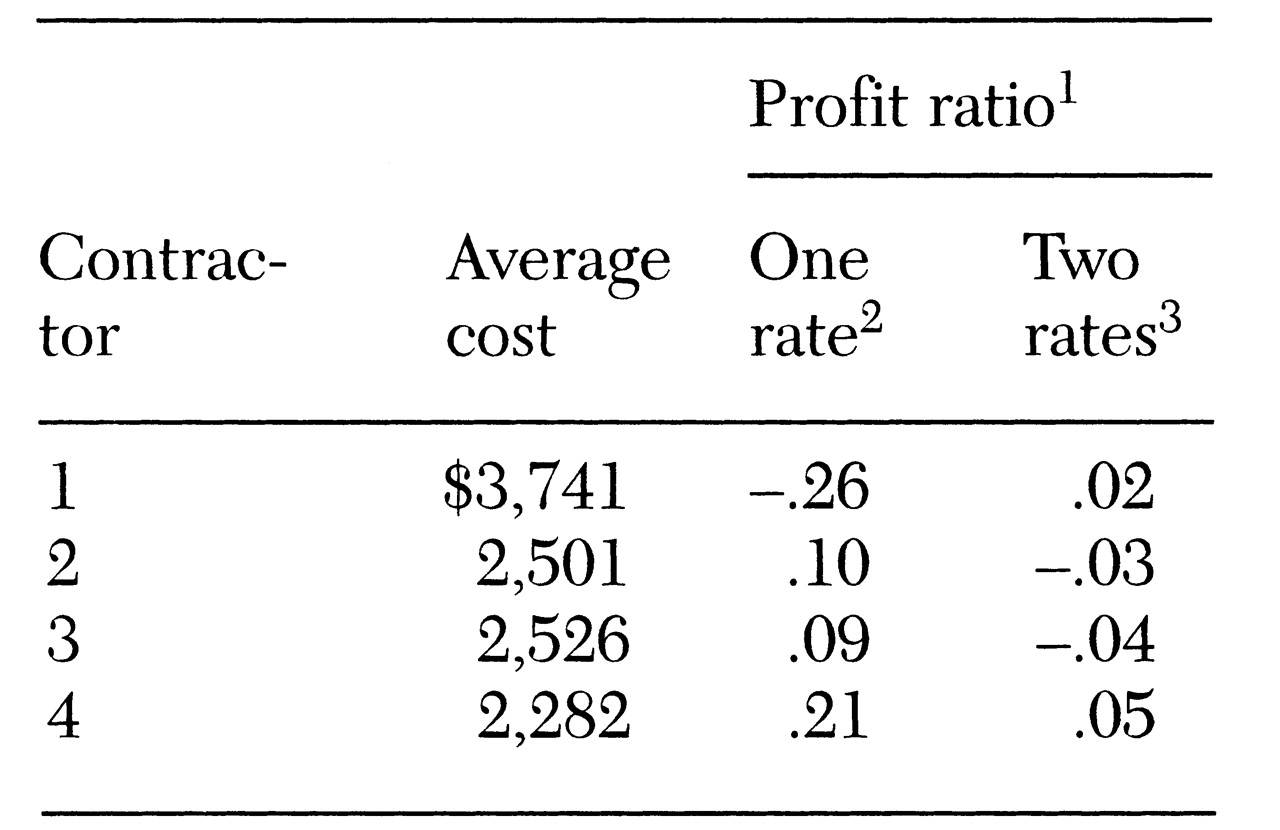
Table 1 presents costs and profit ratios for one specific scenario—four contractors and enrollees' self-selection of contractors. In this scenario, contractor 1 had an average cost of $3,741. Therefore, it had a -26 percent profit ratio, or a per-person average loss of $879, which was calculated by subtracting the $2,763 capitation rate from the $3,741 average. On the other hand, the other three contractors had net profit ratios of 9 percent to 21 percent. The standard deviation of the profit ratios was .21.
However, as
Table 1 shows, with two capitation rates the loss for contractor 1 was eliminated, and the profit ratios for the other three contractors were also reduced dramatically (ranging from -4 percent to 5 percent). The standard deviation of the profit ratios was reduced to .05.
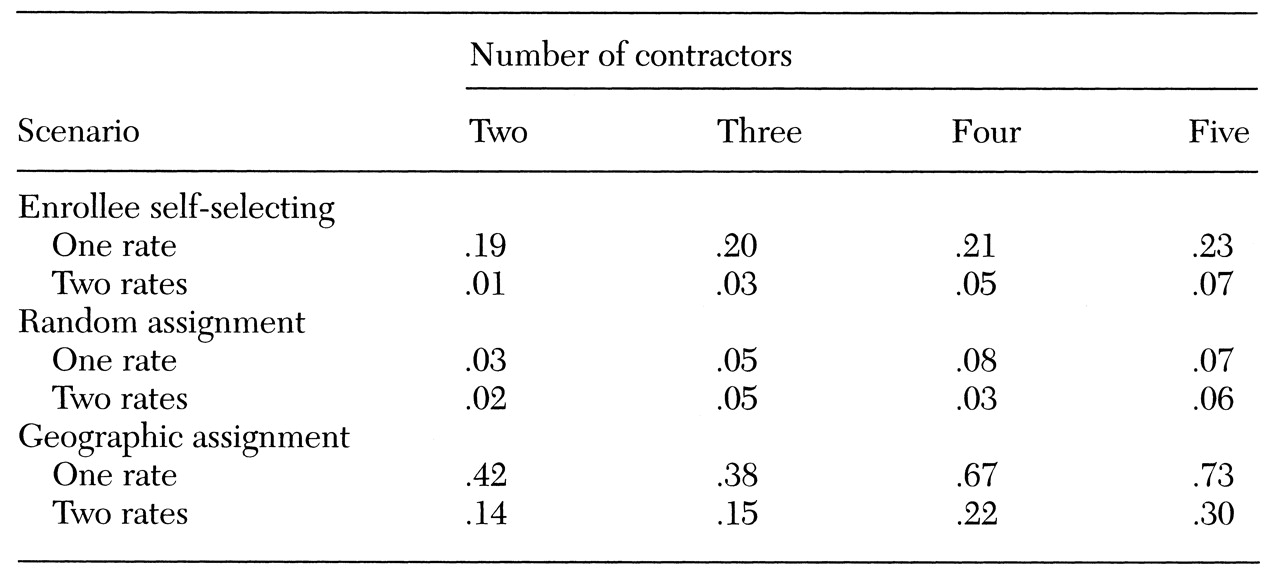
The simulation results for all other scenarios are summarized in
Table 2. With self-selection of contractors, the standard deviations of the profit ratios ranged from .19 to .23 under one capitation rate and were reduced to a range of .01 to .07 under two capitation rates. With random assignment, the profit variations were much smaller than with enrollees' self-selection. Geographic assignment led to the largest variations in profit ratios by far, with standard deviations of .42 to .73 under one capitation rate and of .14 to .30 under two capitation rates. In all these scenarios, profit variation increased with the number of contractors and the number of capitation rates.
Conclusions
The results indicated that financial risks for contractors were great in a capitation arrangement, especially with a large number of contractors or only one capitation rate. Profit variations were the largest when patients were enrolled by geographic area and the smallest when they were randomly assigned to contractors.
These results have several implications for policy makers interested in setting capitation rates. First, the number of contractors should be small, especially in states where the population under consideration is relatively small. In addition to the increased financial risks (profitability) shown in our results, a large number of contractors will mean high administrative costs for both the contractors and the payer. These administrative costs, which were not modeled in the simulations, include logistic costs to contractors of setting up facilities, as well as costs borne by the payer to monitor quality of care.
Second, random assignment should be adopted as the enrollment scheme whenever possible. We realize that enrolling by geographic area is attractive because of possible savings in administrative costs. Enrollee self-selection of contractors is also attractive because it gives patients a choice of providers and is probably politically most feasible. However, both of these schemes produce larger profit variations than random assignment.
Third, multiple capitation rates with case-mix adjustment should be applied, especially when pure random assignment is not feasible. In all the simulated scenarios, two rates performed better than one rate in reducing profit variations and thus in reducing financial risks. Therefore, efforts should be made to identify different groups of enrollees that have a different case mix and different patterns of service use.
Notwithstanding, this study has several limitations. First, some of the assumptions made in the simulations may represent an oversimplification of the reality of ever-changing health care systems. For example, the data used in the study were drawn from a fee-for-service system. With managed care, a patient's utilization patterns may change due to changes in provider behavior or restrictions of managed care. Such behavior changes were not modeled in the simulations. If managed care (capitation) changes the availability of services, variations in service use by geographic areas may disappear. Thus, enrollment by geographic area may be viable.
The second limitation of the study is that the data included only services rendered in community mental health centers. It is conceivable that Medicaid-eligible children and adolescents obtained services from other providers. Including these other services in the simulations may have changed the profit ratios. However, we believe that the qualitative conclusions still hold as long as contractors have different proportions of heavy users.
The third limitation is that the average reimbursement from Medicaid was used as a proxy of cost for a given type of service. As a result, the true costs of services may be underestimated or overestimated. Fourth, although random assignment produced the smallest profit variations, it may not be feasible in reality. Finally, identifying enrollees in different risk groups is a difficult task. Future research is needed to identify ways to adjust case mix that predict service use(
4,
5,
6,
8) in order to set different capitation rates in contracting services.
Acknowledgments
This study was funded by the Arkansas Division of Mental Health Services. The authors acknowledge additional support from the Arkansas State Medicaid Office, the Arkansas community mental health centers, Arkansas State Hospital, and Lavender & Wyatt. The authors thank Kim Heithoff, Sc.D., JoAnn Kirchner, M.D., Richard R. Owen, M.D., James Robbins, Ph.D., and Laura Tyler for helpful comments.


