Assessments
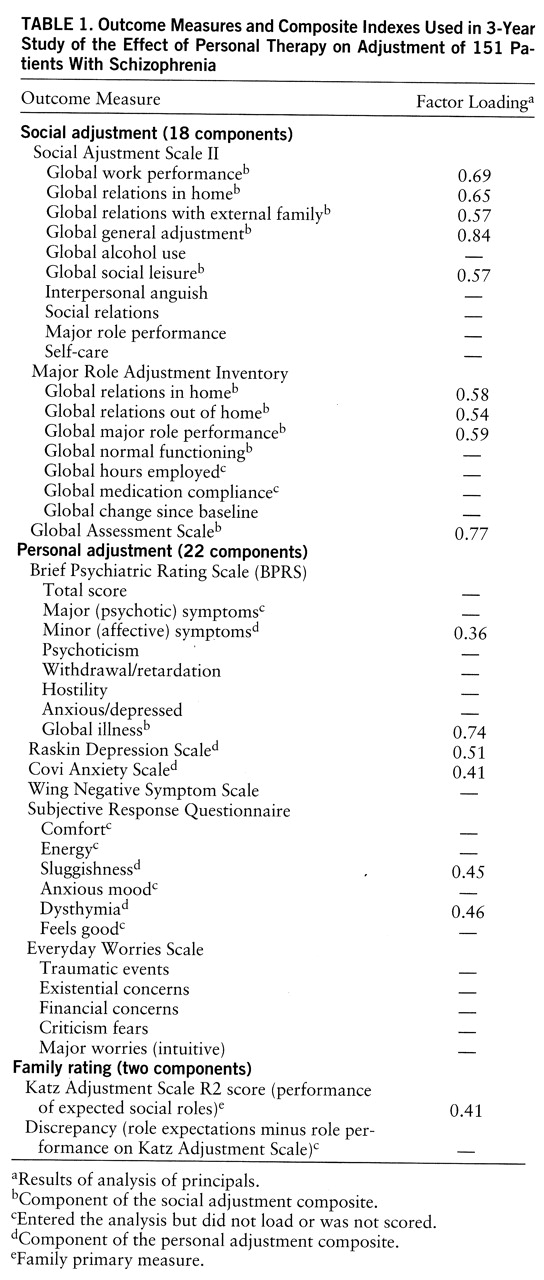
Table 1 lists the clinician, patient, and family rating instruments and their component subscales that were used to assess social adjustment (role performance), personal adjustment (symptoms), and family ratings among patients who participated in both trials. These assessments were completed at baseline and again at 6-month intervals over the 3 years of study. All measures of social adjustment were derived from standard scales and included the Global Assessment Scale (GAS) single score (
15), the seven global judgments from the Major Role Adjustment Inventory (
12), and the six global judgments and four factor scores from the Social Adjustment Scale II (
16). The Social Adjustment Scale II was the primary measure of social adjustment used to predict differential treatment effects. Unlike the other clinician assessments, which were based on a focused interview and observation, the Social Adjustment Scale II was completed following a structured interview with the patient and thus more closely represented the patients' own reports of the quality and quantity of instrumental and expressive role performance in the preceding 2 months.
Standard measures of personal adjustment provided by the treating clinicians included eight measures derived from the Brief Psychiatric Rating Scale (BPRS) (
17) as well as the total score on the Raskin Depression Scale (
18), the Covi Anxiety Scale (
19), and the Wing Negative Symptom Scale (
20). Two patient self-reports of personal adjustment included the six factors from the Subjective Response Questionnaire (
21) and five measures from a new instrument called the Everyday Worries Scale. The latter scale contained four factors and one intuitively constructed cluster that represented the most frequently endorsed patient worries. The factors were derived from a principal components analysis, with rotation, of 700 ratings obtained during the study. Loadings ranged from 0.35 to 0.65 across the 10 to 13 items contained in each factor.
The principal family ratings were derived from a standard scale that represented a relative's assessment of the patient's adjustment in trial 1—the Katz Adjustment Scale form R2, which rated the patient's performance of expected social roles (
22)—and a discrepancy score calculated as the difference between observed and expected role performance according to Katz scale scores. Another 16 family variables represented experimental measures designed for this study that were found not to yield consistent treatment effects in trial 1; these variables were excluded from further consideration. Although all treatments were patient centered, nearly all family variables represented attempts to detect indirect effects of treatment on family functioning and attitudes. The absence of consistent effects could have reflected the inability of treatment effects to generalize to family functioning, the questionable reliability and validity of these new measures, or both.
Finally, at the termination of the study, patients rated their levels of satisfaction with their respective treatment experiences.
Additional assessments were made either once, semiannually, annually, or monthly during the study. These assessments are more properly viewed as independent variables than as outcome measures and, therefore, are not included in the adjustment analyses. These ratings represented components of the treatment process (attempts to identify variables that might ultimately explain the relapse and adjustment outcomes) and included the practice principles applied and goals achieved; the patient's personality, intelligence, and locus of control; retrospective evaluations of developmental experiences; and a brief schedule of community stressors unique to patients who lived independent of family. These assessments will be the subject of a future, detailed analysis of the treatment process.
Ninety-seven percent of the clinician assessments of patients' adjustment were obtained while patients remained in the study, before early termination or successful completion of the protocol; approximately 86% of the patient assessments and 90% of the family assessments were also obtained while patients remained in the study. The number of patients available for the adjustment analyses that were common to both trials ranged from 150 patients at 6 months to 124 patients at 36 months for clinician ratings and from 131 to 111 patients for patient ratings. Since missing data were relatively few and not different among treatment conditions, only the data collected were analyzed. Among these completed assessments, only 11% of clinician ratings and 7% of patient ratings represented the assessment of subjects who were experiencing a recurrent schizophrenic episode (relapse) at the time of assessment, and there were no significant differences among treatment conditions at any rating period. The small number and equal distribution of relapse assessments among treatment conditions at each rating period ensures that the adjustment effects being measured were not redundant measures of the differential relapse rates reported in part I of this study (in this issue of the Journal).
Ongoing reliability checks were not made of the raters because of their cost, but the clinical raters had been trained and had a great deal of experience in the use of these standard scales. Attempts to further enhance reliability were undertaken through the process of random assignment, the consistency of the same clinical rater across periods for 140 of the 151 patients, and statistical attempts to develop more reliable measures such as the construction of composite indexes.
Composite Indexes
Faced with numerous, often intercorrelated, yet imperfect measures of personal and social adjustment, we sought a more reliable and hence more powerful test of these dimensions. The availability of a multivariately derived composite measure for each dimension of personal and social adjustment not only would aid in the understanding and interpretation of treatment effects but also would guard against the probability of inflating type I errors (overestimating positive effects), which often follow univariate testing of individual scale outcomes. The availability of such a composite measure would also militate against the need for Bonferroni correction of the univariate tests that could exaggerate type II errors (underestimating positive effects), a questionable approach to the initial test of a new treatment. A composite that was shown to be comprehensive, broad, and statistically different between the treatment conditions would lend legitimacy to the examination of the effects of the individual component measures and allow us to place greater confidence in the interpretation of these univariate tests as well. A composite that was shown to be narrowly defined yet significantly different between treatments would mean that there would be less need to examine the individual component measures.
From the 42 outcome variables shown in
table 1, 27 were selected for a factor analysis that broadly reflected the dimensions of interest from the perspectives of clinician, patient, and family raters. Given the number of variables entered, factor analysis at a single time period did not contain a sufficient number of cases for reliable factoring. Because it was inappropriate to pool data from the same patients at several (seven) time periods, correlations were computed for each period and then averaged as the basis for factoring. Global and total scores were most often selected for this factor analysis rather than the factor scores that were embodied in the global measures.
An analysis of principal factors yielded two composites that clearly reflected the personal and social adjustment dimensions. The first was a broadly defined social adjustment composite comprising 11 variables that were largely drawn from the Major Role Adjustment Inventory, Social Adjustment Scale II global scores, and the GAS; the factor loadings ranged from 0.54 to 0.84 (
table 1). (Although the global illness measure on the BPRS intuitively seemed to be a measure of personal adjustment and is listed under personal adjustment in
table 1, it loaded highly on the social adjustment composite and was scored accordingly.)
The second factor represented a more narrowly defined personal adjustment composite comprising five variables with loadings from 0.36 to 0.51. This factor included the BPRS minor (affective) symptoms, factors from the patient's Subjective Response Questionnaire (sluggishness and dysthymia), and total scores on the Covi Anxiety Scale and the Raskin Depression Scale. Other Subjective Response Questionnaire factors also loaded on this composite but were not included because of unwanted redundancy and oversampling of the scale.
The family rating of the patient's performance of expected social roles (Katz Adjustment Scale form R2), while split loading on the social adjustment composite, was also identified as a separate dimension of singular importance in the interpretation of patient role performance from the perspective of family members. (The discrepancy measure was excluded because of its high correlation with the Katz Adjustment Scale R2 score.) The decision to test the Katz Adjustment Scale R2 score itself rather than include it in the social adjustment composite was influenced by the fact that its absence in trial 2 (and therefore in the combined trials analyses) would render comparisons of the composite across trials more equivocal.
Analyses
Cross-sectional analysis. Following a traditional approach (
23,
24), we used regression analyses to perform the repeated analyses of covariance on the dependent variables that were assessed at each semiannual period over the 3 years of treatment. The initial assessment of a variable (most often an intake evaluation) served as the covariate for each of the semiannual analyses of the variable. Given the random assignment design, this approach was chosen not only as a way to adjust posttreatment means for random initial differences but also as a way to control for the influence of other independent variables on outcome and to reduce error variance. Performing a general linear model of analysis, with covariates, by way of regression allowed precise control of the order in which we evaluated effects: first the main effects of treatment, controlling for the initial level covariate, followed by the test of a possible interaction between personal or family therapy and the dichotomized independent variables of gender, age (≤30 or >30), race (Caucasian or African American), chronicity (age ≤23 or >23 at first psychosis), and, in trial 1, a rating of household expressed emotion (high or low). Controlling for main effects, we considered only the simple interaction between a treatment condition and an independent variable and ignored the effects of higher-order interactions because of the ambiguity associated with their interpretation.
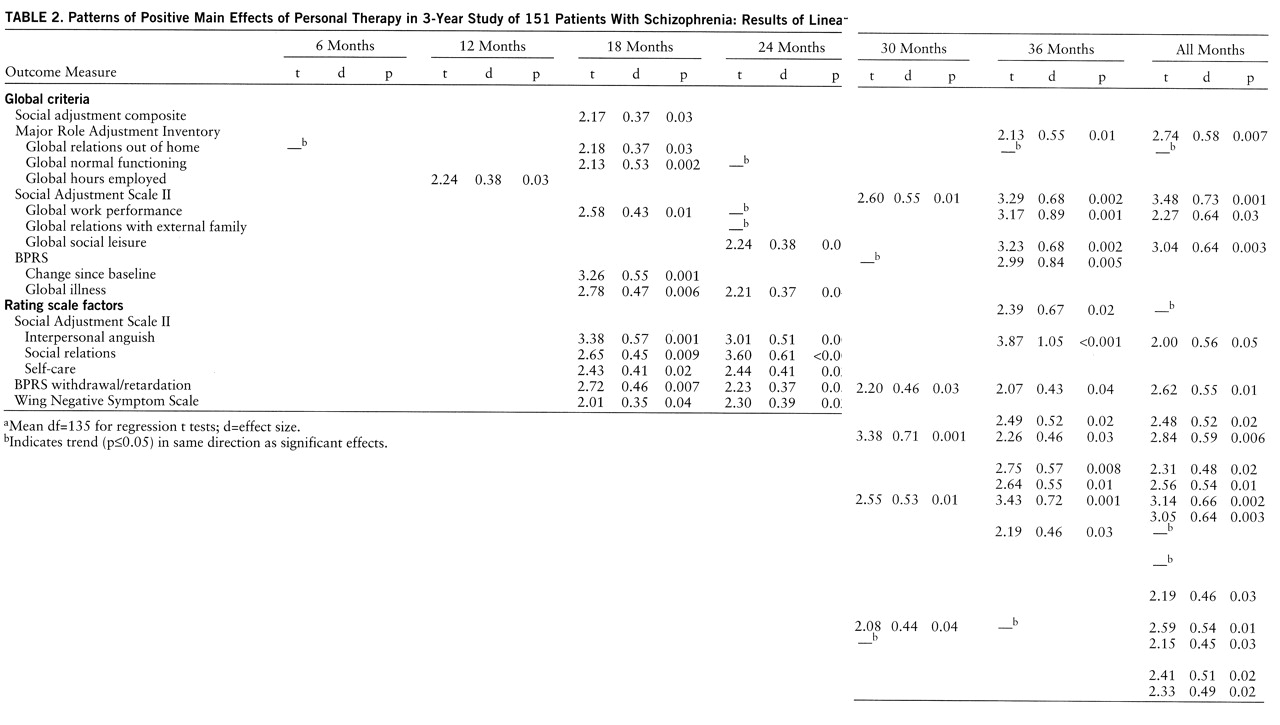
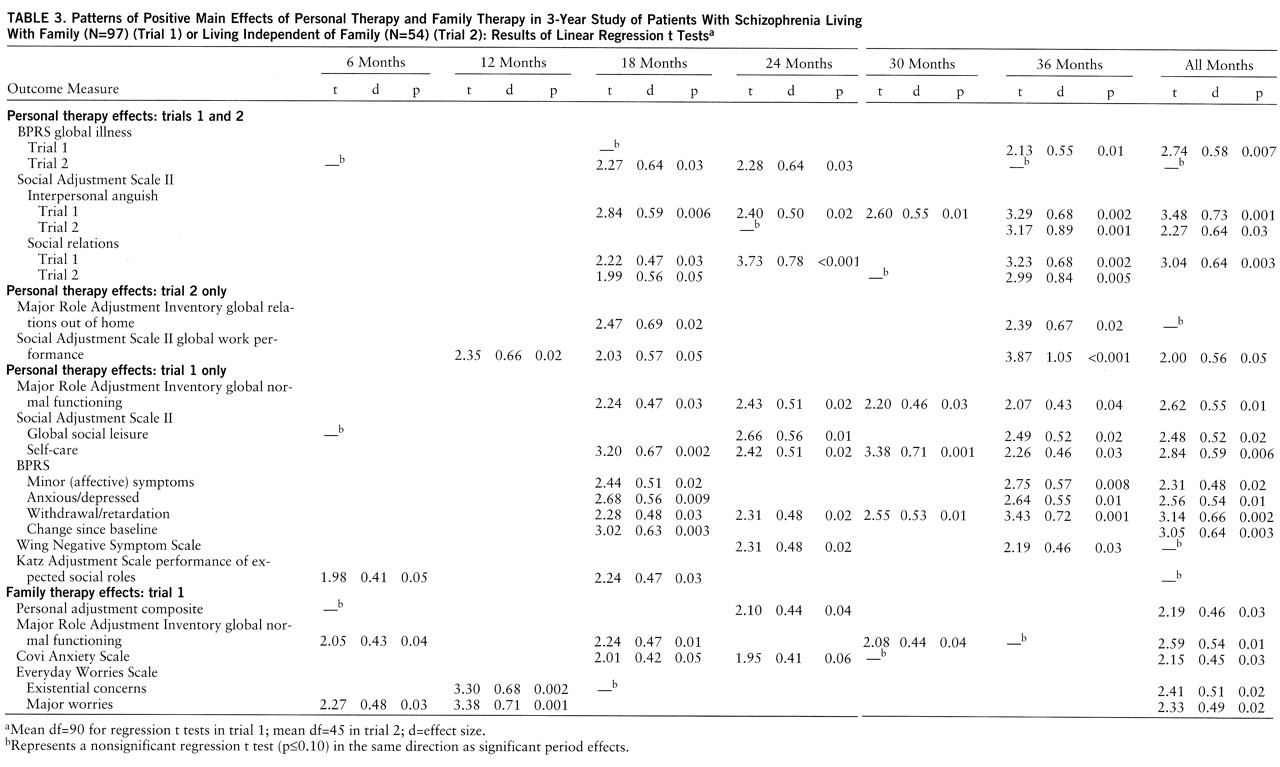
The significant treatment effects presented in tables 2–4 represent the results of t tests on the treatment-respective regression coefficients; these tests controlled for the effects of all independent variables in the analyses of the combined trials and the trial involving patients living with family. Given the smaller number of subjects and a reduced probability of achieving orthogonality for the independent variables, only the initial level covariate was controlled in the analyses for the patients living independent of family. The corresponding effect sizes (i.e., the clinically meaningful differences between the adjusted posttreatment means) were calculated as Cohen's d from the regression t tests (
25) and expressed in standard deviation units.
Evidence that personal therapy produced an effect on the social adjustment composite factor in the combined trials analysis, and that family therapy had a positive effect on the personal adjustment composite factor (trial 1), provided justification for univariate testing of each outcome variable listed in
table 1 at each semiannual period. However, as a further guide against the possibility of type I error, only those effects which satisfied our definition of a pattern are listed in tables 2–4. We defined a significant pattern for an outcome variable as p≤0.04 for the regression t test at two or more periods in the combined trials analysis or p≤0.06 at two or more periods in the linear regression analyses of separate trials, where the numbers of subjects were smaller. (Data in tables 2–4 indicate the presence of an additional nonsignificant indication in the same direction at other periods.) A seventh rating period represents the combined (average score) regression t test for a variable across the six semiannual assessments, i.e., the rating for all months in tables 2–4.
This alternative to multivariate testing (such as a repeated measures analysis of variance) was chosen because there were missing data, which might violate the assumptions of typical multivariate approaches. Since the significant effects of univariate testing numbered in the hundreds, we believe that the pattern definitions derived from an examination of the results are the most conservative yet accurate summations of the robust and consistent main effects of treatment.
The reader should keep in mind the order of testing because it was intended not only to guide inference making but also to minimize the chance for error associated with the large number of outcome measures (N=40 to N=44), rating periods (N=7), trials (two individual and one combined), and, therefore, the number of tests performed (N=868). The primary test was whether a significant treatment effect was observed on one or both multivariately derived composite indexes or the Katz Adjustment Scale R2 score. If so, the second test sought confirmation of a significant overall effect (another multivariate approach) on each component outcome measure associated with the significant composite effect. Finally, the individual (univariate) tests of the component outcome measures would need to meet criteria for significance at multiple time periods, i.e., would satisfy the definition of a pattern. Greater confidence in results would follow affirmation of all three tests. A note of caution in the interpretation of results will be offered whenever the three conditions are not met.
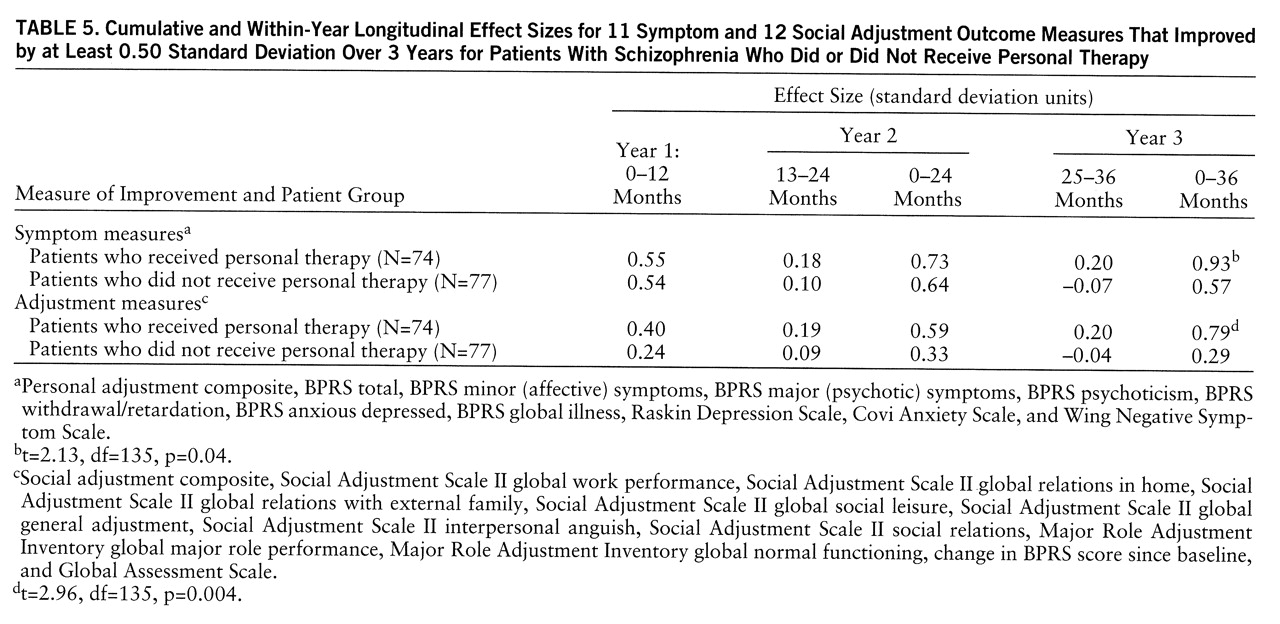
Longitudinal analyses. Independent of whether a variable was shown in the linear regression analysis to be statistically significant at one or more rating period, each outcome measure common to both trials was identified that showed a clinically meaningful change (i.e., an effect size of 0.50 standard deviation or greater) between clinic intake (baseline) and 36 months for either or both of the three combined personal therapy conditions (N=74) or the three no-personal-therapy conditions (N=77). For example, the GAS was included because there was a 1.15-standard-deviation change for the personal therapy condition and a 1.06-standard-deviation change for the no-personal-therapy condition over the 3 years, even though there were no significant differences between treatments at any of the individual rating periods. An improvement of 0.50 standard deviation on an outcome measure has long been accepted as clinically and statistically meaningful (
26). This analysis was designed to illustrate both the magnitude and the temporal course of symptomatic improvement and social recovery.
