Sample
The Caucasian female same-sex twins studied in this report are part of a longitudinal study of genetic and environmental risk factors for common psychiatric disorders. The twins, ascertained from the population-based Virginia Twin Registry, were eligible to participate in this study if both members of the pair had previously responded to a mailed questionnaire, to which the individual response rate was 64%. In our first series of personal interviews, we succeeded in interviewing 92% (N=2,163) of the eligible individuals. Ninety percent of the interviews were face-to-face; the rest were completed by telephone. Written informed consent was obtained before all face-to-face interviews, and personal assent was obtained for all telephone interviews. The mean age of the participating twins was 30.1 years (SD=7.6). Zygosity was determined blindly by using standard questions (
14), photographs, and, when necessary, DNA testing (
15).
Since the original interview, we have completed two additional series of telephone interviews, which succeeded in interviewing 2,001 (92.5%) and 1,898 (87.7%) of the originally interviewed subjects, respectively. The mean number of months between the first and third interviews was 61.3 (SD=5.1).
For these analyses, we used two subsamples: 1) individuals who completed all three personal interviews (N=1,822), in whom we attempted to predict risk for major depression at the time of either the second or third interview as a function of the characteristics of depressive syndromes reported at the first interview, and 2) members of pairs of known zygosity where both members were interviewed at least once over the first, second, and third interviews (N=2,058).
Measures
Information was collected from all respondents at each of the three interviews on the occurrence of 20 individual symptoms during the year before interview. Fourteen of these symptoms were disaggregated versions of the nine symptoms listed under criterion A for major depressive episode in DSM-III-R (p. 222). Six of the nine symptoms were each represented by a single item. Two symptoms were disaggregated into two items each: criterion A4 was divided into separate insomnia and hypersomnia items, while criterion A5 was divided into separate items assessing psychomotor agitation and retardation. Criterion A2 was disaggregated into four items: decreased appetite, increased appetite, decreased weight, and increased weight.
Symptoms were required to have a duration of at least 5 days. For every symptom reported present by the subject, the interviewer inquired as to the possibility that it was due to physical illness or medication. If in the interviewer's judgment this was the case, which occurred 17.4% of the time across all symptoms, then the symptom was considered not present.
For each symptom reported as present, we also inquired about the severity of the symptom and/or symptom-related impairment. This was assessed in several ways. Usually, we asked how much the specific symptom (e.g., feeling of depression, tiredness/fatigue) interfered with the subject's daily life. The response options were “hardly at all,” “some,” “a lot,” and “completely.” For weight gain and loss, we asked the number of pounds lost or gained, respectively. For insomnia and hypersomnia, we asked the number of hours of lost sleep or hours spent in extra sleep, respectively. For increased or decreased appetite and for psychomotor agitation, interviewers, after probing, rated the symptom as severe, moderate, or mild. We reduced ratings of severity or impairment for each symptom into three categories—mild, moderate, and severe. For symptoms where we inquired about impairment, we converted the ratings as follows: mild=hardly at all, moderate=some, and severe=a lot or completely. For weight gain and weight loss, we defined mild, moderate, and severe as an episode-related weight change of <10 lb, 10–14 lb, and ≥15 lb, respectively. For insomnia and hypersomnia, we defined mild, moderate, and severe as an episode-related change in sleep of <2 hours, 3–4 hours, and ≥5 hours, respectively. For DSM-III-R criteria that were represented by more than one item, we took the most severe symptom-related impairment reported.
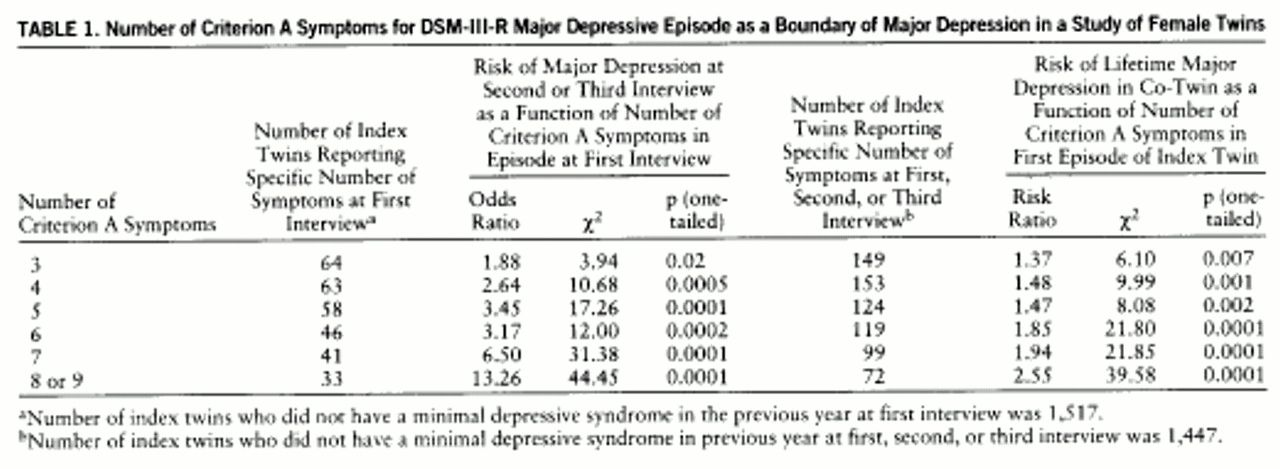
After inquiring about the individual symptoms, the interviewer asked the twin which if any of the endorsed symptoms co-occurred in the last year. For the purposes of this study, we defined a minimal depressive syndrome as consisting of at least three co-occurring depressive symptoms, regardless of level of severity or impairment—one of which had to be depressed mood or loss of interest/pleasure—and lasting at least 5 days.
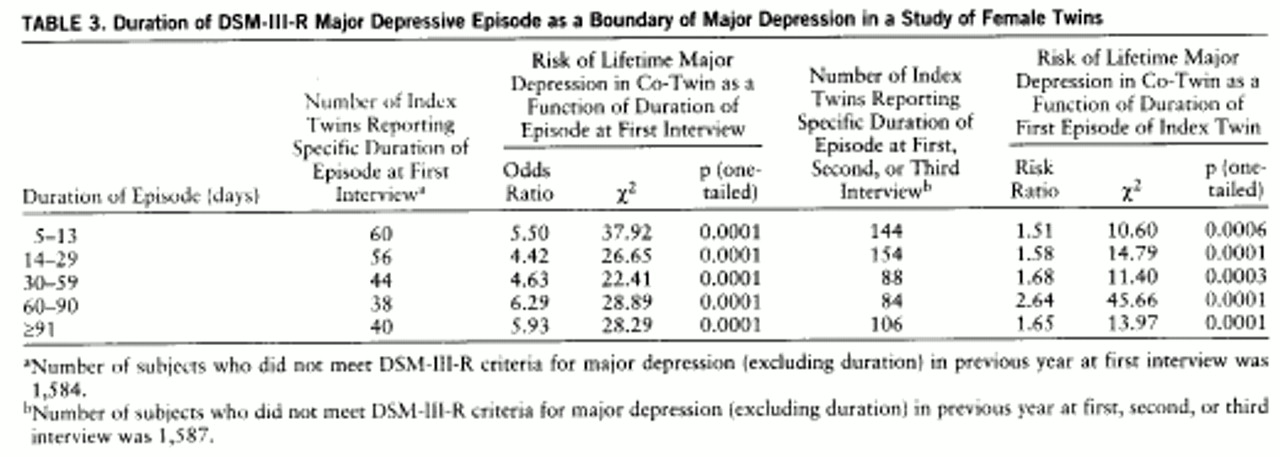
To examine the impact of the number of symptoms reported, we required a minimum duration of illness of 2 weeks and, in accord with DSM-III-R, did not require any level of severity or impairment for an individual symptom to be counted as present. To examine the impact of level of severity or impairment, we required a minimum duration of 2 weeks and at least five endorsed criterion A symptoms. We then defined three hierarchically organized groups. Subjects who had five or more of the criterion A symptoms at the severe level were classified as severe. Those who had five or more criterion A symptoms at the moderate level but were not classified in the severe group were classified as moderate. Those who met five or more criteria only at the mild level (and thus did not meet criteria for either the moderate or severe group) were classified as mild. To examine the impact of duration, we required a minimum of five criterion A symptoms but no accompanying level of severity or impairment and had no requirement for a reported duration longer than 5 days.
In addition to inquiring about the history of depressive symptoms in the last year, at both the first and third interviews we inquired about the lifetime history of major depression, using a section adapted from the Structured Clinical Interview for DSM-III-R (
16). We classified a twin as having a lifetime history of major depression if she reported one or more episodes meeting DSM-III-R criteria during any one of the three interviews.
Statistical Methods
Our analyses examined two potential validators of the nosologic boundaries of major depression. The first of these was risk of recurrence of DSM-III-R-defined major depression at the second and third interviews as predicted by characteristics of the depressive syndrome assessed at the first interview. These analyses were conducted by using logistic regression, operationalized by PROC LOGISTIC in SAS (
17). Subgroups of twins with a depressive syndrome (e.g., those with three, four, five, or more criterion A symptoms) were compared with twins who denied a minimal depressive syndrome at the first interview.
The second validator examined was the hazard rate of lifetime major depression, defined by DSM-III-R, in the co-twin as a function of features of the first minimal depressive syndrome experienced in the first, second, or third interview. This was performed by using the Cox Proportional Hazard method, as operationalized in the PHREG procedure in SAS (
17). Each group was compared with twins who denied ever experiencing even a minor depressive syndrome at all assessments. If a twin was not interviewed at all three interviews and reported no lifetime history of major depression, then her age at last interview was treated as her age.
For both the logistic and Cox analyses, we report the regression coefficient, on which tests for linearity are appropriately made, and chi-square with df=1. One-tailed p values are reported because we had a clear a priori directional hypothesis. For the logistic and Cox regression analyses, we also present, because of their ease of interpretation, the odds ratio and risk ratio, respectively.
To correct for the correlated observations in members of a twin pair, we multiplied the variance of the parameter estimate initially obtained by the following equation: ([1+r]x+y)/(x+y), where
r equals the intraclass correlation in twin pairs for the dependent variable,
x equals the number of complete twin pairs, and
y equals the number of unpaired individuals in the analysis. This formula was algebraically derived from the formula for clustered sampling as described by Kish (
18). Chi-square and p values were recalculated based on this new and larger estimate of the sampling variance.
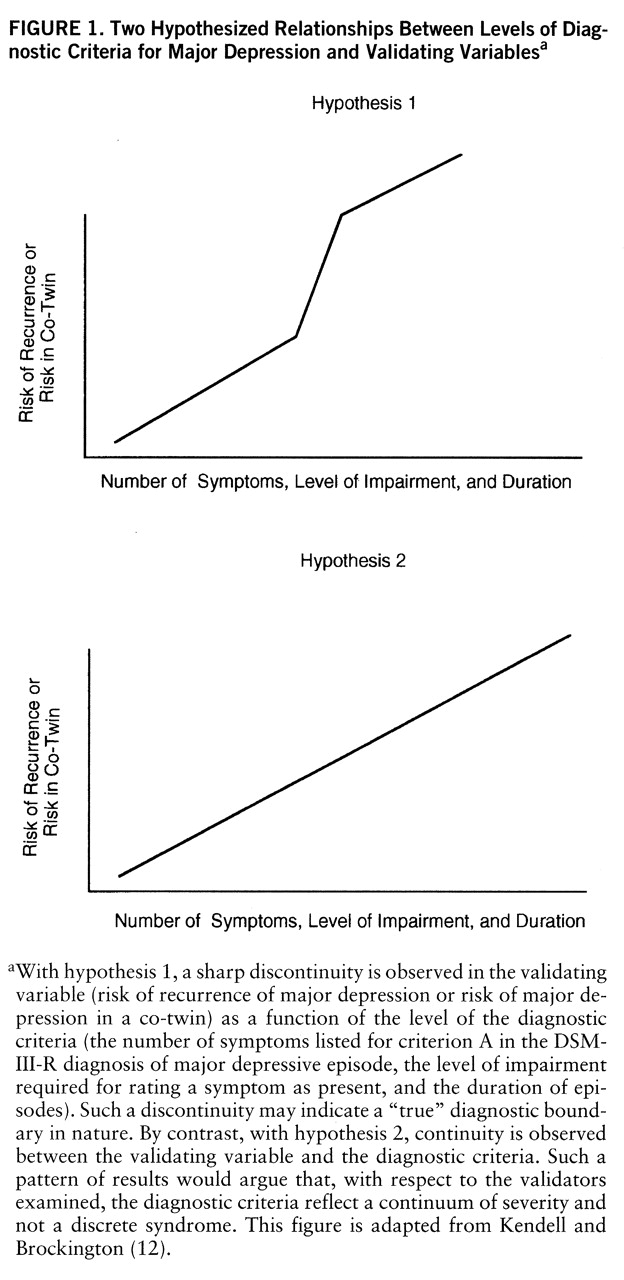
We wished to test statistically whether the relationships between our predictor and validator variables were continuous (hypothesis 2 in
figure 1) or contained a discontinuity (hypothesis 1 in
figure 1). To do so, we compared the fit—measured in log likelihood units—of a series of logistic and Cox regression models, including only subjects with a minimal depressive syndrome. We first fit a “covariates only” model, where the sole predictor variable was year of birth. Next, we examined the improvement in fit obtained when a single linear function was added. This function, as depicted in
figure 1 (hypothesis 2), assumes a continuous linear relationship between the predictor and validator measures and can be specified by a single parameter. Finally, we fitted a range of more complex models containing two or more parameters, which introduced discontinuities into the relationship either in the form of a second linear function or a dummy variable specifying that an individual category of the predictor variable has a unique value. The fits of these models were compared by –2×(log likelihood), which approximates a chi-square distribution.


