Anomalies of brain structure are a potential lead to the pathophysiology of schizophrenia, but the precise nature and distribution of such abnormalities have remained obscure. A degree of ventricular enlargement was established on the basis of radiological
(1,
2) and postmortem
(3,
4) studies and has been shown to be relatively constant across affected individuals
(5–
7). A modest reduction in cortical mass appears consistent across studies
(8–
10), as also does a loss of the subtle asymmetries, reflected in ventricular structure, that are characteristic of the human cerebral cortex (for reviews see references
11 and
12). A parsimonious view is that these three changes are interrelated and that changes in subcortical structures are secondary to global changes at the level of the cerebral cortex. However, this concept gives no direct lead to the origin and diversity of symptoms.
Interest has focused on abnormal structures in the medial temporal lobe, including particularly the parahippocampal gyrus (Brodmann’s areas 27, 28, 35, and 36). This structure receives input from heteromodal association areas of the cortex and gives rise to the perforant path that projects to the hippocampus and thereby transmits information into the limbic circuit. Reductions in volume
(3,
13,
14) and cortical thickness
(4,
15,
16) of the parahippocampal gyrus have been shown in postmortem studies, although there have also been reports
(17,
18) of relative normality in various structural indices. In two studies
(4,
15) less asymmetry of the cross-sectional gyral area was observed in patients with schizophrenia than in patients with affective disorder and in groups of normal subjects.
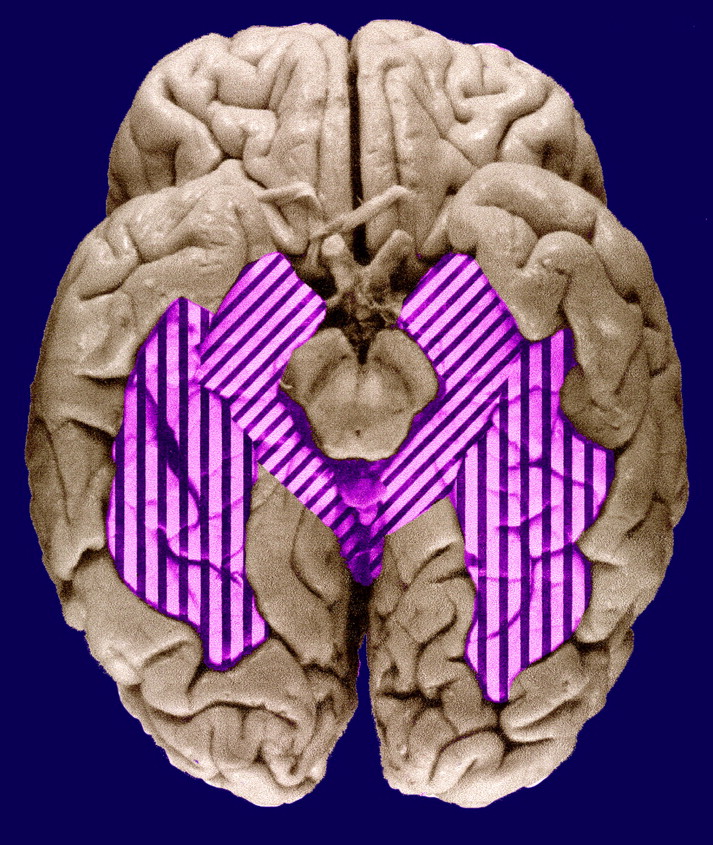
The fusiform gyrus (Brodmann’s areas 19, 20, and 37—sometimes referred to as the medial and lateral occipitotemporal gyri) lies immediately lateral to the parahippocampal gyrus in the temporal lobe and the lingual gyrus in the occipital lobe, on the ventral occipitotemporal surface (
figure 1). The gyrus extends for most of the length of the inferior occipitotemporal surface, being bounded medially by the parahippocampal gyrus and laterally by the inferior occipitotemporal gyri. It has connections with striate and prestriate visual areas and projects to language-related regions, including Wernicke’s area in the lateral and superior aspects of the temporal lobe; this relationship is consistent with a role in facial recognition, postulated on the basis of functional magnetic resonance imaging (MRI)
(19) and positron emission tomography
(20) studies. Although such functions might be relevant to delusional misinterpretation syndromes, to our knowledge there have been no morphological or functional studies of the fusiform gyrus in schizophrenia, perhaps in part on account of its inaccessibility by radiological investigation. According to a postmortem study
(21), the fusiform gyrus is one of the more asymmetric structures in the human brain.
The aim of the present study was to assess the structure of the parahippocampal and fusiform gyri in schizophrenia, with particular reference to their asymmetries. We predicted that the brains of schizophrenic subjects would have less asymmetry than would brains of subjects from the general population.
METHOD
Materials
Brains from patients with schizophrenia and from comparison subjects were collected from individuals for whom the next of kin had consented to use of tissues in medical research. The schizophrenic patients were selected on the basis of assessment of clinical notes by a psychiatrist (S.J.C. or T.J.C.) using the DSM-IV criteria for schizophrenia and schizoaffective disorder. The comparison subjects were individuals who had died without a history of neuropsychiatric disorder. The age at onset of schizophrenia (defined by first admission) was noted, and ratings were made of the quantity of neuroleptic medication taken during the subject’s lifetime (little, average, or much). The variable information in the case notes did not justify a more quantitative estimate of medication. The patient and comparison brains were prospectively collected at three centers (Oxford, Belfast, and Wickford, Essex) in the United Kingdom. The brains were fixed by suspension from the basilar artery in 10% formalin and assigned a randomized code by a third party, so that measurements could be made by persons blind to gender, diagnosis, and age. After fixation the brains were macroscopically and microscopically assessed to exclude other pathologies (including Alzheimer’s disease, Parkinson’s disease, and macro- and microscopic vascular disease) by using the criteria of the Consortium to Establish a Registry for Alzheimer’s Disease
(22). This study included 13 female and 14 male comparison subjects and 13 female and 18 male patients with schizophrenia or schizoaffective disorder. The female comparison subjects and schizophrenic patients had mean ages of 73.5 years (range=48–90) and 74.7 years (range=44–91), respectively, and the mean ages of the men were 66.6 years (range=40–89) and 61.9 years (range=29–87). Four of the patients had had psychosurgery.
Stereology
Brain volumes, including volumes of gray matter in the regions of interest, were measured by unbiased stereological techniques using the Cavalieri principle
(23–
25). In order to measure the area and volume of the cortical mantle, the temporal lobes of the brains were sliced to yield section planes separated by known distances, from which it was then possible to determine volume, by using a test grid of points overlaid on randomly oriented section planes of the temporal lobe slices
(26).
Procedure
After fixation the brains were carefully stripped of the leptomeninges. The hindbrain was removed by transection through the midbrain, and the cerebrum was bisected. The temporal and occipital lobes were separated from each cerebral hemisphere. The fusiform gyrus of each temporal lobe was defined by using waterproof calligraphy ink. The occipitotemporal lobes were then coronally sliced into 5-mm-thick slices, and the inferior surface was photographed (with a calibration rule in the field of view). The resulting images were then projected, at a magnification of ×2.3, onto a randomly positioned 1-cm-grid array of test points. For each gyrus (left and right, fusiform and parahippocampal), the test points falling on the gray matter on each slice were counted. The sum of these counts multiplied by a scaling coefficient yielded estimates of the gyral volume. The parahippocampal gyrus was defined in the following manner. The posterior boundary was the most posterior temporal lobe slice in which the hippocampus was visible. The anterior-most slice on which the gyrus was measured was at the level of the uncus, where the hippocampus merges with amygdala. The superior boundary was the interface between the hippocampus and the subiculum.
The fusiform gyrus was identified as follows: the medial margin was defined by the collateral and rhinal sulci, i.e., the boundary of the parahippocampal gyrus, and the lateral boundary was taken as the sulcus medial to the inferior temporal gyrus. The anterior extremity of the fusiform gyrus approached the temporal pole. The posterior boundary, as defined for the purpose of this study, was the most posterior temporal lobe slice in which the hippocampus was visible.
For each gyrus, the left and right sides were measured, and the asymmetry coefficient (δ) of the two sides was calculated as follows: δ = (right–left)/(right+left) × 100.
As the mean age of the women in the series was higher than that for the men, age was entered into all the analyses of variance as a covariate to yield a regression analysis for the effects of age.
Accuracy
An assessment of the accuracy of the estimate of the mean volume of a structure for each comparison group (female comparison, male comparison, female schizophrenia, male schizophrenia) is given by the group coefficient of error (standard error of the mean divided by the mean). The lower the value of this ratio, the more accurately the mean value attained reflects the true population mean. For both the parahippocampal and fusiform gyri, all groups had group coefficient errors below 0.092.
The observed coefficient of error for the individual estimates of volume were calculated as described by Gundersen and Jensen
(23). The mean observed coefficient of error for the different volumes were as follows: parahippocampal gyrus, 0.087 for the left and 0.086 for the right; fusiform gyrus, 0.080 for the left and 0.081 for the right.
From the coefficients of error for the individual volume measures, one can estimate the percentage of observed relative variance of each measure that is accounted for by true interindividual variance, as opposed to the stereological volume estimate
(27,
28). True interindividual variation accounted for a minimum of 74% for each measure for each group.
RESULTS
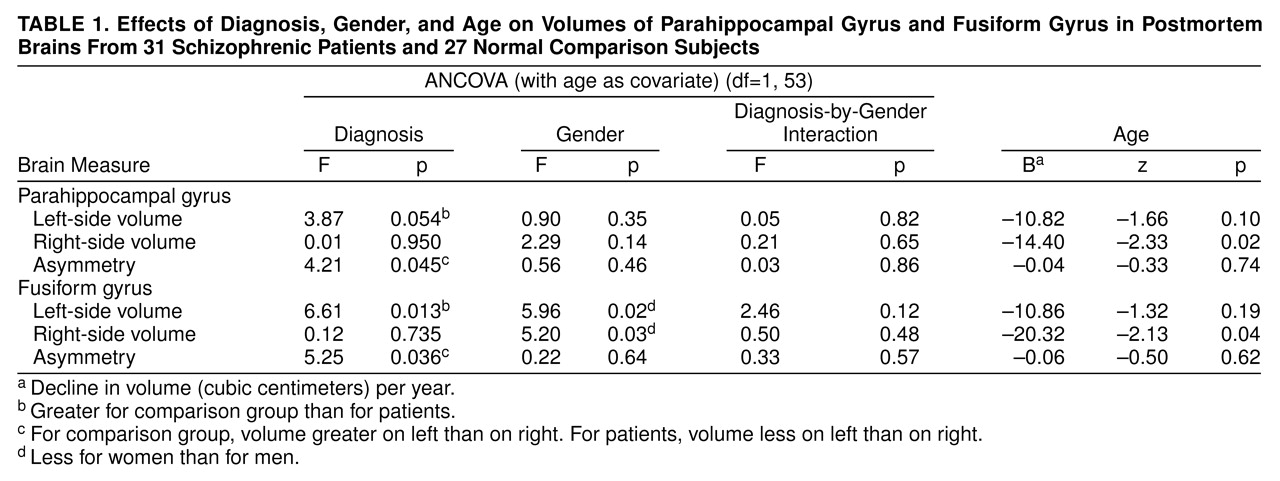
For each gyrus, the asymmetry data and left and right volumes were entered into an analysis of covariance (ANCOVA) with diagnosis and gender as factors and age as covariate. This generates a statistic z, which is assessed in terms of the normal distribution to produce a p value (i.e., without degrees of freedom). The results of these analyses are summarized in
table 1.
Parahippocampal Gyrus
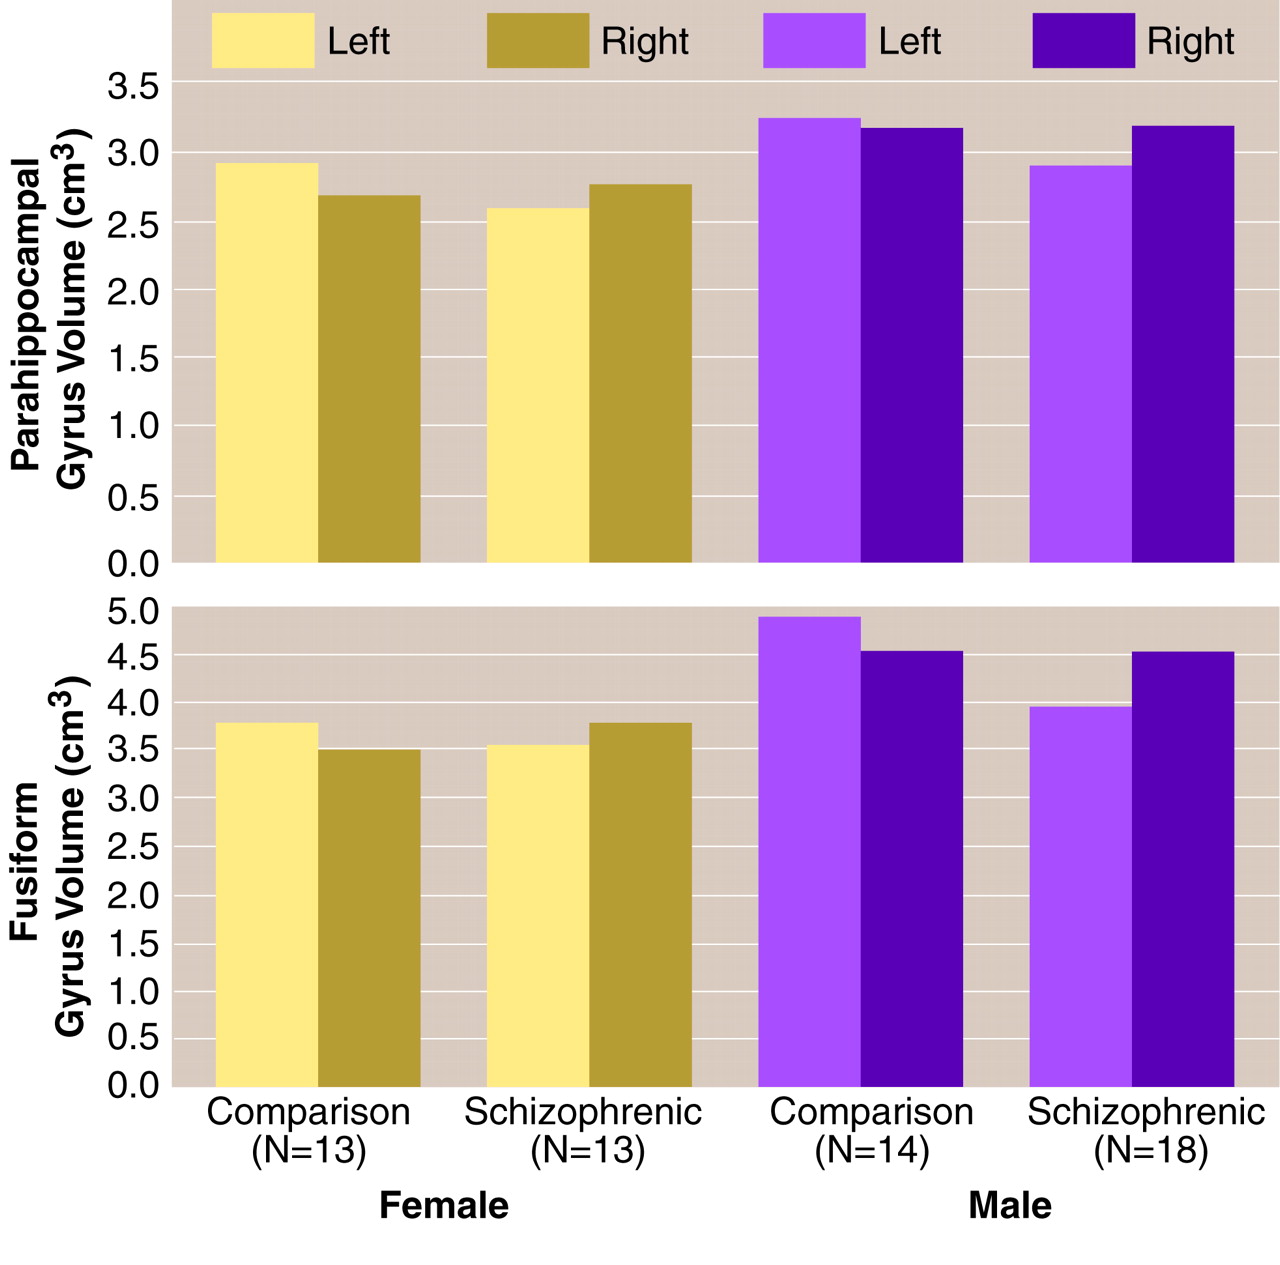
For the left parahippocampal gyrus volume (
table 1 and
figure 2, top), the ANCOVA revealed no effect of gender and no gender-by-diagnosis interaction. There was a nonsignificant effect of diagnosis, which corresponded to a 10.6% smaller volume of the left parahippocampal gyrus in the schizophrenic group. There was no significant effect of age.
For the right parahippocampal gyrus volume (
table 1 and
figure 2, top), the ANCOVA revealed no effect of diagnosis, no effect of gender, and no gender-by-diagnosis interaction. There was a significant effect of age corresponding to a volume decrease in this gyrus of 14.4 mm
3, on average, per year.
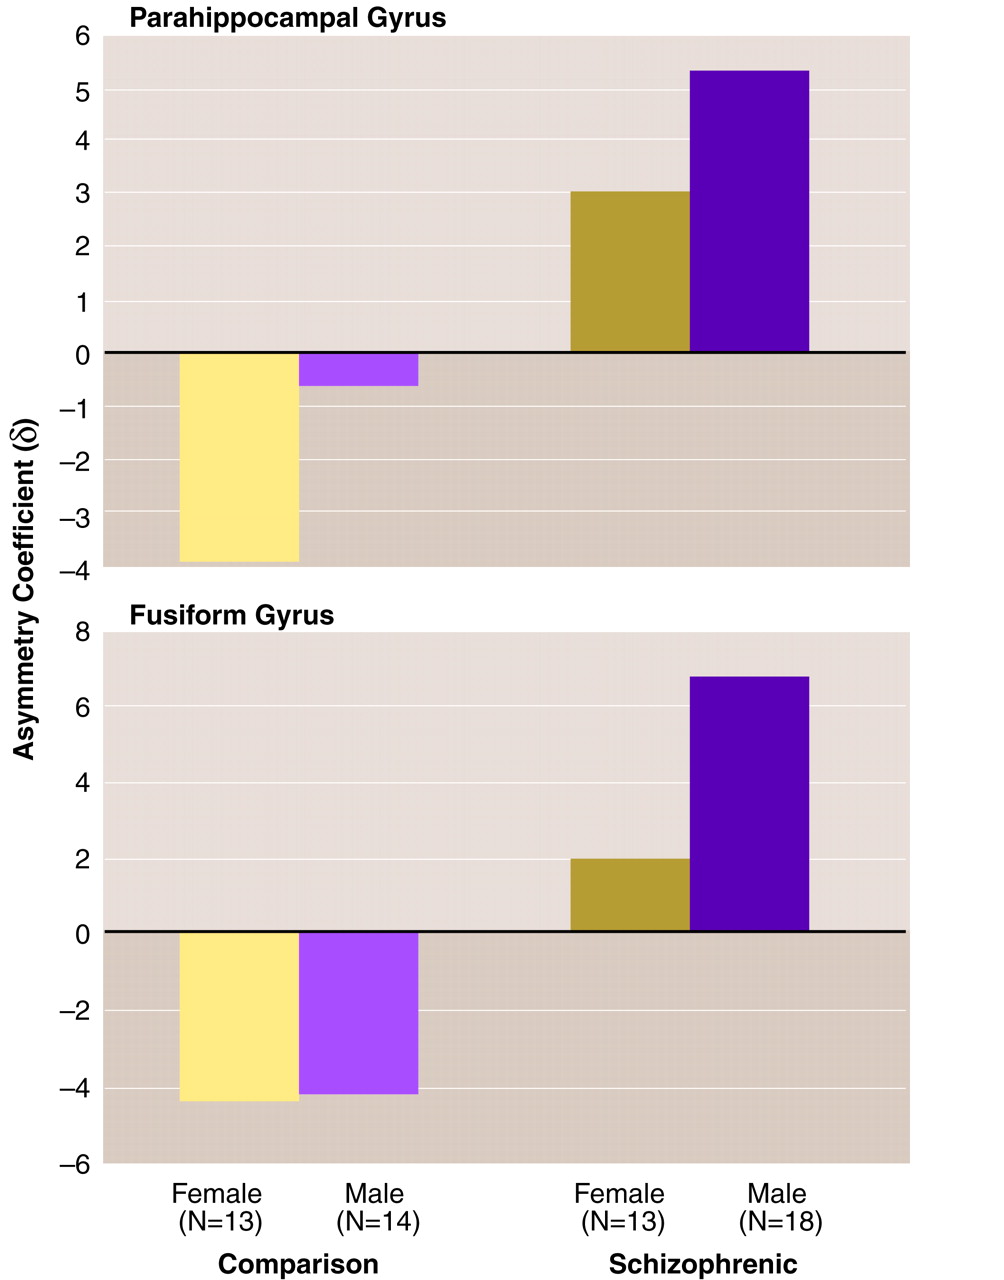
For the asymmetry of the parahippocampal gyrus volume (
table 1 and
figure 2, top, and
figure 3, top), the ANCOVA revealed a significant effect of diagnosis, such that the comparison subjects showed a left-greater-than-right asymmetry and the schizophrenic patients showed a right-greater-than-left asymmetry. There was no effect of gender and no gender-by-diagnosis interaction. There was no significant effect of age.
The analyses of the parahippocampal gyrus asymmetry and left-side volume were repeated after exclusion of the patients who had undergone leukotomy, to elucidate whether the apparent diagnosis effects were due to psychosurgery. The repeat analysis revealed a significant effect of diagnosis (F=4.62, df=1, 49, p=0.04) on the left parahippocampal volume and a nonsignificant effect of diagnosis (F=3.42, df=1, 49, p=0.07) on asymmetry.
Fusiform Gyrus
For the left fusiform gyrus volume (
table 1 and
figure 2, bottom), the ANCOVA revealed a significant effect of diagnosis and a significant effect of gender, such that the women had approximately 15% smaller volumes than the men, but no gender-by-diagnosis interaction. The effect of diagnosis corresponded to 13.2% smaller left fusiform gyrus volumes in the patients with schizophrenia than in the comparison subjects. There was no significant effect of age.
For the right fusiform gyrus volume (
table 1 and
figure 2, bottom), the ANCOVA revealed no effect of diagnosis, a significant effect of gender, such that the women had 19.0% smaller volumes than the men, and no gender-by-diagnosis interaction. There was a significant effect of age, suggesting that the volume of this structure decreased by 20.3 mm
3 per year.
For the asymmetry of the fusiform gyrus volume (
table 1 and
figure 2, bottom, and
figure 3, bottom), the ANCOVA revealed a significant effect of diagnosis. There was no effect of gender and no gender-by-diagnosis interaction. As for the parahippocampal gyrus, the comparison subjects showed a left-greater-than-right asymmetry and the schizophrenic patients had a right-greater-than-left asymmetry (
figure 2, bottom, and
figure 3, bottom). There was no significant effect of age. Again, analysis of the fusiform gyrus data was repeated after exclusion of the patients who had undergone leukotomy. The repeat ANCOVAs for the fusiform gyrus revealed significant effects of diagnosis on left-side volume (F=7.64, df=1, 49, p=0.008) and on asymmetry (F=5.89, df=1, 49, p=0.02).
The similarity of the abnormalities in left (but not right) gyrus volume in both the parahippocampal and fusiform gyri of the schizophrenic patients raises the question of whether they reflect the same cause. Across the entire cohort, the fusiform and parahippocampal gyrus asymmetries showed a statistically significant Pearson’s correlation coefficient (r=0.50, df=58, p<0.0005). The correlation was significant within the schizophrenic patients (r=0.66, df=31, p<0.0005) but not the comparison subjects (r=0.23, df=27, p=0.24). After Fisher’s z transformation was applied, a t test comparison revealed a significant difference (t=2.01, df=54, p=0.05) between the correlation coefficients for the comparison subjects and patients.
Age at Onset
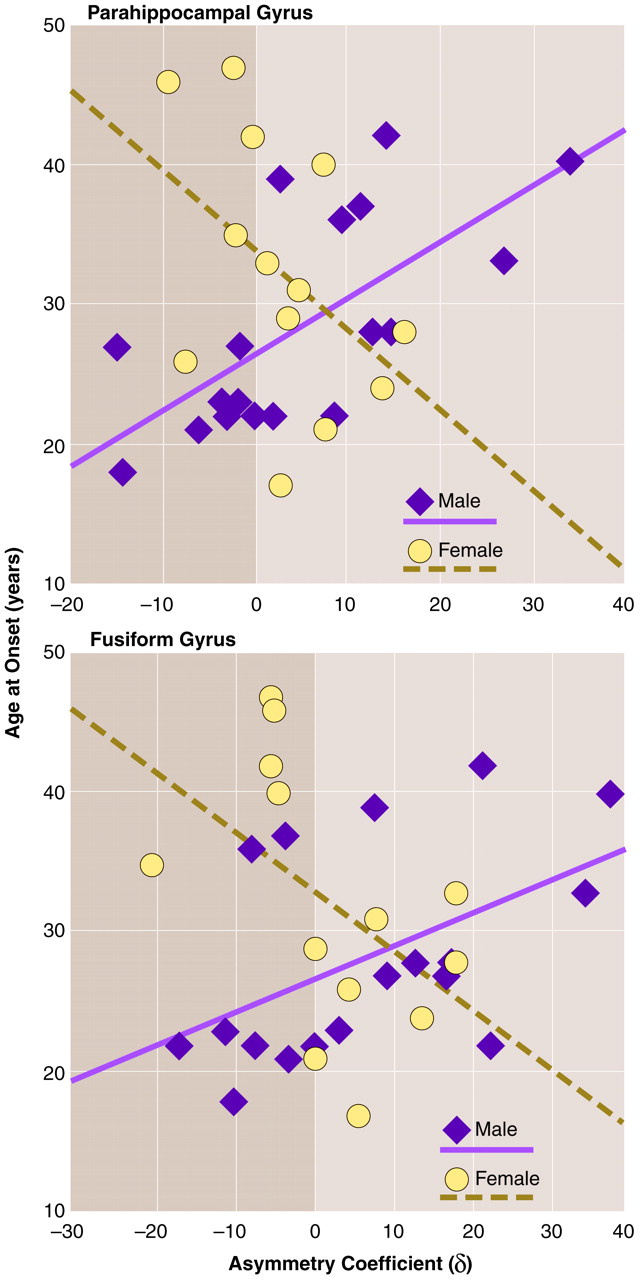
Onset for the male patients (mean age=28.94, SD=7.34) was earlier than for the female patients (mean=32.23, SD=9.43), as is usually found, although the difference was not statistically significant (t=1.08, df=28, p=0.29). The asymmetry scores were found to relate to age at onset.
Figure 4 (top) reveals a positive correlation between the asymmetry coefficient for the parahippocampal gyrus and age at onset for men (r=0.67, df=18, p=0.002) and a negative correlation between the asymmetry coefficient and age at onset for women (r=–0.46, df=13, p=0.12). Thus, for female schizophrenic patients, age at onset was not significantly related to parahippocampal gyrus asymmetry. For male patients, however, there was a relationship such that patients with a left-greater-than-right asymmetry had earlier onsets. With increasing rightward asymmetry, later onset was seen. The correlation coefficients for men and women were subjected to Fisher’s z transformation and compared by means of a t test. This revealed the gender difference to be significant (t=3.23, df=27, p=0.003).
Figure 4 (bottom) shows a similar relationship between asymmetry in the fusiform gyrus and age at onset for the two sexes. For women there was a nonsignificant negative correlation between asymmetry and age at onset (r=–0.48, df=13, p=0.09). For men there was a significant positive correlation between the two (r=0.50, df=18, p=0.04). The difference between these two correlation coefficients was significant (t=2.65, df=27, p=0.01). Thus, for the female patients, age at onset was not significantly related to fusiform gyrus asymmetry. For the male patients, however, those with a left-greater-than-right asymmetry had earlier onsets. With increasing rightward asymmetry (i.e., with increasing anomaly), later onset was seen.
Neuroleptic Medication and Postmortem Delay
The mean delay between death and brain removal for the groups was 43.38 hours (SD=25.80) for the comparison women, 41.38 hours (SD=29.29) for the comparison men, 39.69 hours (SD=32.89) for the female patients, and 44.65 hours (SD=32.56) for the male patients. There were no significant intergroup differences (diagnosis: F<0.005, df=1, 52, p=1.00; gender: F=0.03, df=1, 52, p=0.86; interaction: F=0.18, df=1, 52, p=0.67).
Finally, we performed an ANCOVA on the data from the schizophrenic patients to ensure that the findings were not an artifact of the neuroleptic medication that the patients had taken (see Method section). Lifetime medication level (little, average, much) was entered as the only factor, with age as a covariate. No effect of medication was found for parahippocampal gyrus asymmetry (F=0.74, df=2, 27, p=0.49) or fusiform gyrus asymmetry (F<0.005, df=2, 27, p=1.00).
Quester and Schröder
(29) demonstrated that any alteration due to the fixation of brains proceeds rapidly to a stable state after a maximum of 3 weeks. As all of our brains were fixed for much longer than this, all would have reached their stable, postfixation configurations. Thus, no differences between groups by fixation artifact would be expected.
DISCUSSION
The salient observation was the reversal in schizophrenia of the asymmetries of the gray matter of the parahippocampal and fusiform gyri that are characteristic of the brains of most normal individuals (
table 1). Two previous studies
(4,
15) are relevant to our laterality findings for the parahippocampal gyrus. Although both studies showed anomalies of laterality in schizophrenia, single cross-sectional areas were measured. Further, in the latter investigation
(15) the study group was small (nine male and three female patients). In contrast, the stereological volume measures described here provide a more meaningful assessment of the anatomy of this structure and are not influenced by random variations in the precise region of gyrus measured.
The findings for the fusiform gyrus extend the parahippocampal observations. The strategy of demarcating the fusiform gyrus with ink before sampling allows greater accuracy in outlining this structure on coronal slices. The abnormalities in the two gyri are similar. On the right, there was a modest age-related loss of substance (14.4 mm
3 per year for parahippocampal gyrus, 20.3 mm
3 per year for fusiform gyrus). On the left side, there was evidence of a loss of substance in schizophrenia (consistent with the findings of the MRI studies reviewed by Lawrie and Abukmeil
[30]) that is of the order of 10.6% (p=0.05) for the parahippocampal gyrus and 13.2% (p=0.01) for the fusiform gyrus. Most striking is the change from left-sided predominance in the comparison subjects to right-sided predominance in the patients (p<0.05 and 0.03 for the parahippocampal and fusiform gyri, respectively; see
figure 2 and
figure 3). This pattern may be the result of either of two changes in brain configuration. The first possibility is a purely left-sided reduction in volume. The second corresponds to an asymmetry shift superimposed on a bilateral reduction in volume, as described by Ward et al.
(31).
By contrast with recent observations on surface asymmetries in the cortex
(32) and in callosal fiber densities
(33), no strong interactions with sex were apparent in the raw volume assessments. However, such interactions were uncovered when age at onset of schizophrenia was taken into account (
figure 4). For the women, the correlations between asymmetry index and age at onset were negative and nonsignificant. For the men, the correlations were positive and significant. The differences between the genders were highly significant. Thus, greater age at onset is associated with increasingly atypical asymmetry in men but not in women. This conclusion may be relevant to the general finding of a 2–3-year earlier onset in males
(34–
36).
The findings can be viewed in the context of the recent literature on structural brain abnormalities in schizophrenia. In addition to larger ventricles and somewhat smaller overall cortical mass, in relation to normal subjects, there is evidence for a difference in asymmetry (generally less) in postmortem and radiological studies with indexes that include scan densities
(37), brain widths
(38–
40), segmental volumes
(41,
42), cortical surface measurements
(32), length of the Sylvian fissure
(43,
44), planum temporale assessments
(45–
47), volume
(48) and gray matter
(49) assessments of the temporal lobe, and area
(50) and volume
(51) assessments of the temporal horn. Although the abnormalities are consistent, many are small in magnitude, and contrary interpretations have been expressed
(52–
55). If, as has been claimed
(11,
12,
50), loss of asymmetry is the most characteristic feature of the brain in schizophrenia, and a clue to the genetic predisposition, some explanation for the subtlety and distribution of the asymmetries in the normal brain and their deviations in schizophrenia is required. While some abnormalities in asymmetry, such as those in the present study, are relatively large (on the order of 5% to 6%), in other studies (e.g., of cerebral widths) the differences are smaller (on the order of 1% or 2%), and sometimes no such differences are detected (e.g., in the lateral measures reported by us
[32] and Flaum et al.
[52]). A possible explanation is that the asymmetries are local rather than global and can be detected only when the relevant cortical structures are assessed. Thus, it appears that there is an axis of asymmetry from the right dorsolateral frontal to the left occipitotemporal cortex and that this asymmetry is expressed to a greater extent in “heteromodal association” areas
(56) than in primary sensorimotor and association cortex. Such a distribution is consistent with the concept that the areas that are latest to develop in ontogeny carry the greatest asymmetries, and these areas are also those that would be expected to show the greatest interindividual variability. The correlation between the two asymmetries in schizophrenia, and its absence in the comparison subjects, could be taken as evidence for greater connectivity between the fusiform and parahippocampal gyri in schizophrenia. We have previously offered such an interpretation for a greater degree of gyrification in the temporal lobe
(57).
One can speculate on the possible functions of the structures in which variations relating to schizophrenia have been found. While the parahippocampal gyrus appears to play a very general role in transmitting information from all areas of the cortex into the hippocampus and limbic circuit, the fusiform gyrus, at least in its posterior extent, is more selectively related to the visual modality. In that anteriorly it approximates to the basal speech area in the inferior temporal gyrus
(58), it might plausibly be assigned a role in attaching verbal labels to important visual inputs. In functional imaging studies, activation of the fusiform gyrus has been demonstrated during facial recognition
(19) and matching
(20,
59–
61), while losses of facial, gender, and object recognition are reported after lesions in this region, with deficits in biographical information being greater with lesions in the nondominant hemisphere and deficits in facial recognition greater with lesions in the dominant hemisphere
(62). A magnetoencephalographic study revealed face-specific responses in the inferior occipitotemporal cortex in the right hemisphere
(61). A key component in the human use of language is the ability to recognize, name, and attribute characteristics to others. If the fusiform gyrus contributes to this process, it is conceivable that a deviation could be manifested as a delusional misidentification or other syndrome of a paranoid type.
The sex difference in age at onset of psychosis is unexplained
(35,
36). In another study
(32) on this set of brains we observed a sex difference in the asymmetry of the length of the frontal lobe (normal men have a right-greater-than-left asymmetry, and normal women have a left-greater-than-right asymmetry) that was reversed in patients suffering from schizophrenia. These tendencies were differentially related to age at onset, just as the present findings on the parahippocampal and fusiform gyri were correlated with age at onset in men and not in women. Although we have no detailed explanation, these relationships are consistent with the possibility that the sex difference in age at onset in schizophrenia is directly related to the sex difference in cerebral asymmetry, a difference that itself can be explained by the fact that the gene for asymmetry is in the class that is present in homologous form on the X and Y chromosomes. This hypothesis is based on the neuropsychological deficits associated with sex chromosome aneuploidies
(63–
65) and is consistent with observations on the transmission of handedness within families
(66).