Subjects
We included 23 normal subjects (12 men, 11 women) who had no history of axis I or II disorders, as assessed by the Structured Clinical Interview for DSM-IV Axis I Disorders—Non-Patient Edition (SCID-I/NP)
(29) and the Structured Clinical Interview for DSM-IV Axis II Disorders
(30), and no family history of psychiatric illness. The established interrater reliability for the SCID-I/NP in our laboratory is 0.98
(31). All of the normal subjects were recruited through newspaper advertisements and were excluded from participation if they reported a history of major medical or neurological disorders (seizures, head injury). None of the normal or schizotypal subjects reported substantial drug abuse in the past month. In addition, they were screened for current drug use through urine toxicology screening (no subject was excluded on this basis).
Twenty-six subjects with schizotypal personality disorder (14 men, 12 women) were recruited from the inpatient and outpatient facilities at the University of California, San Diego, Medical Center (N=3), at the La Jolla Veterans Affairs Medical Center (N=5), and at Balboa Naval Hospital, San Diego (N=1). Additional subjects with schizotypal personality disorder (N=14) were recruited by using newspaper advertisements for “people who had experiences with the paranormal,” “a UCSD ESP study,” and “people who are shy, have difficulty with trust and few friends.” The advertisements were designed to identify individuals with both the positive symptoms (magical thinking, perceptual abnormalities, ideas of reference) and negative symptoms (few friends, social anxiety) of schizotypal personality disorder. Additional schizotypal subjects (N=3) were identified through screening of potential normal subjects.
Before entry into the study, all subjects provided written informed consent after receiving an explanation of the study.
There was a significant difference in age between the normal subjects (mean=32.0 years, SD=9.8) and the subjects with schizotypal personality disorder (mean=38.6, SD=10.2) (t=–2.31, df=47, p<0.05). The two groups also differed in years of education (normal: mean=15.1, SD=2.3; schizotypal: mean=13.5, SD=2.3) (t=2.39, df=47, p<0.05).
All of the subjects with schizotypal personality disorder were assessed with the SCID-I/NP and with the Structured Interview for DSM-IV Personality
(32). All subjects met the DSM-IV criteria for schizotypal personality disorder, and any subject with a history of a psychotic illness, current major depression, or major medical or neurological illness was excluded (N=3). Five of the 26 subjects were receiving psychotropic medication: two were receiving low-dose neuroleptics (thiothixene, 2 mg/day; perphenazine, 2 mg/day), two were receiving antidepressants, and one was receiving valproate and clonazepam.
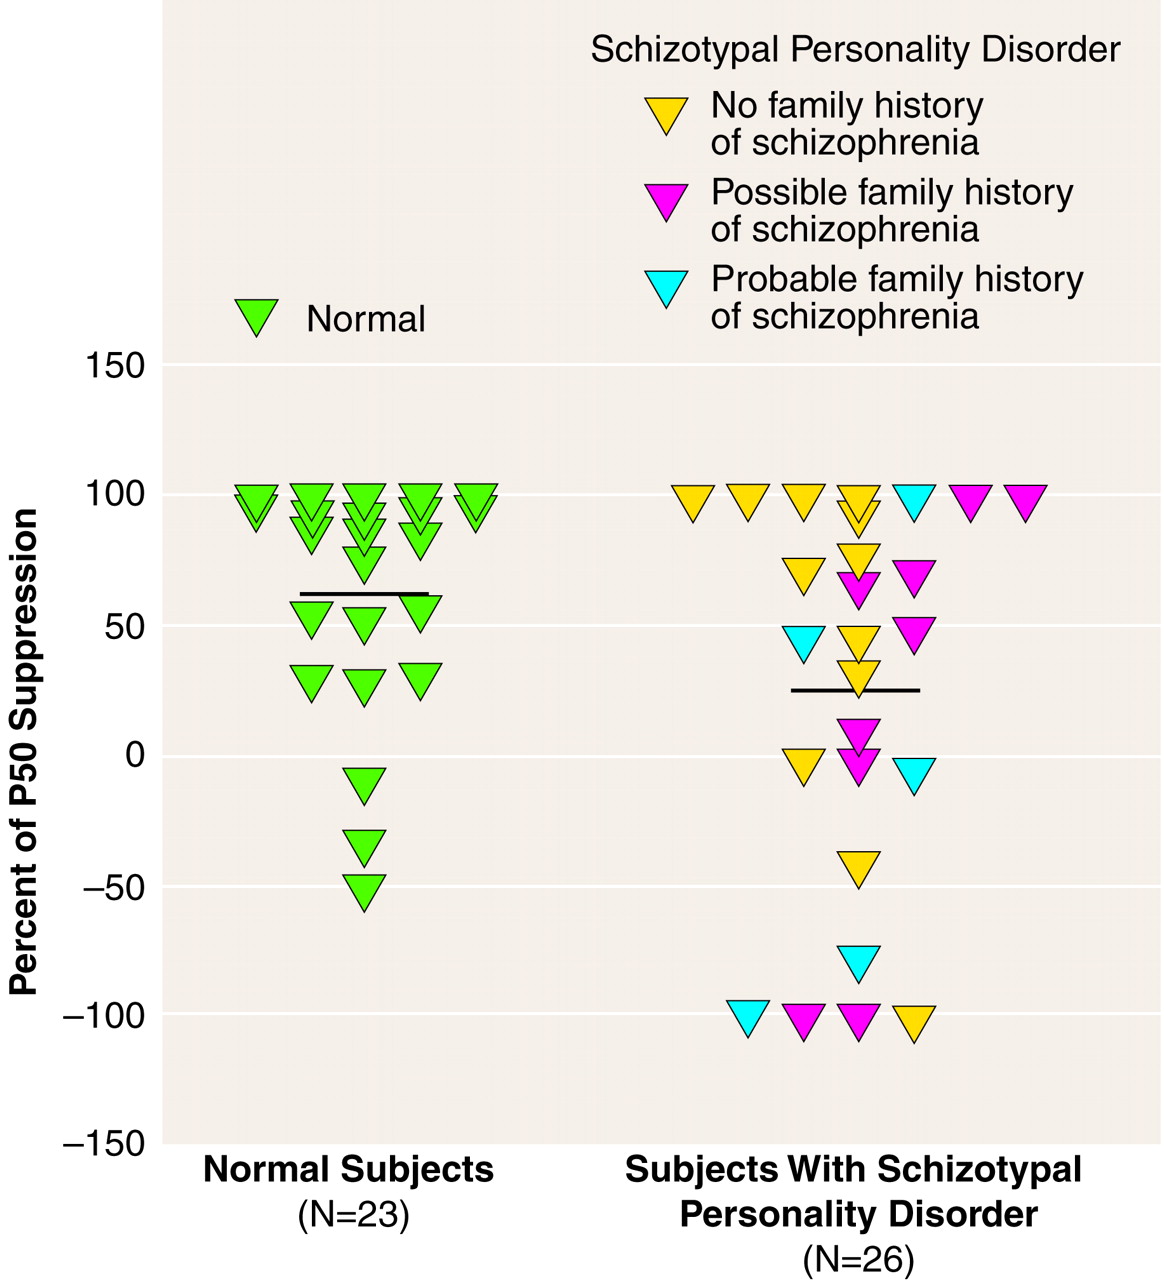
All of the schizotypal subjects were queried regarding family history of psychiatric illness. Specifically, questions regarding a family history of psychiatric hospitalization, suicide, treatment with psychotropic medication, and nervous breakdown were asked in regard to first-, second-, and third-degree relatives. Subjects were then queried further regarding any identified family member to determine whether the identified symptoms and chronicity met the criteria for an axis I disorder. Of the 26 schizotypal subjects, 14 reported a family history of schizophrenia, paranoia, nervous breakdown, suicide, or chronic psychiatric hospitalization. Each subject was classified as having a “possible” or “probable” family history of schizophrenia on the basis of the information he or she was able to provide. A “probable” family history of schizophrenia was assigned to five subjects who had relatives diagnosed with schizophrenia or who described symptoms consistent with schizophrenia (delusions, hallucinations, withdrawal) that were chronic in nature. A “possible” family history of schizophrenia was assigned to nine individuals who were unable to provide sufficient information to make a psychiatric diagnosis for relatives who committed suicide or who returned to normal functioning after one brief episode of emotional disturbance requiring hospitalization. Because their relatives were not assessed and other family members were not interviewed, it was not possible to determine whether the subjects with schizotypal personality disorder had a definite family history of schizophrenia or other psychotic disorder. Seven other schizotypal subjects reported a family history of depression or anxiety disorders.
The subjects with schizotypal personality disorder had a mean of 6.2 (SD=1.1) schizotypal symptoms and a mean of 1.4 (SD=1.5) other personality disorders. They had mean scores of 55.3 (SD=12.4) on the Global Assessment of Functioning Scale, 5.2 (SD=3.8) on the Scale for the Assessment of Negative Symptoms
(33), 6.5 (SD=2.5) on the Scale for the Assessment of Positive Symptoms
(34), and 33.0 (SD=10.8) on the Schizotypal Personality Questionnaire
(35).
Measurement of P50 Event-Related Potential
The P50 sensory gating test used a signal generator and data acquisition system (San Diego Instruments, San Diego, Calif.) and amplifiers (Grass, West Warwick, R.I.) to record the EEG data according to our established methods
(20,
24). The subject was seated in a comfortable recliner in a quiet, lighted room while wearing headphones for presentation of the auditory stimuli. The subject was instructed to relax, to keep his or her eyes open, and to focus on a fixation point. All subjects were monitored for signs of sleep by visual observation and EEG monitoring. When a subject was observed to be drowsy, the examiner would briefly interact with the subject. Eye movements were recorded by using electro-oculography (EOG) with Ag/AgCl electrodes placed at the outer canthus of the left eye and below the right eye. Electrodes were used at seven recording sites (Fz, Cz, Pz, F3, F4, C3, C4, according to the 10/20 system) with a forehead ground and referenced to linked earlobes. All electrode resistances were less than 5 kΩ . The stimuli were generated by means of computer-driven pulses with a 1-msec duration by using a signal generator and data acquisition system for the recording of EEG waveforms. To control background noise during stimulus presentation, 60-dB[A] broadband white noise was presented continuously throughout the session. The auditory clicks consisted of flat broadband (250 Hz to 50 kHz) square waves of 1-msec duration (rise time of 12–15 µsec) with an average resulting click of 89 dB[A]. The interpair interval was varied between 8 and 12 seconds in 1-second increments. The stimuli were 120 click pairs (stimulus 1 and stimulus 2) with a 500-msec interclick interval. The EEG responses were amplified and band-pass filtered with an analog filter of 0.01 to 300 Hz and no 60-Hz notch filter, at a sampling rate of 1000 Hz, for a total of 1000 msec (100 msec before to 400 msec after the stimuli with a 500-msec gap between stimulus 1 and stimulus 2). The P50 component was identified and quantified according to the established methods of Nagamoto et al.
(26) and our laboratory (20, 24). The data were then digitally low-pass filtered at 100 Hz before artifact screening, to eliminate any residual electrical noise. After acquisition of the data, the EEG and EOG channels were screened for artifact, and trials containing artifact (plus or minus 50 µV EOG or EEG channel deflection) were not included in the waveform averaging. Artifact-free epochs were averaged and digitally band-pass filtered (5–50 Hz). The filter had 12-dB/octave high- and low-pass slopes similar in gain characteristics to those reported by Jerger
(36) and is consistent with previously reported methods from our laboratory
(37). The P50 component was identified as the most positive deflection 40 to 80 msec following stimulus presentation. The P50 amplitude is the absolute difference between the P50 peak and the preceding negative trough
(24,
38). The data from the Cz site are reported because this is the best site for discriminating schizophrenic patients from normal subjects when using this electrode array
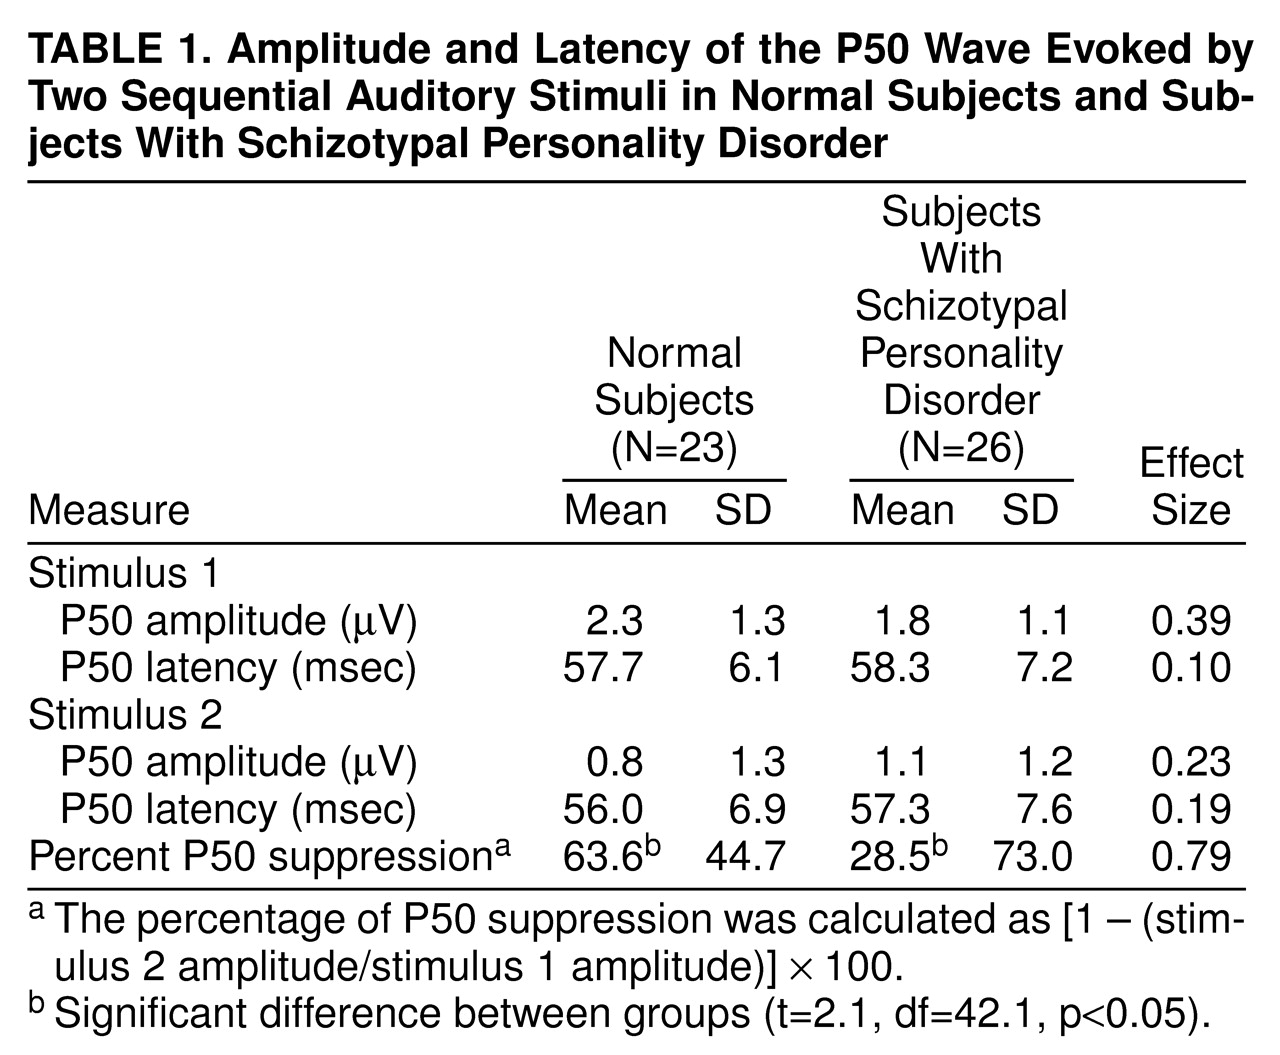
(39). The percentage of P50 suppression was calculated by using the formula [1 – (stimulus 2 amplitude/stimulus 1 amplitude)] × 100. A minimum of –100% suppression (or 100% facilitation) was used to prevent outliers from disproportionately affecting the group means, consistent with the methods of Nagamoto et al.
(38).