fMRI Data
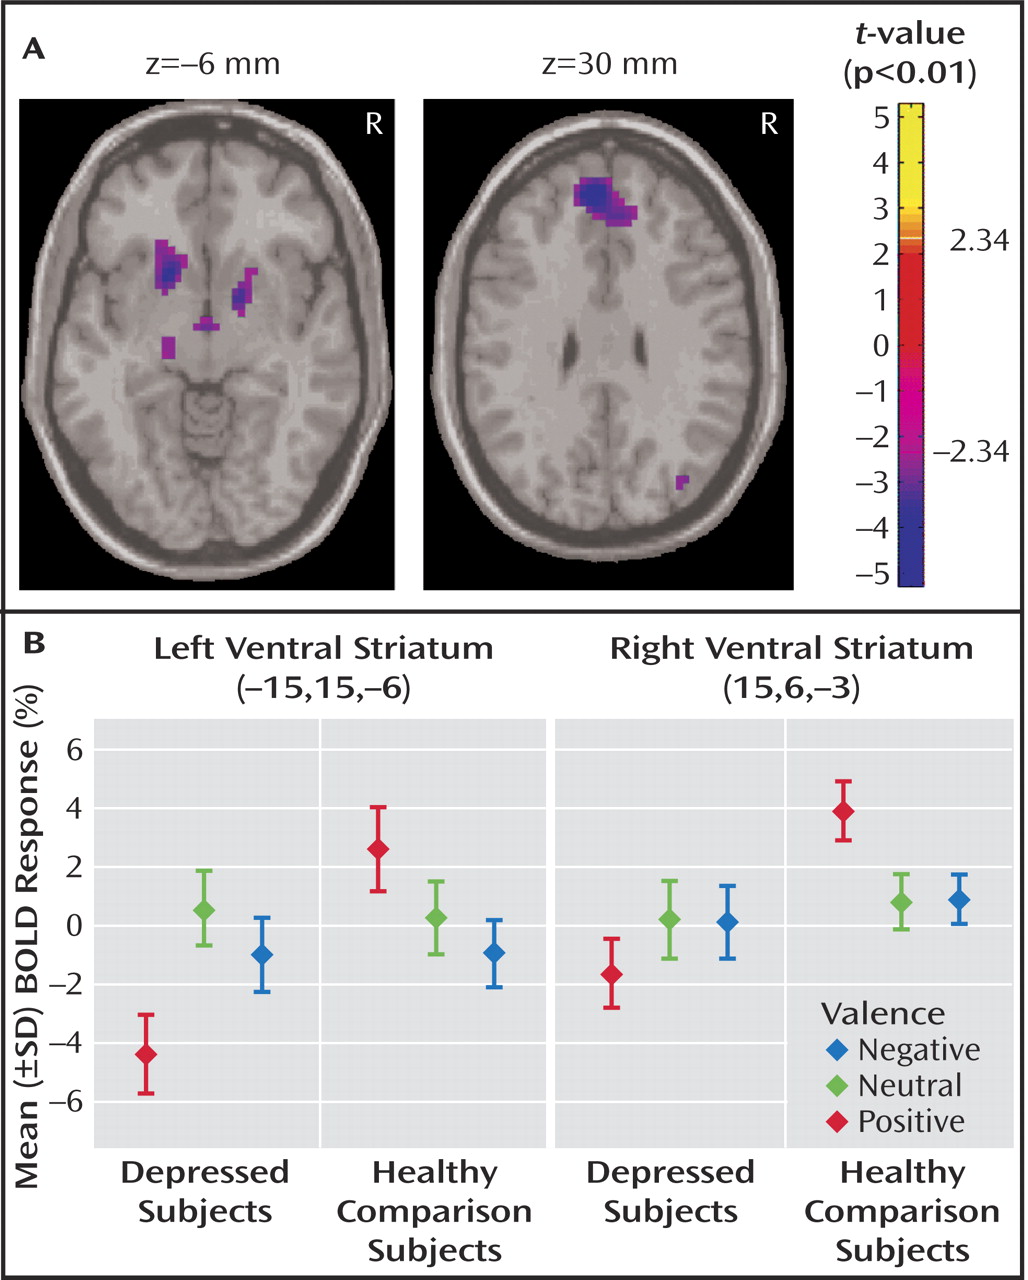
Between-group contrasts revealed significantly less activation to positive stimuli in depressed patients relative to healthy subjects in bilateral ventral striatal regions, including ventral head of caudate and putamen and nucleus accumbens, with the left contrast maximum falling in the region of the nucleus accumbens (right:[15,6, –3], Z=–3.66, voxel-wise p=0.0001, p<0.05 [corrected]; left:[–15,15, –6], Z=–3.52,voxel-wise p=0.0002, p<0.05 [corrected]) (
Figure 1 A). Within-group analyses (reported at the statistical maxima of the between-group findings) revealed that these findings were due to a decrease in activation to positive stimuli in depressed subjects (right: [15, 6, –3], Z= –1.42, p=0.08; left: [–15, 15, –6], Z=–3.23, p=0.004), coupled with an increase in healthy comparison subjects (right:[15, 6, –3], Z=3.75, p<0.0001; left:[–15, 15, –6], z=1.82, p=0.04) (
Figure 1 B). Decreased activity in bilateral ventral striatum was also found in depressed patients relative to healthy comparison subjects in response to positive versus neutral stimuli (right:[15, 9, –3], Z=–2.43,voxel-wise p=0.008; left:[–18, 9, –6], Z=–3.23, voxel-wise p=0.0006, p<0.05 [corrected]). No significant between-group differences in ventral striatal activation were seen in any other contrast. The fMRI data are available as a supplement in the online version of this article.
In order to determine whether the differential response to positive stimuli might be occurring in the setting of differential regional baseline activity, a between-group comparison of regional (relative to global) activity during rest (at the statistical maxima of the between-group finding for the positive condition) was performed by sampling two different time points in the experiment before subjects were exposed to valenced stimuli. The two time points are as follows: 1) before the blood-oxygen-level-dependent response to the initial stimulus began to emerge and 2) at the end of the 24-second rest period following the first neutral presentation block. No significant between-group differences were seen for either comparison (Time point 1: right: [15, 6, –3], Z=–0.27, p=0.40; left: [–15, 15, –6], Z=–0.83, p=0.20. Time point 2: right: [15, 6, –3], Z=–0.40, p=0.35; left: [–15, 15, –6], Z=–0.83, p=0.20). While the analysis does not constitute an integrated measure of baseline activity, it represents a relevant sampling of baseline activity in these subjects before valenced stimuli were delivered, which is useful for interpreting the main finding.
To determine whether the differences displayed between depressed patients and comparison subjects in positive blocks represented prolonged processing of negative stimuli
(27,
40) rather than a differential response to positive stimuli, we examined each block of positive stimuli individually to determine whether a lack of ventral striatal activation in depressed patients, compared with healthy subjects, was observed predominantly following blocks of negative stimuli. No such pattern was revealed. Similarly, because decreases in basal ganglia volumes have been reported in depressed patients
(41), a voxel-based morphometric comparison
(42) of depressed patients relative to comparison subjects was performed. This revealed no significant differences in gray matter volume in ventral striatal regions (right: 15, 6, –3 [Z=–1.01, p=0.16]; left: –15, 15, –6 [Z=–0.33, p=0.37]) that might account for our findings.
A correlation analysis was performed within the depressed group to investigate the association between the blood-oxygen-level-dependent activation levels in depressed subjects in the positive condition and their day-of-scan scores on question 7 of the Hamilton depression scale, which assesses interest and pleasure in and subsequent performance of activities. A significant negative correlation was observed, with those subjects who had higher scores (i.e., less interest/pleasure/performance of activities) showing less activation in bilateral ventral striatal regions (right: 27, 6, –9 [Z=–2.20, p=0.01]; left: –18, 0, –6 [Z= –1.84, p=0.03]). In areas outside the region of interest (at the level of p<0.001), negative correlations with question 7 of the Hamilton depression scale were also found in the left dorsolateral prefrontal cortex (–33, 60, 18) and right frontal operculum (60, 9, 12), while a positive correlation was found in the left posterior cerebellum (–24, –72, –45).
Between-group differences outside the ventral striatum for positive, negative, neutral, positive versus neutral and negative versus neutral contrasts are shown in the Table (available in the online version of this article as a data supplement) and will be commented upon in the discussion section.


