The placebo lead-in phase is common to many efficacy studies of antidepressant medications
(1,
2) . Typically, subjects receive from 3 to 14 days of single-blind treatment with placebo prior to random assignment to placebo or medication. This initial drug-free interval allows for the effects of the test drug to be evaluated without confounds of preexisting medication
(3,
4) . The placebo lead-in phase also has been used to assess symptom stability among subjects who meet initial screening criteria
(5) . Subjects who meet response criteria or exhibit a 20%–25% reduction in symptoms during the lead-in phase are customarily excluded from participation in the postrandomization phase of the trial
(1,
5,
6) .
Among subjects who are retained for participation and randomly assigned to a treatment condition, changes in symptoms during the placebo lead-in phase have been associated with endpoint outcomes. A retrospective analysis of 593 subjects demonstrated that subjects who showed some improvement in depressive symptoms as measured by the Clinical Global Impression improvement ratings
(7) during the placebo lead-in period had a better prognosis, regardless of whether they were assigned to drug or placebo
(2) . Changes in specific somatic complaints during the placebo lead-in period also have been associated with ultimate outcomes. A reanalysis of data from 537 depressed geriatric patients in a placebo-controlled trial of fluoxetine found that headache and somnolence during the lead-in phase were positively associated with response to medication and placebo, respectively
(8) .
Although clinical changes during the lead-in phase have been examined, there have been no reports of brain imaging during the placebo lead-in phase and antidepressant outcomes in clinical trials for major depressive disorder. The vast majority of imaging studies in clinical trials for major depressive disorder have examined brain function at baseline (i.e., before the placebo lead-in phase) and at endpoint. Positron emission tomography (PET), functional magnetic resonance imaging (fMRI), and quantitative electroencephalogram (EEG) techniques have revealed endpoint differences in changes in brain function between responders and nonresponders to pharmacotherapy
(9 –
13), psychotherapy
(10,
14), and placebo
(12,
15) . There is some evidence that changes in brain function precede clinical response in subjects treated with antidepressants. Several studies using quantitative EEG cordance have examined brain function at intermediate points during the treatment trial and have reported that prefrontal changes in theta band activity as early as 48 hours to 2 weeks after the start of medication are associated with final response
(16,
18) . One prior study in healthy subjects suggests that brain functional changes occurring prior to drug onset may be related to later drug effects. In a previous study, we reported an association between changes in prefrontal quantitative EEG cordance that started during the placebo lead-in phase and subsequent side effect burden during treatment with antidepressant medication
(19) .
The relationship between neurophysiological changes during the placebo lead-in period and endpoint clinical outcome in depressed subjects treated with antidepressant medication is unknown. Early postrandomization decreases in prefrontal EEG theta activity have been associated with antidepressant response
(16,
17), and decreases in prefrontal theta cordance during the placebo lead-in phase have been associated with later medication side effects
(19) . These findings suggest that decreases in prefrontal cordance during the placebo lead-in period might predict clinical outcome in major depressive disorder subjects subsequently treated with antidepressant medication. Quantitative EEG theta cordance incorporates absolute and relative EEG power and has demonstrated sensitivity to both changes in depressive symptoms
(15,
16,
18,
20,
21) and to pharmacodynamic effects of antidepressant medication (Leuchter et al., unpublished data). Functionally, quantitative electroencephalographic cordance across all frequency bands has a moderately strong association (r=0.58) with regional cerebral perfusion
(22) . In the prefrontal electrodes specifically, theta surface EEG activity has been associated with activity in underlying anterior cingulate cortex as measured by magnetoencephalography and PET
(23 –
25) . Previous research has linked pretreatment activity in the anterior cingulate cortex with clinical response to antidepressant medication
(26 –
28) . Cordance changes in prefrontal electrodes during the placebo lead-in phase might reflect early modulation of anterior cingulate cortex activity that is related to later outcome.
In this study, we examined the relationship between regional changes in brain function (quantitative EEG theta cordance) during a 1-week placebo lead-in period and final clinical outcome among depressed subjects who were randomly assigned to antidepressant medication. Based upon observations of prior work, we hypothesized that changes in prefrontal cordance during the placebo lead-in phase would be associated with final clinical outcome.
Method
Participants
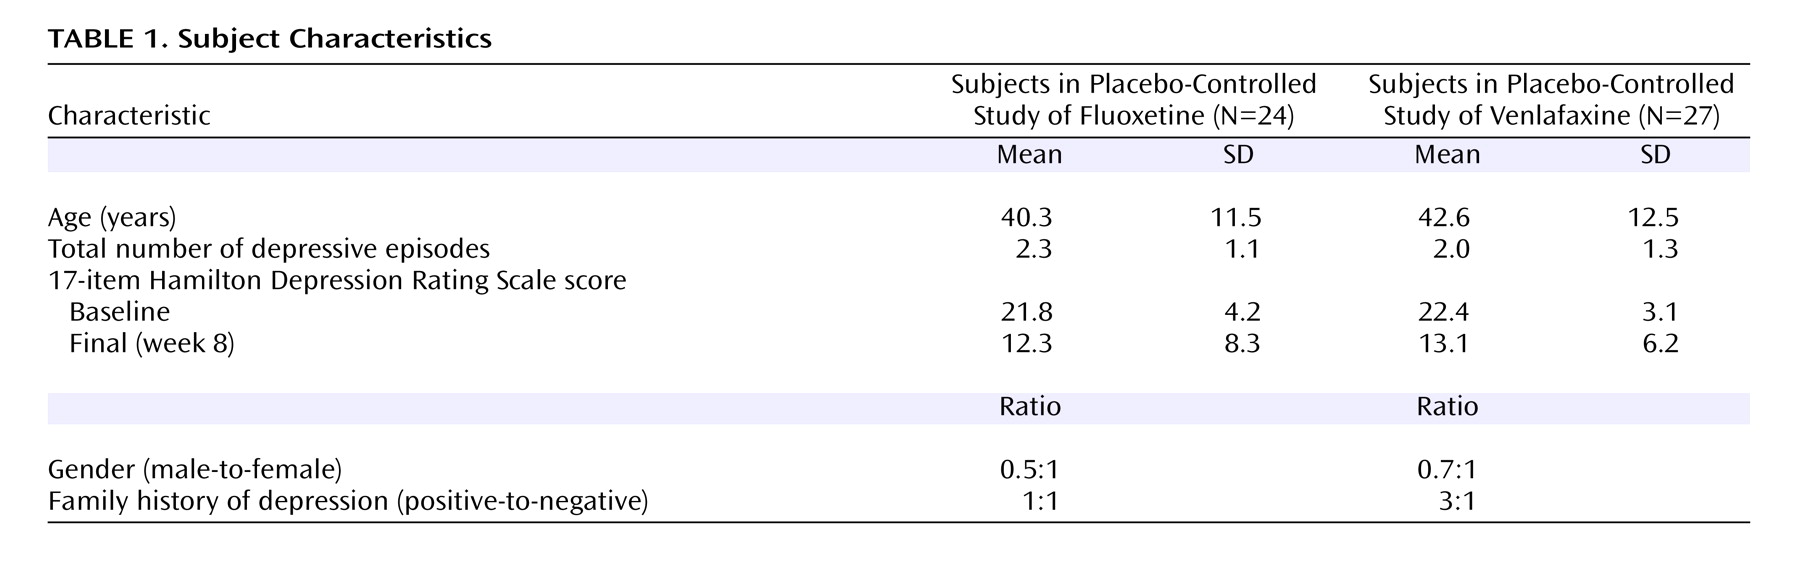
Fifty-one depressed adults participated in one of two independent randomized controlled trials conducted over a period of 24 months at the UCLA Laboratory of Behavior and Pharmacology, an outpatient research facility. Recruitment procedures, inclusion/exclusion criteria, and design features were identical for the two trials except for the medication and dosing. The trials utilized fluoxetine 20 mg (N=24) and venlafaxine 150 mg (N=27), respectively, as the active medication. Participants were recruited from UCLA Neuropsychiatric Hospital outpatient clinics and from community advertisement. All participants were diagnosed with major depressive disorder according to the Structured Clinical Interview for DSM–IV
(29) and had a 17-item Hamilton depression scale score ³16 at study entry. Exclusion criteria were psychotic symptoms, cluster A or B axis II disorders, prior suicidal ideation, or any serious medical conditions known to affect brain function. Subjects were free of psychotropic medications for 2 weeks prior to enrollment, and psychotropic medications other than the study drug were not permitted for the duration of the trial. Subjects enrolled in the two trials did not differ significantly with respect to demographic characteristics, illness history, baseline illness severity, or final response (
Table 1 ) and therefore were pooled for analysis. In total, 25 participants were randomly assigned to medication and 26 to placebo. The UCLA Institutional Review Board reviewed and approved the protocols, and subjects provided written informed consent to participate.
Experimental Procedures
First, all subjects received a single-blind placebo treatment for 1 week. Subjects who met response criteria (Hamilton depression scale scores of ≤10) at the end of the placebo lead-in phase were removed from the study. Immediately following the lead-in phase, eligible subjects were randomly assigned to 8 weeks of double-blind treatment with medication or placebo. Subjects assigned to medication versus placebo did not differ significantly with respect to demographic characteristics or baseline regional measures of cordance. Dosing in the fluoxetine study was 20 mg/day for the entire 8 weeks. In the venlafaxine protocol, the daily dose escalated from 37.5 mg to 150 mg over 10 days. To preserve blinding, medication and placebo were dispensed in identical capsules, and the number of pills was escalated equally in both groups.
Subjects returned for follow-up visits 48 hours after randomization and weekly throughout the treatment phase. During each visit, a research nurse provided subjects with 15–25 minutes of unstructured counseling and problem-solving assistance. These sessions were mandated by the UCLA Institutional Review Board to address safety concerns about dispensing placebo to patients with significant depression. Clinical symptoms were evaluated using the Hamilton depression scale at each visit. At week 8, the blind was broken and subjects were debriefed.
Quantitative EEG Techniques
Recording procedures
EEG measures were obtained at seven time points: enrollment (baseline), end of the 1-week placebo lead-in, 48 hours after randomization, and at 1, 2, 4, and 8 weeks after treatment assignment. Recordings were performed using the QND system (Neurodata, Inc., Pasadena, Calif.), while subjects rested in the eyes-closed, maximally alert state in a sound-attenuated room with subdued lighting using procedures previously described
(15,
16,
22,
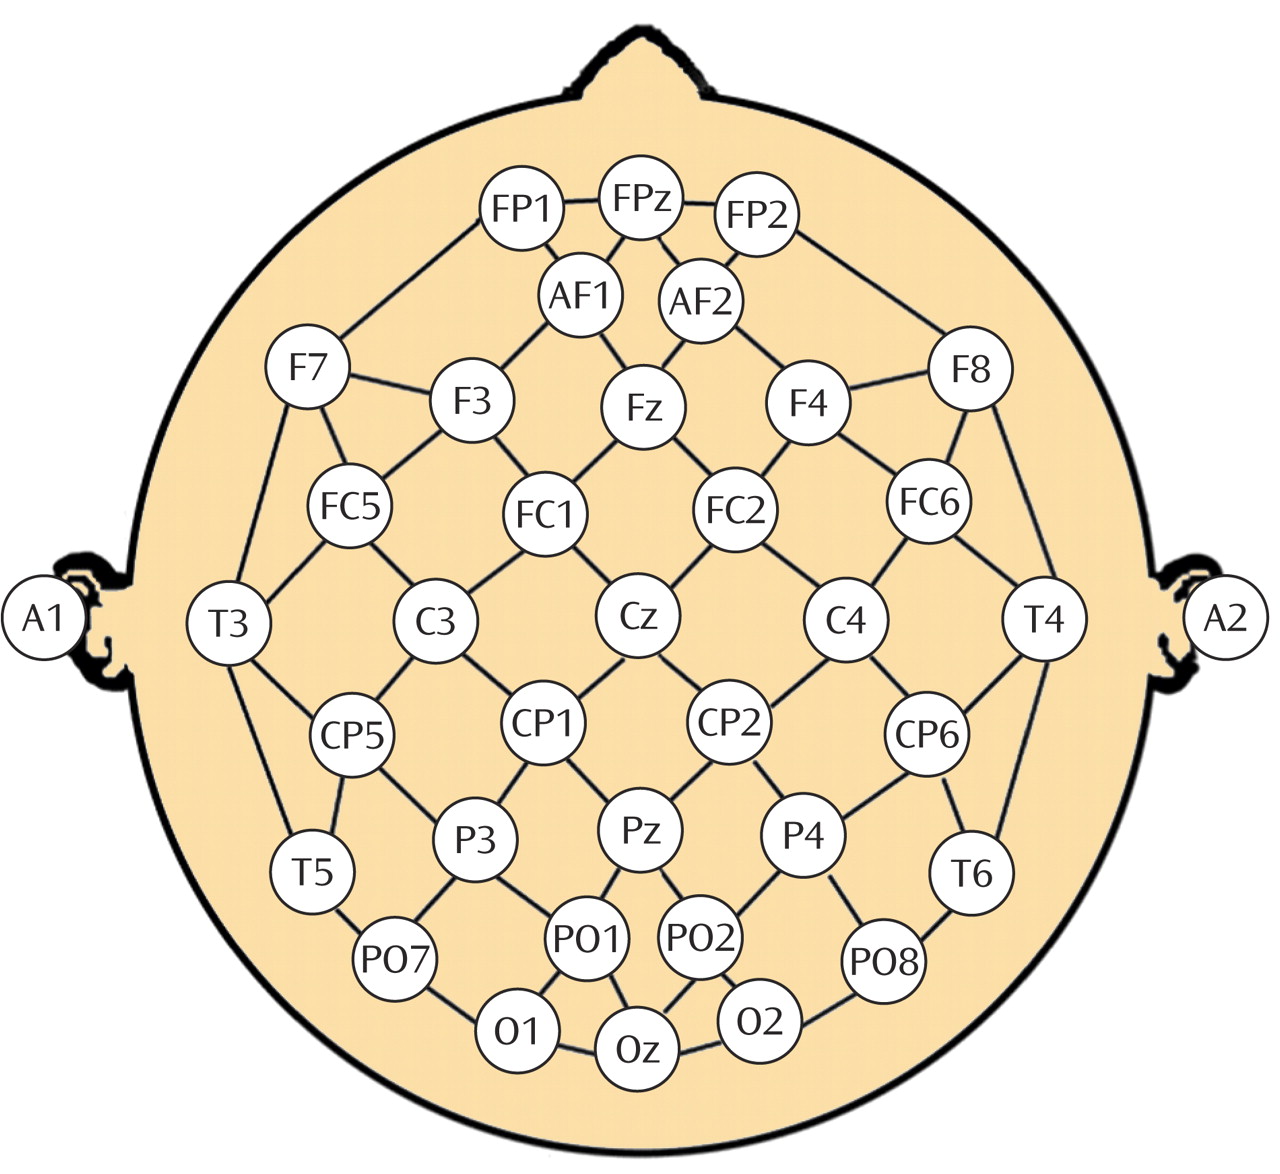
30 –32) . Electrodes were positioned with an electrode cap (ElectroCap, Eaton, Ohio) using an extended international 10–20 system with 35 total recording electrodes (
Figure 1 )
(30) . Right infraorbital and left outer canthus electrodes were used to monitor eye movements. We collected data using a Pz reference montage and digitized the data at 256 samples/channel per second, with a high-frequency filter of 70 Hz and a low-frequency filter of 0.3 Hz. Data were reformatted by amplitude subtraction to construct a linked-ears reference and bipolar channel montages and were reviewed by a technologist for artifacts, including eye and muscle movements. A second technologist blinded to subject identity and treatment condition selected the first 20–32 seconds of artifact-free data for processing. This amount of data may be used to obtain reliable frequency spectra
(32,
33) . Absolute power (the intensity of energy in a frequency band in microvolts squared) was calculated in each of four frequency bands (0.5–4 Hz, 4–8 Hz, 8–12 Hz, and 12–20 Hz) using spectral analysis based on a fast Fourier transform.
Cordance calculations
Conventional quantitative EEG absolute (A) and relative (R) power measures were used to calculate cordance values for each electrode in each of the four frequency bands as described elsewhere
(22) . First, EEG power values were computed using a reattributional electrode montage, yielding a stronger association between EEG and PET measures than traditional reference strategies
(30) . Next, the absolute and relative power values for each electrode site (
s ) in each frequency band (
f ) were z-transformed to measure deviation from the mean values for that recording, yielding A
norm(s,f) and R
norm(s,f), respectively. Last, the z scores were summed to yield a cordance value (Z) for each electrode in each frequency band where Z
(s,f) =A
norm(s,f) + R
norm(s,f) . Analyses were performed on cordance measures from the theta frequency band (4–8 Hz) because previous work from this and other analyses has indicated that energy in the theta band is associated most strongly with changes in depressive symptoms
(16,
18,
34) . We further limited the number of statistical comparisons by grouping electrodes into eight major regions (
Figure 1 ): prefrontal (Fp1, Fpz, Fp2), frontocentral (AF1, AF2), central (FC1, Cz, FC2), left temporal (T3, T5), right temporal (T4, T6), left parietal (P3, CP1, CP5), right parietal (P4, CP2, CP6), and occipital (O1, Oz, O2). Individual cordance values were averaged for electrodes in these groups to create regional measures. Regional changes during the placebo lead-in period were obtained by subtracting baseline cordance from the cordance value at the end of the 1-week placebo lead-in phase for each region.
Data Analysis
We used linear regression to assess the contributions of regional brain changes during the placebo lead-in period to final Hamilton depression scale scores in subjects who were assigned to active medication. Because we hypothesized that changes in the prefrontal region would be associated with the final outcome, the prefrontal variable was entered into the regression analysis first. In the next step, we entered the remaining seven regions using forward selection to assess whether other brain regions might predict outcome and, if so, to evaluate their relative contributions.
In addition, we conducted an analysis in the placebo group to explore relationships between regional brain changes during the placebo lead-in phase and final Hamilton depression scale scores. Because this analysis was not hypothesis-driven, all brain regions were entered in one block using forward selection.
Finally, we conducted a regression analysis on all subjects combined to test for potential interactions between treatment group assignment (medication or placebo) and brain region. In this analysis, we added the eight interaction terms into the model to examine whether any relationships between brain region and final Hamilton depression scale scores were moderated by group assignment.
Results
Medication Group Analysis
Changes in prefrontal cordance during the placebo lead-in phase were significantly associated with final Hamilton depression scale scores for subjects randomized to medication (F=5.28, df=1, 23, p=0.03). Decreases in prefrontal cordance were associated with lower final Hamilton depression scale scores. No other regions entered the second step of the model. The R
2 value was 0.187, indicating that approximately 19% of the variance in final Hamilton depression scale scores was explained by changes in prefrontal cordance at the end of the placebo lead-in period. The effect size was 0.23. According to Cohen
(35), this effect size falls between medium (0.15) and large (0.35).
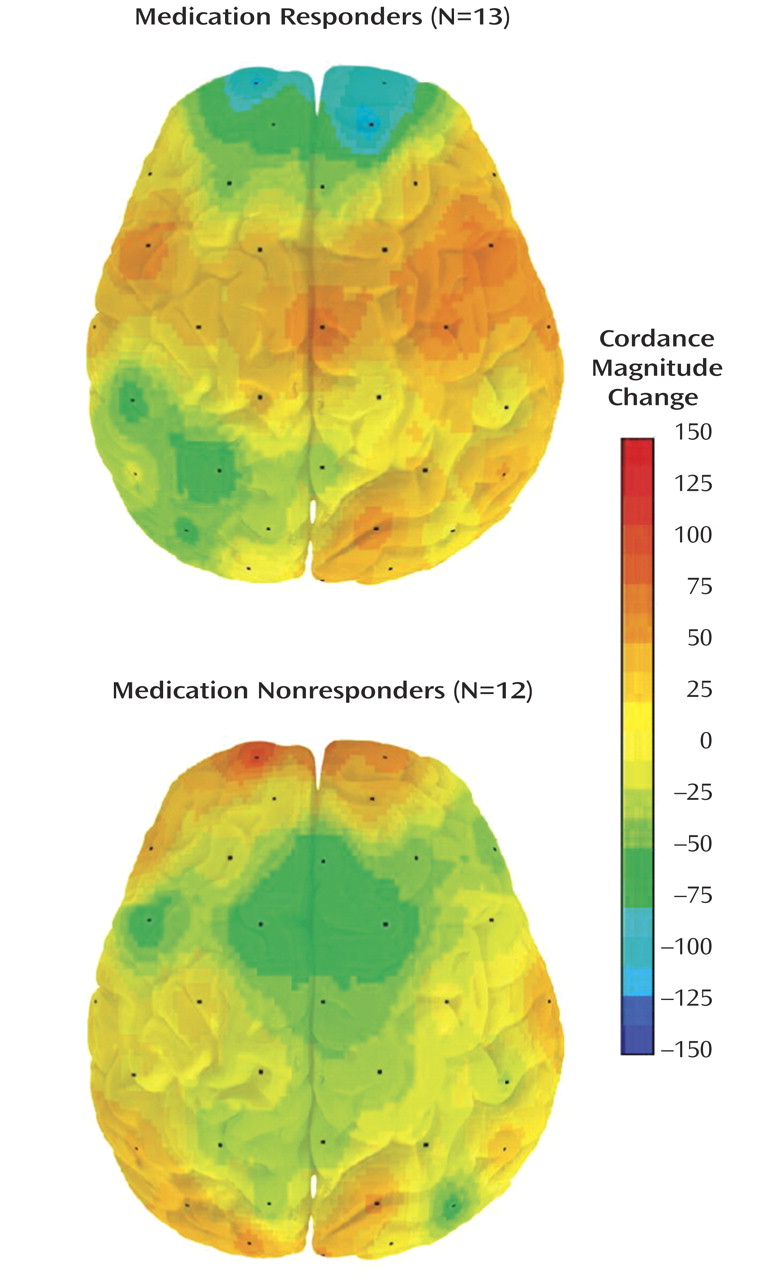
In order to illustrate brain changes associated with final outcome during the placebo lead-in phase, we mapped cordance changes during the lead-in phase for subjects grouped as medication responders (final Hamilton depression scale scores ≤10) or medication nonresponders. Medication responders versus nonresponders differed significantly with respect to changes in the prefrontal region during the lead-in period (t=2.81, df=23, p=0.01) (
Figure 2 ).
Placebo Group Analysis
In the placebo group, only the right temporal region entered the model (F=5.88, df=1, 24, p=0.02). Increases in right temporal cordance corresponded to lower final Hamilton depression scale scores. The R 2 value was 0.197, indicating that approximately 20% of the variance in the final Hamilton depression scale scores for the placebo group was explained by changes in the right temporal cordance at the end of the placebo lead-in phase.
Testing for Interaction Effects
Because the regression analyses of the medication and placebo groups yielded different brain regional changes associated with outcome, we evaluated potential interactions between regional brain changes and the two groups using a follow-up regression analysis that included interaction terms for each of the eight brain regions. The regression analysis of interaction terms did not reveal any significant interactions. Group changes did not interact significantly with changes in the prefrontal region (t=0.45, df=43, p=0.66) or the right temporal region (t=–0.50, df=43, p=0.62).
Discussion
This is the first study to examine the relationship between changes in brain function during the placebo lead-in phase and endpoint medication outcome. As hypothesized, decreases in prefrontal cordance during the placebo lead-in phase were associated with lower endpoint Hamilton depression scale scores in depressed subjects randomly assigned to antidepressant medication. Nineteen percent of the variance in clinical outcome in medication-treated subjects was predicted by neurophysiological changes occurring during the placebo lead-in phase, prior to the beginning of medication.
Why might neurophysiological changes during the placebo lead-in period be related to outcome? The placebo lead-in phase introduces a myriad of treatment-related factors, including exposure to the treatment milieu, interactions with study personnel, structured assessment, and pill administration. The initial experience of these factors may shape patient expectations and interpersonal relationships with treatment providers. Prior work has demonstrated that perceptions of the pharmacotherapeutic alliance
(36) and pretreatment expectations of outcome
(37) are important to pharmacotherapy outcomes in major depressive disorder. Expectations during the lead-in phase may be related specifically to receiving a pill. Cultural differences
(38) and past experiences with medications could explain different beliefs and expectations aroused during the initial treatment with placebo. Individual differences in any of these factors could explain both differences in brain functional changes during the lead-in phase and differences in clinical outcome. In addition, antidepressant treatment history could influence patient expectations and neurophysiological changes during the placebo lead-in phase via classical conditioning. Prior experience with an active drug can produce conditioned responses during subsequent administration of placebo
(39) . Moreover, brain changes during the lead-in phase could be influenced by genetic differences or stage or course of illness.
Regional quantitative EEG neurophysiological measures taken prior to medication may prove useful in predicting eventual clinical outcomes. Previous work has linked pretreatment baseline hyperactivation of the rostral anterior cingulate cortex (Brodmann’s areas 24 and 32) as measured by PET
(26) and EEG theta
(27,
28) to antidepressant response. Our measure of the changes in prefrontal theta cordance might have reflected changes in underlying anterior cingulate cortex. Prior work has shown a positive association between theta activity recorded from prefrontal surface electrodes and activity in the anterior cingulate cortex as measured by magnetoencephalography
(23,
24) and PET
(25) . Although our measures do not discriminate anterior cingulate cortex or its subdivisions, other studies have put forth functional neuroanatomical models specifically relating rostral anterior cingulate activity to treatment response (27, 40, 41).
The present finding has implications for interpreting other studies that examine changes in brain function associated with antidepressant outcomes in clinical trial settings. Most previous studies have examined brain changes occurring after the start of medication as compared to a pretreatment baseline, without concern for the placebo lead-in phase. Brain changes during the placebo lead-in phase may confound apparent medication effects associated with clinical outcomes in medication-treated subjects. In our study, the relationship between changes in prefrontal function during the placebo lead-in period and medication outcome suggests that some neurophysiological changes that are associated with endpoint antidepressant outcome reflect nonpharmacodynamic factors. Decreases in prefrontal cordance at the end of the placebo lead-in phase clearly were not an effect of medication; rather, this prerandomization neurophysiological change appeared to predict later response in the medication group. One strategy to separate neurophysiological changes that are purely nonpharmacodynamic from those that have a pharmacodynamic component would be to examine changes in brain function occurring at two intervals: 1) from pretreatment baseline to the end of the placebo lead-in phase and 2) from the end of the placebo lead-in phase to postrandomization time points. Although brain changes during the placebo lead-in phase are necessarily nonpharmacodynamic, the examination of brain changes from the end of lead-in period to postrandomization time points might reveal distinct neurophysiological changes that occur with drug onset.
Our exploratory analysis of subjects randomly assigned to placebo revealed that increases in right temporal cordance during the lead-in phase predicted 20% of the variance in final Hamilton depression scale scores. Changes in this brain region are interesting in light of prior work that has related temporal lobe abnormalities to major depressive disorder
(42 –
44) . Although the placebo and medication group analyses yielded different brain regional predictors of outcome, because of the absence of a statistical group interaction we cannot conclude that changes in the right temporal region versus the prefrontal region differentially predicted outcomes of placebo versus medication. The relationship between changes in right temporal activity and treatment outcome merits further study
(42) .
Several limitations of this study should be noted. First, because of the small sample size and relatively large number of predictor variables, future studies are necessary in order to corroborate our findings. Second, the study pooled subjects from two clinical trials using different antidepressant medications (venlafaxine, a mixed-action reuptake inhibitor, and fluoxetine, a selective serotonin reuptake inhibitor); changes in brain function during the placebo lead-in phase might differentially predict response to different classes of medication. Third, we were unable to determine the extent to which brain functional changes during the placebo lead-in period were influenced by placebo administration or other factors during the lead-in phase. Fourth, treatment outcome may have been influenced by other factors in addition to medication or placebo, such as the brief sessions with the research nurse. Fifth, because quantitative EEG cannot localize brain function with the same accuracy of other imaging techniques, other methods are needed to distinguish brain functional changes in the cortical and deep brain areas.
Conclusion and Future Directions
This study found that regional changes in brain function during the placebo lead-in phase were associated with clinical outcome in major depressive disorder subjects randomly assigned to antidepressant medication. Ultimate clinical outcome appeared to be predicted in part by neurophysiological changes that occurred during the first week of the clinical trial, in the absence of drug treatment, during the placebo lead-in phase. Future studies should examine how brain changes during the lead-in period may be associated with patient expectations, the therapeutic relationship, and treatment history.