Enrollment
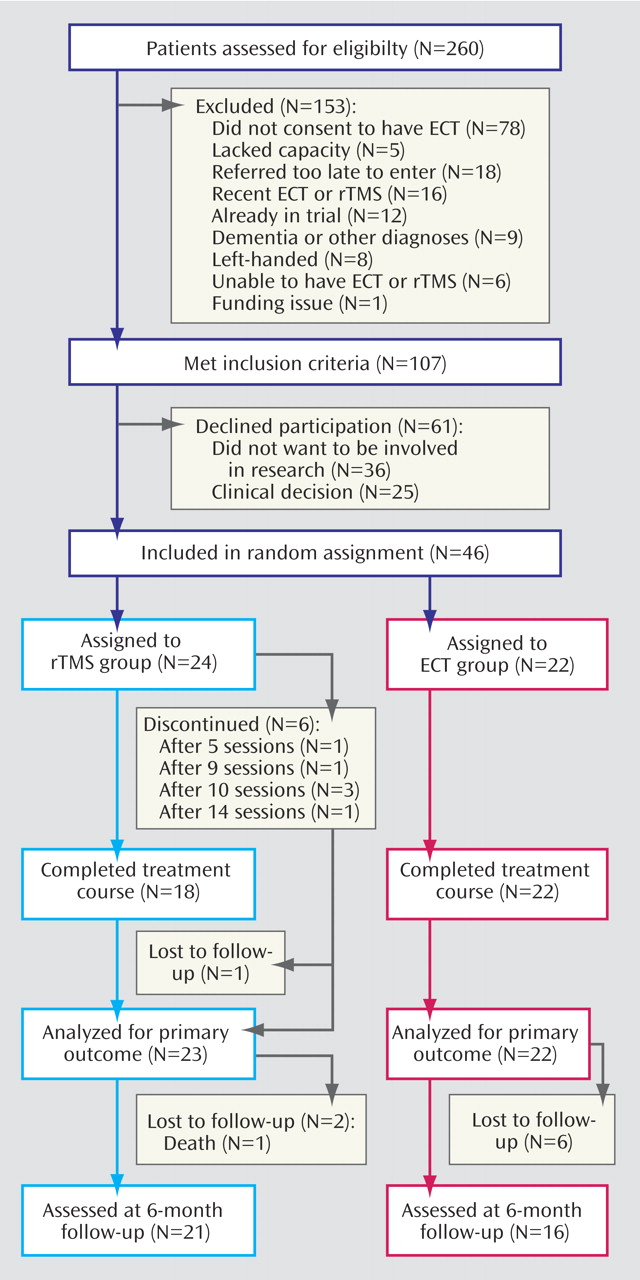
The trial profile is shown in
Figure 1 . Of 260 patients referred for ECT, 107 were eligible depressed patients. The most common reason for exclusion was not consenting to ECT while being formally treated in accordance with the U.K. Mental Health Act 1983. Of those eligible, 46 (43.0%) consented to enter the study. There was no statistical difference in mean age or sex ratio between the eligible patients who consented and those who declined to participate. Five patients in the rTMS group terminated treatment early, having 10 or fewer sessions, because they believed they were not improving, and one patient could not attend the 15th session; all but one agreed to end-of-treatment assessments. The rTMS treatments were well tolerated by all patients, and nobody dropped out because of pain at the stimulation site. None of the ECT patients dropped out at this stage. In the ECT group, 18 (81.8%) had bilateral and four (18.2%) had unilateral ECT. The mean number of rTMS sessions was 13.7 (SD=2.7, range=5–15), while the mean number of ECT sessions was 6.3 (SD=2.5, range=2–10). The mean rTMS dose was 67% (SD=11) of the maximum output of the stimulator. The course durations (days from first to last treatment) were comparable for ECT (mean=22.4, SD=12.7) and rTMS (mean=19.5, SD=6.3).
Rater treatment guesses were unavailable for eight patients. Of the remaining 38, five had inadvertently informed the raters and the raters guessed correctly for 30 (92.1%). The extent of response was the main reason given for the correct guess. After 6 months, 21 (87.5%) of the rTMS patients and 16 (72.7%) of the ECT patients agreed to follow-up. The main reason for not agreeing was unwillingness to be interviewed again. Five (20.8%) of the patients randomly assigned to rTMS (who received nine, 10, 14, 15, and 15 sessions) crossed over to ECT after the end-of-treatment assessments but were initially analyzed in the rTMS group.
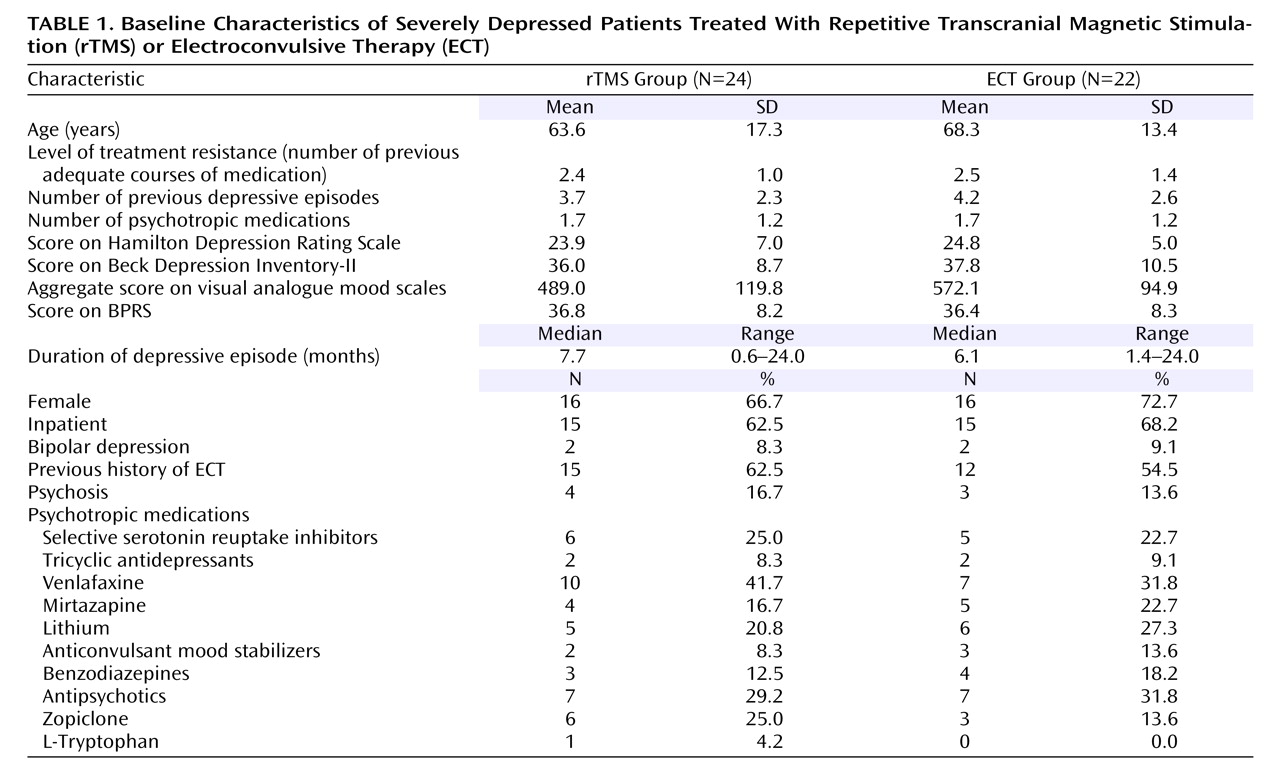
Table 1 summarizes demographic and clinical baseline information. At randomization the two treatment groups were similar on most measures.
Primary Outcome
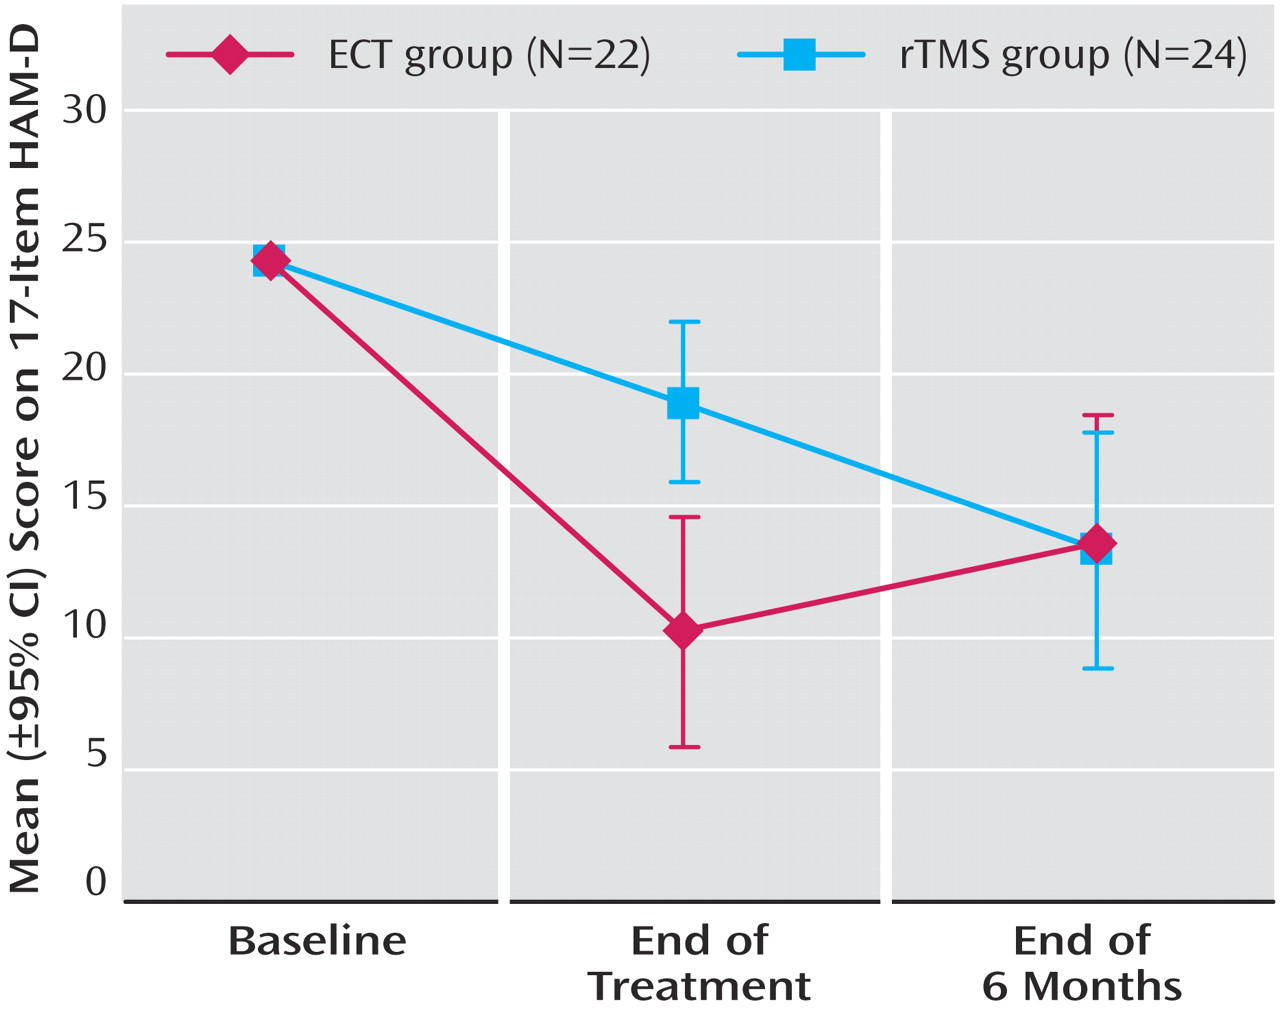
Changes in HAM-D scores over time are illustrated in
Figure 2 . The posttreatment group difference varied significantly with assessment point (group-by-time interaction: F=6.20, df=1, 45, p=0.02). Post hoc tests showed that the end-of-treatment HAM-D scores were significantly lower in the ECT group than in the rTMS group (F=10.89, df=1, 45, 95% CI for difference=3.40 to 14.05, p=0.002), demonstrating a strong standardized effect size of 1.44. However, at the 6-month follow-up, the HAM-D scores did not differ between groups (F=0.01, df=1, 45, 95% CI= –6.92 to 6.33, p=0.93). At the end of treatment, 13 patients (59.1%) in the ECT group met the remission criterion (HAM-D score of 8 or lower), while only four (16.7%) did in the rTMS group (Fisher’s exact test, p=0.006). Thirteen patients (59.1%) in the ECT group and four (16.7%) in the rTMS group were deemed responders (Fisher’s exact test, p=0.006). Of those who agreed to follow-up assessment after 6 months, six of 12 ECT patients with remissions and two of the four rTMS patients with remissions continued to meet the remission criterion.
Psychosis and older age have been reported to be negative indicators for response to rTMS
(8,
28) . Anticonvulsant mood stabilizers and benzodiazepines might also affect response
(29) . We therefore performed analyses examining whether adding interactions between treatment and psychosis, treatment and age, and treatment and anticonvulsants/benzodiazepines had a significant effect on the model for primary outcome. There was no evidence at the 5% level to suggest that the effect on HAM-D score was modified by the interaction of treatment type with psychosis (F=3.76, df=1, 45, p=0.06), with age (F=2.76, df=1, 45, p=0.10), or with anticonvulsant or benzodiazepine treatment (F=0.88, df=1, 45, p=0.35). When the subjects with psychosis were excluded from the analysis, 12 (63.2%) of the 19 subjects in the ECT group and three (15.8%) of the 19 in the rTMS group met the remission criterion at the end of treatment (Fisher’s exact test, p=0.007); 13 subjects (68.4%) in the ECT group and four (21.1%) in the rTMS group were responders (Fisher’s exact test, p=0.02).
In addition to intention-to-treat analyses, a received-treatment analysis was performed as a sensitivity analysis, but this did not affect the primary outcome. This excluded the five patients in the rTMS group who had 10 or fewer rTMS sessions and took into account the crossover of five rTMS patients to the ECT group before the 6-month follow-up.
The mean reduction in score on the HAM-D achieved at the end of treatment, in relation to the adjusted baseline, was 14.1 points for ECT and 5.4 for rTMS. This translates into mean percentage reductions from baseline of 58% and 22%, respectively. The absolute difference in percentage reduction from baseline was therefore 36% (95% CI=14% to 58%). This point estimate lies considerably outside the predefined equivalence range (i.e., up to 18.1 percentage points), and so does almost all of the respective confidence interval, with only a small fraction of the confidence range (from 14% to 18.1%) falling into the predefined equivalence range. The rTMS treatment effect was therefore statistically significantly worse than that of ECT, and it was at least 14 percentage points worse.
