The study of spontaneous neural activity during sleep offers some important advantages for investigating brain function in subjects with schizophrenia. Sleep recordings minimize possible confounding factors related to waking activities, including changes in the level of attention, decreased motivation or cognitive capacity, and the presence of active symptoms. The two main sleep rhythms—slow waves and spindles—reflect the basic working of thalamocortical circuits and their modulation by monoaminergic systems
(1) . Thus, alterations of slow waves or sleep spindles could be sensitive indicators of thalamocortical and neuromodulatory dysfunction in schizophrenia.
In the past, EEG studies have focused on the overall architecture of sleep in schizophrenia populations
(2,
3) . Several studies have reported a reduction of slow-wave sleep (sleep stages 3 and 4), which was correlated with age, severity of negative symptoms, duration of illness, and electrode placement
(3) and could be reversed by atypical antipsychotics
(4) . Probably because of heterogeneity in patient selection, symptoms, and duration of illness, reductions in slow-wave sleep were not observed in all studies nor were they necessarily specific for schizophrenia, because they also appear in major depression and other psychiatric disorders
(2,
3) .
Only a few studies have gone beyond sleep architecture
(5 –
7) . Keshavan et al.
(6) found reductions in the delta (1–4 Hz) and theta (4–8 Hz) frequency bands in schizophrenia in relation to comparison subjects. Hiatt et al.
(5) also reported reduced delta frequency activity, along with increased spindle counts in 10-minute segments from the middle of non-REM sleep periods in five unmedicated schizophrenia patients
(5) . In contrast, Poulin et al.
(7) did not find changes in spindle density in the 12–14 Hz range during stage 2 sleep. Again, the differences between studies may reflect heterogeneity in subject populations, especially in the study with the smallest group size (N=5)
(5), as well as differences in electrode placement.
The much greater spatial resolution afforded by high-density EEG imaging is especially well-suited to investigating localized changes in the main sleep rhythms
(8) and thereby revealing possible neurobiological abnormalities in schizophrenia. Slow waves (1–4 Hz) are generated primarily by corticocortical circuits and provide a measure of sleep homeostasis
(9) . Sleep spindles are initiated by a deep brain structure, the thalamic reticular nucleus
(1), in connection with principal thalamic nuclei and are synchronized by corticocortical, corticothalamic, and thalamocortical loops
(10) . Of importance, abnormalities in these thalamocortical structures have been implicated in the neurobiology of schizophrenia
(11 –
15) . Moreover, neuromodulatory systems that affect the function of these thalamocortical circuits as well as the generation of sleep rhythms, such as norepinephrine
(16), serotonin
(17), acetylcholine
(18), and γ-aminobutyric acid (GABA)
(10), are also altered in schizophrenia
(13 –
19) .
In the present study, we employed a high-density EEG system (256 channels) to investigate EEG power as well as slow waves and spindles during the first non-REM sleep episode in medicated schizophrenia subjects, in subjects with past or current depression, and in healthy comparison subjects. We found a pronounced deficit in spindle range EEG power in the schizophrenia group, which was most evident at centroparietal locations. Further analysis demonstrated that this power deficit was due to a marked reduction in the number, duration, and amplitude of sleep spindles. Furthermore, integrated spindle activity, a parameter calculated by integrating spindle amplitude over time, was able to clearly separate most schizophrenia subjects in our study population from comparison and depression subjects.
Method
Participants
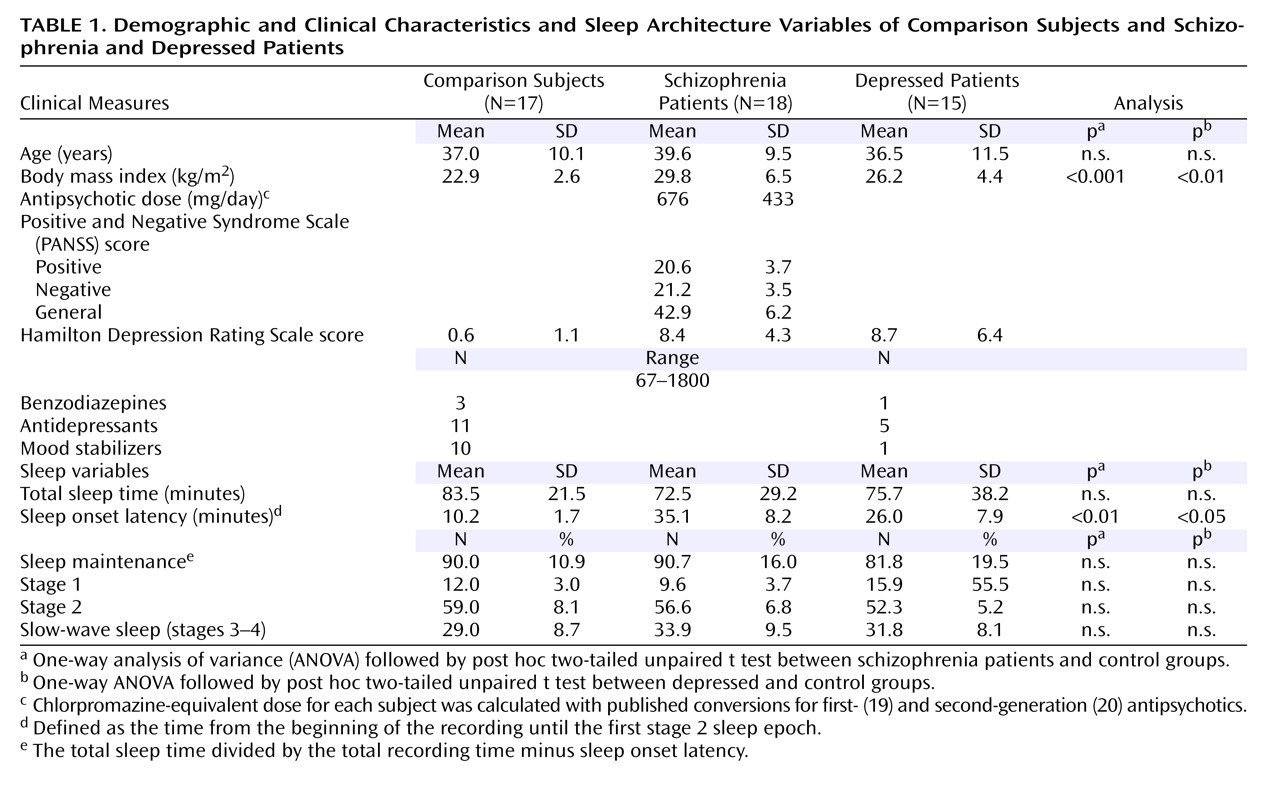
Seventeen healthy subjects (five women), 18 subjects with schizophrenia (five women), and 15 subjects with a history of depression (seven women) participated in the study (
Table 1 ). A psychiatrist interviewed all participants to obtain a complete psychiatric and medical history and to rigorously exclude (comparison) or confirm psychiatric diagnosis (schizophrenia or depression) based on DSM-IV-TR criteria. The Structured Clinical Interview for DSM-IV (SCID)
(21) and the 17-question Hamilton Depression Rating Scale (HAM-D)
(22) were compiled based on the clinical interview and the Mini-International Neuropsychiatric Interview
(23) . The schizophrenia subjects were further evaluated with the Positive and Negative Syndrome Scale (PANSS)
(24) . The participants were recruited from local mental health providers or by advertisements in a local newspaper. All subjects were between 18 and 55 years of age. They were excluded if they had substance abuse or dependence within the last 6 months, an identifiable neurological disorder, insulin-dependent diabetes, a recent heart attack or cancer, or a diagnosed sleep disorder; had worked night shifts; or had traveled across time zones in the last month. The healthy subjects were excluded if they were taking psychotropic medications or had first-degree relatives with psychiatric diagnoses.
The schizophrenia participants were diagnosed primarily as paranoid subtype (N=12), with the remainder diagnosed as having disorganized (N=2) or residual subtypes (N=4). Each was receiving second-generation (N=15), first- and second-generation (N=2), or first-generation (N=1) antipsychotics. In addition, there were three subjects receiving benzodiazepines, 11 receiving antidepressants, and 10 receiving mood stabilizers (of different classes). All were outpatients with a stable chronic illness with a mean duration of 16.7 (SD=7.7) years and a mean total PANSS score of 84.8 (SD=11.7) (
Table 1 ).
The depression subjects were confirmed to have a history of current or previous major depressive episode (DSM-IV-TR). Thirteen (of 15) subjects had a history of recurrent episodes. None reported past or current psychotic symptoms. Current symptoms were rated on the HAM-D. At the time of the recording, seven subjects were in remission (HAM-D score ≤7), six had mild to moderate depression (HAM-D score=8–19), and two had severe depression (HAM-D ≥20). There was one subject receiving benzodiazepines, five receiving antidepressants, and one receiving a mood stabilizer. None were taking antipsychotic medications.
The study was approved by the University of Wisconsin’s institutional review board. After a complete description of the study was given to the subjects, written informed consent was obtained.
Sleep Recordings
Sleep high-density EEGs were recorded with a 256-electrode net (Electrical Geodesics, Inc., Eugene, Ore.) during the first sleep episode of the night. A special net with spongeless electrodes filled with conductive gel was employed to improve contact with the skin and increase the stability of the net during the recording. Because of technical limitations with available high-density EEG electrodes, it was usually not possible to record a full night of sleep. The participants were placed in a comfortable room and allowed to sleep at their self-reported bedtime until the first REM sleep epochs, or until they awoke and did not return to sleep.
EEG Analysis
The signals were high-pass filtered (0.5 Hz), low-pass filtered (50 Hz), and digitized at 500 Hz. After exclusion of 60 electrodes located on the neck or face and rejection of noisy channels, 178–186 EEG channels per subject were retained. Sleep stages were visually scored for 20-second epochs on the EEG referenced to the mastoid (C3A2 and C4A1 derivations). Artifacts were visually excluded on a 4-second basis during the scoring
(25) . Additional artifacts were discarded by excluding 4-second sleep epochs whose power exceeded a threshold based on a mean power value in the 0.75–4.50 Hz and 20–30 Hz bands. Furthermore, some channels were rejected based on high impedance value (>200 KOhms). Signals were then re-referenced to the average of the signals recorded from included channels. This montage was used for computing power spectra of all non-REM sleep epochs (fast-Fourier transform routine, Hanning window averages of five 4-second epochs) (9, 25).
Spindle Detection and Analysis
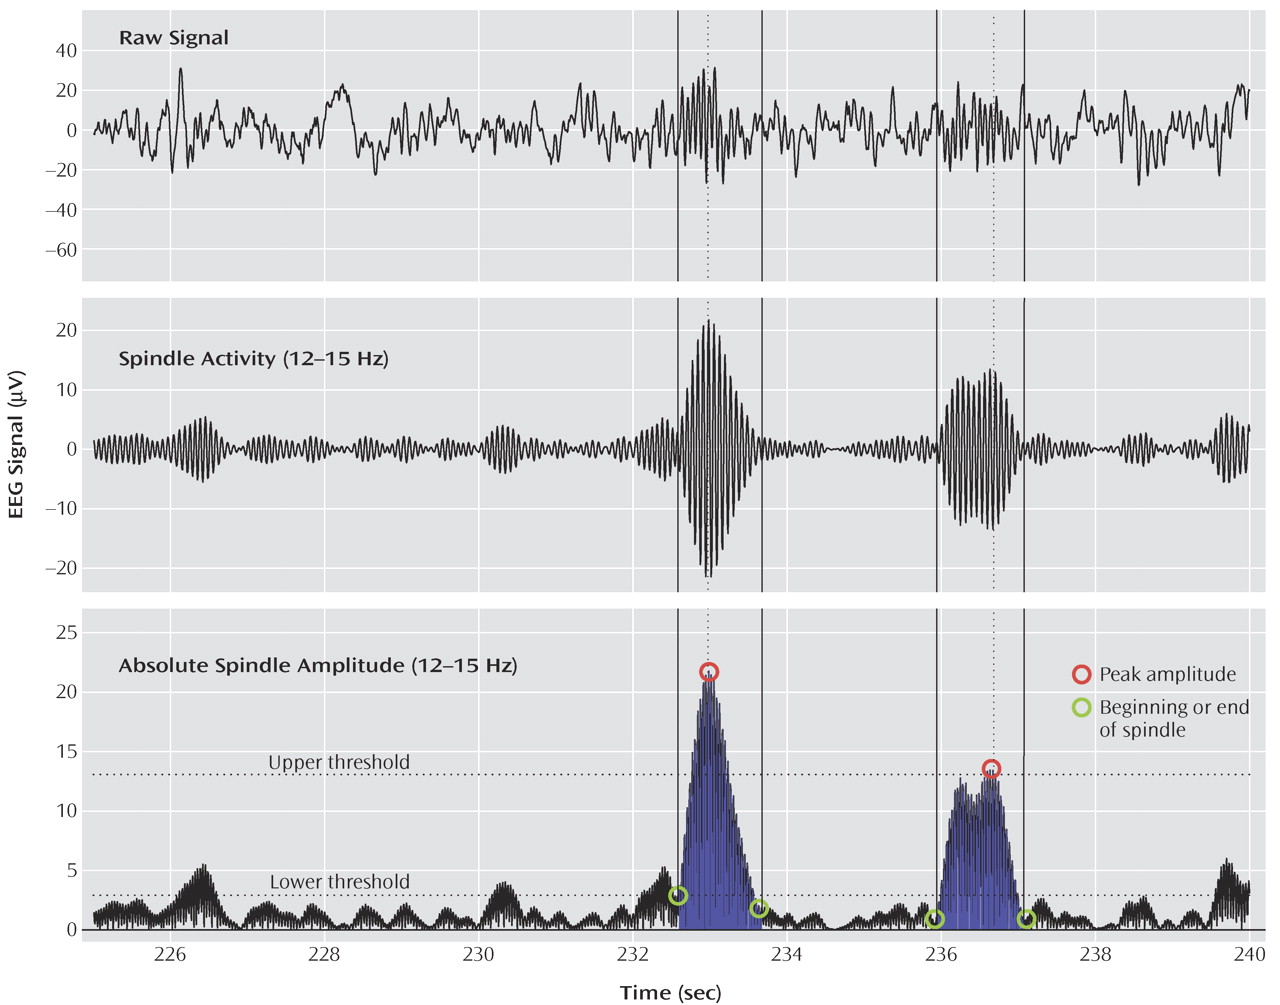
Figure 1 illustrates the spindle detection procedure. The EEG data for all non-REM sleep epochs were band-pass filtered between 12 and 15 Hz (–3 dB at 12 and 15 Hz). The amplitude of the rectified filtered signal was used as a new time series for each channel. Because signal amplitude varied significantly between channels, thresholds relative to mean signal amplitude were used. If an amplitude fluctuation in this new time series exceeded an upper threshold, it was considered a spindle. The peak amplitude for each spindle was defined as the local maximum above the threshold. The beginning and end of the spindle were defined as the points immediately preceding or following this peak, when the amplitude of the time series dropped below a lower threshold. To visually evaluate each spindle detected by this algorithm, the raw signal for each channel was displayed with the band-pass filtered signal in consecutive 20-second sleep epochs. The lower and upper thresholds were set at two and eight times the average amplitude, respectively, of the entire time series for each channel. These thresholds were selected to yield the best possible match between visual and automatic spindle detection. The reliability of our method was tested by analyzing the band-pass filtered (12–15 Hz) and rectified signal from the Cz derivation with another algorithm employing a fixed amplitude threshold
(26) . For this derivation, the comparison between the two methods yielded similar results.
For all detected spindles, three parameters were investigated: duration, maximal amplitude, and number. A fourth parameter, integrated spindle activity, was calculated by integrating the absolute amplitude values of each spindle detected at every electrode, divided by the non-REM sleep duration.
Statistics
We compared demographic characteristics, sleep architecture, sleep EEG power spectra, and spindle parameters between groups with one- and two-way analyses of variance (ANOVAs) with Bonferroni correction for multiple comparisons, followed by post hoc two-tailed unpaired t tests.
To assess the significance of group differences in EEG power, we employed statistical nonparametric mapping, adapted to account for multiple groups
(27) . We performed 32,000 of over 10
22 possible permutations. In each permutation, the subjects from the original groups (comparison, schizophrenia, and depression) were randomly selected to form three new groups of mixed composition, with the same total number of subjects per group. For each permutation, we calculated a one-way ANOVA and obtained a t value for each electrode. Over all electrodes, we selected the maximal t value. The 95th percentile of these selected t values from all performed permutations determined the significant t value threshold. Any electrode in the comparison between the three original groups showing a t value exceeding the obtained threshold was considered to be significant. Once it was established that there were significantly different electrodes in the three-group comparison, post hoc nonparametric simple-threshold permutation tests were performed for comparisons between each pair of groups.
For some parameters, we calculated Cohen’s d to determine effect sizes
(28) . Cohen’s d values indicate how different a parameter of interest is between groups (effect size) and how well this parameter discriminates between groups (percentage of nonoverlap between groups).
Results
Subject Characteristics
Subject demographic characteristics, symptom ratings, and other clinical characteristics did not differ across populations except for body mass index, which was higher in both the schizophrenia and the depression group than in the comparison group (ANOVA: F=9.2, df=2, 47, p<0.001) (
Table 1 ).
Sleep Architecture
We found that total sleep time, time spent in each sleep stage, and sleep maintenance were not different among the three groups (
Table 1 ) (ANOVA: F<1.9, df=2, 47, p>0.16). However, we found a significant change in sleep onset latency (F=4.2, df=2, 47, p<0.05). Post hoc t tests showed increased sleep onset latency in both schizophrenia (p<0.01) and depression (p<0.05) subjects in relation to comparison subjects.
EEG Power Analysis
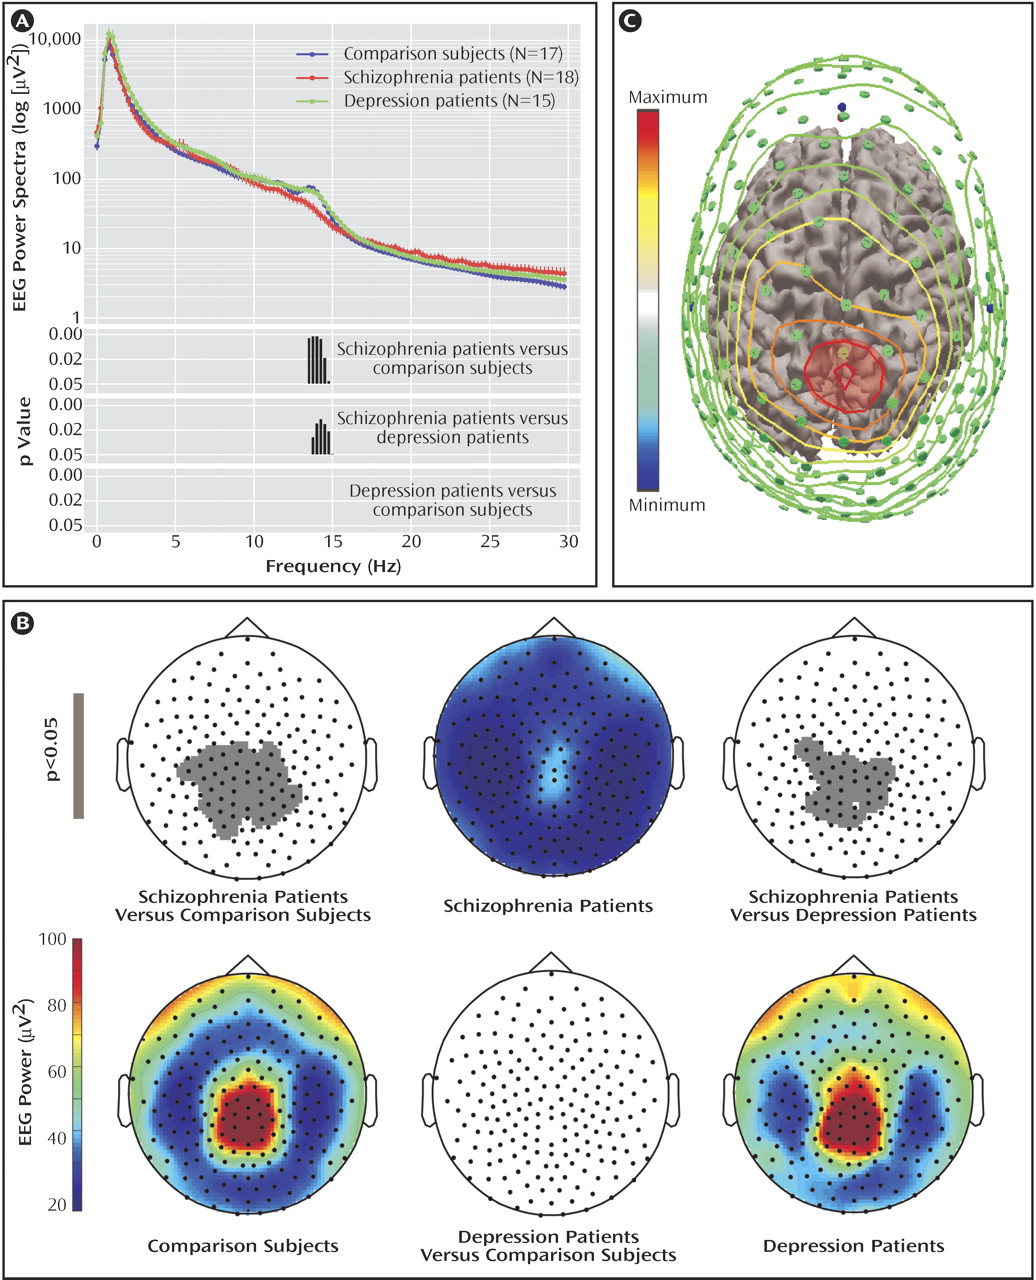
We performed an exploratory analysis of the EEG power for non-REM stages 2–4 in the 0.75–40.00 Hz frequency range by considering the classic EEG frequency bands (delta: 1–4 Hz, theta: 5–7 Hz, alpha: 9–12 Hz, low sigma: 12–13.5 Hz, high sigma: 13.5–15 Hz, low beta: 15–20 Hz, and high beta: 20–30 Hz). Two-way ANOVA with the factors “group” and “derivations” revealed significant differences between groups in the high sigma frequency range (F=5.4, df=2, 47, p<0.007) after Bonferroni correction for multiple comparisons. Post hoc unpaired t tests for the values in the sigma range showed a significant difference between the comparison and schizophrenia subjects (p<0.001) and the depressed and schizophrenia subjects (p<0.01), but not between the comparison and depressed subjects. In
Figure 2 A, the average EEG power and significant differences between groups are shown at a higher resolution (0.25 Hz bins, uncorrected). We repeated this analysis for stage 2 or stages 3–4 sleep alone and obtained similar results (data supplement
Figure 1 ). Based on this exploratory analysis, we then examined topographic changes in the high sigma range (13.75–15.00 Hz).
Topography of 13.75–15.00 Hz EEG power
The topography of non-REM sleep EEG power in the high sigma range showed a typical frontal-parietal peak in the comparison and depression groups, which was greatly reduced in the schizophrenia group (
Figure 2 B). This reduction was significant at 36 electrodes in relation to the comparison group and at 23 electrodes in relation to the depression group (p<0.0001; statistical nonparametric mapping,
Figure 2 B). A similar topography was obtained with stage 2 or stage 3–4 sleep only (data supplement
Figure 2 ). No electrodes had statistically different EEG power values in the comparison between the depression and the comparison groups.
Cortical projection of scalp electrodes with reduced power in the high sigma range
We mapped the cortical areas underlying the electrodes with reduced power values in a few subjects. We digitized the position of each scalp electrode with an infrared tracking system (NBS, Nexstim, Helsinki, Finland). We then coregistered these positions with the three-dimensional reconstruction of the subject magnetic resonance images. The three-dimensional reconstruction was displayed with color-coded interpolated contour lines corresponding to the power values of all electrodes, from maximal (red) to minimal (light blue) (
Figure 2 C; Curry 5.0, Compumedics Neuroscan, El Paso, Tex.). To obtain a rough indication of brain areas underlying the electrodes with reduced power in the high sigma range, we considered their orthogonal projection on the cortical surface. In all subjects, the projection overlapped the primary and secondary somatosensory cortex (Brodmann’s areas 3, 1, 2, and 5).
Sleep spindle analysis
Sleep spindles are the best-characterized source of EEG power in the 13.75–15.00 Hz range. Therefore, we hypothesized that the EEG power deficit in the high sigma range in schizophrenia patients was related to an underlying deficit in the generation or expression of sleep spindles, one of the two fundamental sleep oscillations. To test this hypothesis, we counted individual spindles with an automated algorithm with visual confirmation. Spindle number, amplitude, and duration were calculated for each group. We found that each of these parameters was significantly reduced at the electrodes, with a significant power reduction when we compared the schizophrenia versus comparison and schizophrenia versus depression groups (p<0.001 for each, post hoc unpaired t test after ANOVA: F>9.4, df=2, 47, p<0.001), but not the comparison versus the depression group. We then calculated Cohen’s d as a measure of the effect size for EEG power and spindle parametric values (
Table 2 ). Each of the parameters provided separation of the schizophrenia group from the other groups, with the largest effect size based on spindle number.
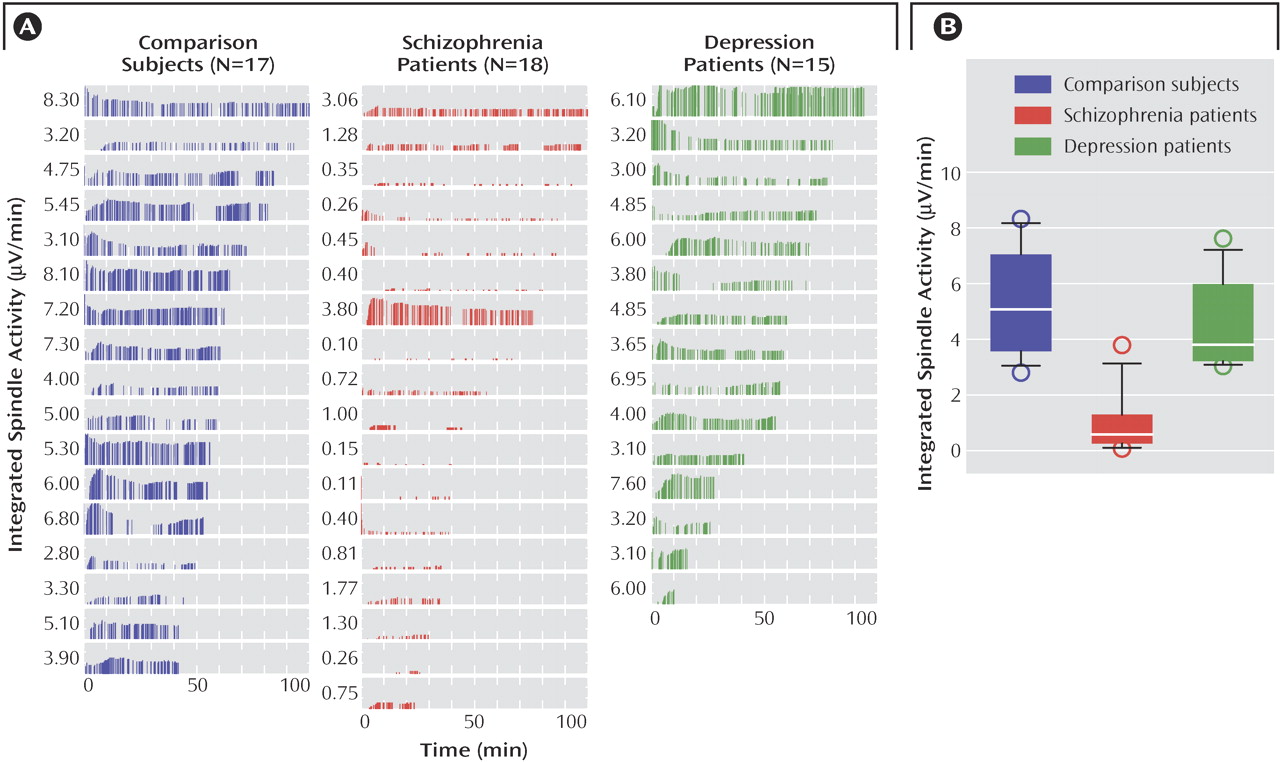
To determine if a combination of spindle parameters allowed for a better group discrimination, integrated spindle activity was calculated by integrating over time the amplitude of each detected spindle (and by dividing by non-REM sleep duration). We found that integrated spindle activity was markedly reduced in amplitude and number of detections during the first sleep episode in the schizophrenia group in relation to the comparison and depression groups (
Figure 3 A). Furthermore, integrated spindle activity had the largest effect size of all spindle parameters investigated, which corresponded to 93.0% and 90.2% separation of the schizophrenia from the comparison and depression groups, respectively. In particular, integrated spindle activity values did not overlap between 16 of 18 schizophrenia patients in relation to both comparison and depression subjects (
Figure 3 B).
Clinical Correlation of Integrated Spindle Activity Values
To determine if in schizophrenia patients clinical parameters correlated with spindle activity, correlation coefficients were calculated. There were no significant correlations between integrated spindle activity values and PANSS subscores, medication dose (chlorpromazine equivalents), age, education, body mass index, or duration of illness. We did not have enough statistical power to stratify the results with respect to gender.
Discussion
We investigated sleep EEG power and spindle activity in comparison, schizophrenia, and depression subjects by employing a 256-channel high-density EEG system. We found that in the present group of schizophrenia subjects, there was a pronounced decrease in power in the high sigma range that was restricted to a specific centroparietal area. Underlying this reduction in power was a decrease in several parameters characterizing sleep spindles. One of these parameters, integrated spindle activity, provided greater than 90% separation of the schizophrenia group from the comparison or depression subjects.
Sleep EEG Power Studies in Schizophrenia
In healthy subjects, sleep EEG power in specific frequency ranges has a characteristic topographic distribution
(29 –
31) . Unfortunately, to date there are few studies examining sleep EEG power in schizophrenia, let alone its topography
(6,
32,
33) . Tekell et al.
(33) reported increased high-frequency (>20 Hz) sleep EEG power in schizophrenia and depression subjects in relation to comparison subjects. Muller et al.
(32) reported no significant change in the sleep power spectra for 10 schizophrenia patients before and after 4 weeks of olanzapine administration. Keshavan et al.
(3) found a reduction in the delta (1–4 Hz) and theta (4–8 Hz) frequency bands in schizophrenia patients in relation to comparison subjects. The authors also reported that schizophrenia patients had reduced slow-wave sleep, sleep efficiency, and maintenance. Reductions in slow-wave sleep have been observed in some, but not all, studies, and the discrepancy between studies has not been fully accounted for
(3,
6,
34) . Slow-wave sleep reductions are also often reported in depressed subjects
(2) . In our study, subject groups did not differ in delta EEG power or slow-wave sleep during the first sleep episode, and no further analysis of slow waves was performed. It should be noted that our depression group was heterogeneous with respect to current symptoms, history of recurrent episodes, and medication status, which may explain the lack of slow-wave sleep changes.
Sleep Spindle Abnormalities in Schizophrenia
Only three previous studies specifically examined spindle activity in schizophrenia subjects
(5,
7,
35) . Each of these studies identified spindles by visual detection in non-REM sleep from two channels (C3 and C4). In contrast, our detection method analyzed the EEG signal from ≥178 recording channels. Notably, the locations of C3 and C4 electrodes are outside the topographic area where we identified reduced spindle activity. Moreover, the combination of an automated algorithm followed by manual confirmation in all non-REM sleep epochs should have improved the sensitivity of spindle detection in our study.
Poulin et al.
(7) restricted their analysis to 12–14 Hz and would not have detected differences in the high spindle range. They reported that schizophrenia (N=11) and comparison (N=11) subjects did not differ in spindle density. In a pilot study with only five subjects, Hiatt et al.
(5) restricted spindle counts to a 10-minute segment from the middle of each non-REM period and did not normalize for the percentage of slow-wave sleep during the segment. Because the number of spindles detected during stage 2 sleep is larger than during slow-wave sleep (stages 3 and 4), subjects with less slow-wave sleep could appear to have more spindles. Accordingly, they reported increased spindle density with decreased slow-wave sleep in the schizophrenia subjects (N=5) in relation to the comparison subjects (N=18).
Differences in subject populations may also have contributed to differences in findings between studies. Each of the previous studies investigated acutely ill subjects during—or immediately after—psychiatric hospitalization
(5,
7,
33) . The subjects were antipsychotic naive
(7) or antipsychotic free for at least 6
(35) or 8
(5) weeks. In contrast, all of our subjects with schizophrenia were stable outpatients who were receiving antipsychotic medications at the time of the recording. Although we cannot completely rule out the possibility, we believe that medications do not account for the spindle activity reduction we observed in the schizophrenia group based on the following reasons. First, a study showed that there were no changes in EEG spectral power, including the spindle range (12–15 Hz), in 10 schizophrenia subjects before or after 4 weeks of treatment with olanzapine
(32) . Of importance, in this study, power spectral densities were calculated from the Cz-Pz derivation that was within the region of reduced spindle activity in our subjects. Acute administration of olanzapine in healthy comparison subjects also did not change 12–14.5 Hz EEG power
(36) . Similarly, acute administration of haloperidol (a first-generation antipsychotic) to comparison subjects did not change spindle density
(37) . Additionally, we have observed that high-definition EEG sleep recordings of a few subjects taking antipsychotic medication but not diagnosed with schizophrenia (or another psychotic disorder) did not differ significantly in spindle parameters from the comparison or depression subjects shown in this article (unpublished study by Ferrarelli et al.). These findings suggest that antipsychotic medications may have a negligible effect on sleep spindles. Other, nonantipsychotic maintenance medications were also unlikely to have influenced the reduction of sleep spindle parameters because they were taken by only a subset of schizophrenia patients. Additionally, these medications are not known to decrease spindle activity
(37,
38) .
Sleep Spindles, Thalamic Reticular Nucleus, and Attentional Gating
The finding of a significant deficit in sleep spindles in schizophrenia raises the question of what neuroanatomical structures and mechanisms may be involved, consistent with a recent hypothesis that abnormalities of thalamocortical rhythms underlie several neuropsychiatric disorders
(39) . The generation of sleep spindles requires inhibitory cells in the reticular thalamic nucleus. When these reticular cells are excited by a corticothalamic volley, they strongly inhibit principal thalamic cells, which rebound into a spindle-frequency oscillation that is transmitted back to the cortex
(40) . Both intrinsic thalamic conductances and reticulo-thalamic/cortico-thalamo-cortical loops are involved in the generation, amplification, and synchronization of spindles
(1) . During sleep, spindle activity is thought to partially block transmission of external sensory stimuli through the thalamus to the cortex
(10) .
Reticulo-thalamic circuits are thought to have critical roles in gating peripheral sensory input during waking as well, thus allowing the brain to attend to the most pertinent stimuli
(41) . Experimental evidence supports this hypothesis
(42,
43) . In particular, single-unit recordings in the rat have provided the first experimental evidence of auditory gating in the thalamic reticular nucleus
(43) .
The role of reticulo-thalamic circuits in attentional gating of sensory information is particularly relevant in view of reports that schizophrenia involves deficits in these functions
(44,
45) . A well-known example of such deficits is the evoked response potential to auditory stimuli. The best characterized of these deficits are impairments in the P50
(46) and P300 evoked response potentials
(47,
48) . These deficits have been seen in acutely psychotic and remitted patients with schizophrenia as well as in unaffected relatives
(46,
47), suggesting that these defects might be heritable markers of schizophrenia predisposition, rather than measures of active illness.
Implications of Sleep Spindle Deficits in Schizophrenia
We reported that subjects with schizophrenia have a pronounced deficit in sleep spindles. This finding, in agreement with evidence from imaging
(11) and functional studies
(46,
47), suggests a possible impairment of reticulo-thalamic circuits in schizophrenia patients. Intriguingly, integrated spindle activity, a comprehensive measure of spindle activity, had an effect size (≥2.75) that in our group permitted greater than 90% discrimination between the schizophrenia and the depression or comparison groups
(49) . Although promising, such a large effect size should be qualified by our limited group size, and its reproducibility, stability over time, and dependence upon medication must be evaluated in further studies.
No single genetic, electrophysiological, or cognitive measure has been identified in all subjects with schizophrenia. The heterogeneity of the schizophrenia syndrome has made the search for schizophrenia trait markers challenging
(49) . Similarly, our results indicate that impairments resulting in decreased spindle activity during the first sleep episode are present in most—but not all—of the schizophrenia subjects reported here. Whole-night sleep recordings on multiple nights will be necessary to determine the stability of spindle activity patterns over time. Further studies with larger groups, especially with unmedicated schizophrenia patients or with nonschizophrenia patients treated with antipsychotics, will be needed to confirm the specificity of the present findings. Studies with larger populations and with first-degree relatives will also be needed to establish whether reduced sleep spindle activity in schizophrenia varies with diagnostic subcategory, symptom severity, or gender and whether it may represent a trait or a state marker of disease.
