Participants
The subjects examined in this study were participants in a longitudinal investigation of the risk factors for common psychiatric disorders in women. They were members of Caucasian female same-sex twin pairs from the Virginia Twin Registry
(6), a population-based registry formed from a systematic review of all birth certificates in the Commonwealth of Virginia. Twins were eligible to participate if they were born during 1934–1971 and both members had previously responded to a mailed questionnaire. In our first interview, we assessed 92% of the eligible individuals (N=2,163)—90% face-to-face, the rest by telephone. Zygosity was determined blindly by standard questions
(7), photographs, and—when necessary—DNA
(6,
8). We recently conducted a validation study that involved performing polymerase chain reaction zygosity tests on an additional 269 pairs of twins and oversampling those for which our prior zygosity assignment was uncertain. On the basis of these tests (where the mean number of markers tested per pair was 17.5, SD=8.4), zygosity was changed in 12 pairs (4.5%).
We performed three additional waves of telephone interviews with this sample, but here we use data only from the third interview, which was completed by 1,898 individuals—87.7% of the individual twins from the original sample. The mean number of months between the first interview and the third interview was 61.3 (SD=5.1). The mean age of the participating twins in the third interview was 34.6 years (SD=7.5, range=22–59). From all twins who participated in interview wave 1, pairs in which both members participated in the third wave were similar in age (t=1.33, df=2161, p=0.18) to pairs in which one or both twins did not cooperate in the third wave, but the former group had, on average, approximately 0.6 more years of education (t=5.56, df=2161, p<0.0001). All interviews were conducted by interviewers who were blind to information about the co-twin. Written informed consent was obtained before face-to-face interviews, and oral assent was obtained before telephone interviews.
Measures
We chose, a priori, six measures from the first and third interviews that reflected broad aspects of functioning that relate to mental health. For simplicity, we scaled all dimensions so that increasing levels reflected increasing mental health.
Self-perceived physical health was assessed by two items in the wave 1 interview: 1) satisfaction with health and 2) number of days spent sick in bed in the last 12 months. This variable was included because of the strong evidence for a positive association between physical and emotional health
(9). The mean scores for these two items were calculated after each was rescaled to contribute equal weight. Cronbach’s alpha
(10), a standard measure of internal scale reliability, for these two items was 0.41.
Nonconflictual interpersonal relationships were assessed by separate questions from a standard inventory of stressful life events
(11), and participants were asked at both the wave 1 and wave 3 interviews about any serious problems getting along during the preceding 12 months with 1) parents, 2) twin, 3) other siblings, 4) other relatives, 5) close friends, 6) neighbors, or 7) in-laws. We examined the mean number of problems across the two interview waves. Cronbach’s alpha for these items was 0.61.
Levels of anxiety and depression were assessed by the response to 18 questions asked at both interviews about the experience, for at least 5 days over the last 12 months, of 16 disaggregated symptoms of major depression, as outlined by DSM-III-R (e.g., separate items for weight gain and loss and psychomotor retardation and agitation), and two screening questions for generalized anxiety disorder (“feeling anxious, nervous, or worried” and “your muscles felt tense, or you felt jumpy or shaky inside”). Positive responses to these items, which were adapted from the Structured Clinical Interview for DSM-III-R
(12), were not counted if the symptoms were judged to be the result of medications or physical illness. We examined the mean number of symptoms reported across the two waves. Cronbach’s alpha for these items was 0.89.
Levels of substance use were measured with three variables that assessed 1) alcohol consumption at both waves, measured as the product of the number of days per month when an alcoholic drink was consumed and the number of drinks consumed on an average day when drinking occurred, 2) the frequency of use of “medicine for your nerves or sleeping medicines,” assessed at the wave 1 interview, and 3) the average number of cigarettes smoked per day in the last year, assessed at the wave 3 interview. We examined the first principal component derived from these measures. Cronbach’s alpha for these three items was 0.39.
Social support was assessed as the first principal component of a 15-item social interaction scale that was previously developed and used at the Institute for Social Research
(13) and with which ratings were obtained at both interviews. These items reflected the frequency and quality of contact with friends and relatives, the frequency of attendance at clubs or other organizations, and the number of friends and confidants. The highest negative loadings on this factor (<–0.40) were for items that reflected interpersonal tensions (e.g., “Do your relatives criticize you? Do your friends make too many demands on you?”), whereas the highest positive loadings (>0.40) were on items that reflected warm relationships (e.g., “Do your relatives express interest in how you are doing? Do your relatives make you feel that they care about you?”). Cronbach’s alpha for these 15 items was 0.61.
Self-esteem was assessed by the 10-item Rosenberg Self-Esteem Scale
(14), which was completed at the wave 3 interview. We examined the first principal component derived from these items. Cronbach’s alpha for this scale was 0.89.
The distributional properties of these variables, even after analysis of principal components, were often highly nonnormal. Therefore, before analysis, we polychotomized all variables into three approximately equal classes that reflected low, intermediate, and high scores. We then fitted to these resulting contingency tables a multiple-threshold model, which assumes a normally distributed underlying latent distribution. We tested the goodness-of-fit of this model separately in monozygotic and dizygotic twins. Of the 12 tests, the model failed at the 5% level only twice, a result not different from chance expectations
(15); no variable failed in both zygosities. We also examined the relationship between these six variables and age. The highest correlation was with nonconflictual interpersonal relationships (0.13); all other correlations were under 0.05. We did not, therefore, include age in our model.
Statistical Analysis
Our approach to the analysis of twin data has been outlined in detail elsewhere
(16,
17) and consists of inferring the action of genetic and environmental risk factors from the pattern of resemblance in monozygotic and dizygotic twin pairs. For this article, we performed a multivariate genetic analysis of our six putative dimensions of mental health. While the goal of univariate genetic analysis is the decomposition of the variance of a trait into its genetic and environmental components, in multivariate genetic analysis, the focus shifts to decomposing sources of covariance among traits. To illustrate the difference between univariate and multivariate twin analysis, the concept of latent or unobserved factors is introduced. In a traditional or phenotypic factor analysis, latent factors are postulated to cause the resemblance (or, more technically, covariation) among items. The goal of factor analysis is to explain the correlations among a large number of variables as a result of the effects of a small number of latent factors. Multivariate genetic analysis is also a method of explaining correlations among multiple items. However, it goes beyond traditional factor analysis in that it provides insight into the causes of resemblance among variables.
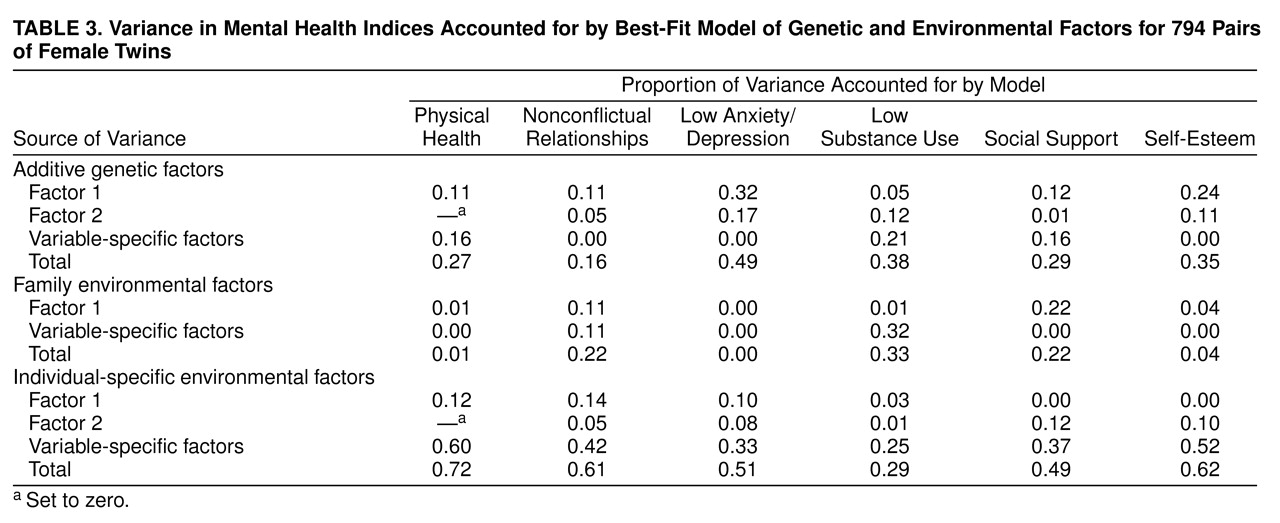
As with all our twin modeling, we here assume that the variation and covariation in liability to mental health can be ascribed to three potential sets of factors: 1) additive genetic variables, which contribute twice as much to the correlations between monozygotic twins as they do to the correlations between dizygotic twins (because monozygotic twins share identical genes by descent, whereas dizygotic twins share, on average, half their genes), 2) common or family environment (those familial factors such as parental attitudes that are shared by members of a twin pair), which contribute equally to the correlation between monozygotic and dizygotic twins, and 3) individual-specific environmental factors, which reflect environmental experiences not shared by both members of a twin pair and therefore contribute to differences between them in their reported levels of mental health.
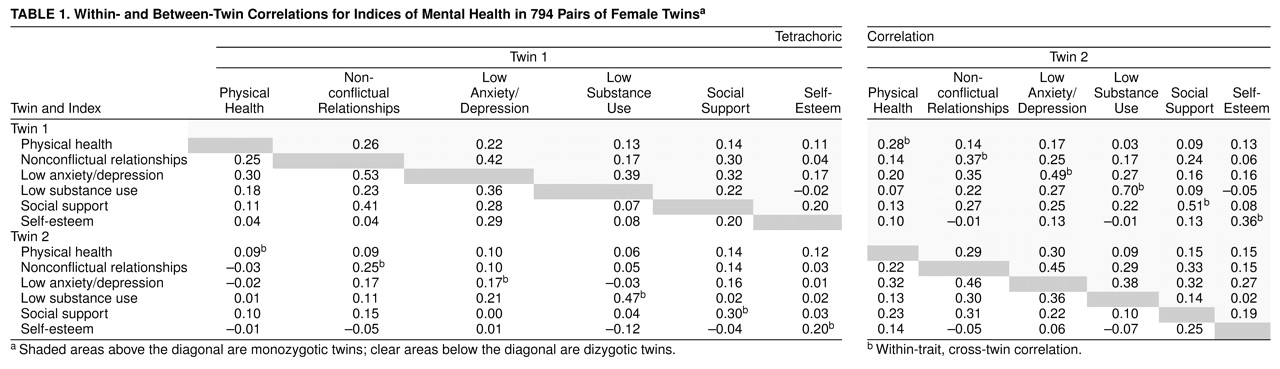
In univariate analysis, information regarding the causes of variation is obtained by comparing the resemblance of monozygotic and dizygotic twin pairs for a single variable. In multivariate analysis, the correlation between two or more variables is the primary unit of analysis. By comparing the cross-twin, cross-variable correlation in monozygotic and dizygotic twins, and contrasting that to the cross-twin, within-variable and within-twin, cross-variable correlations, the covariation of two or more variables can be partitioned into its genetic and environmental components.
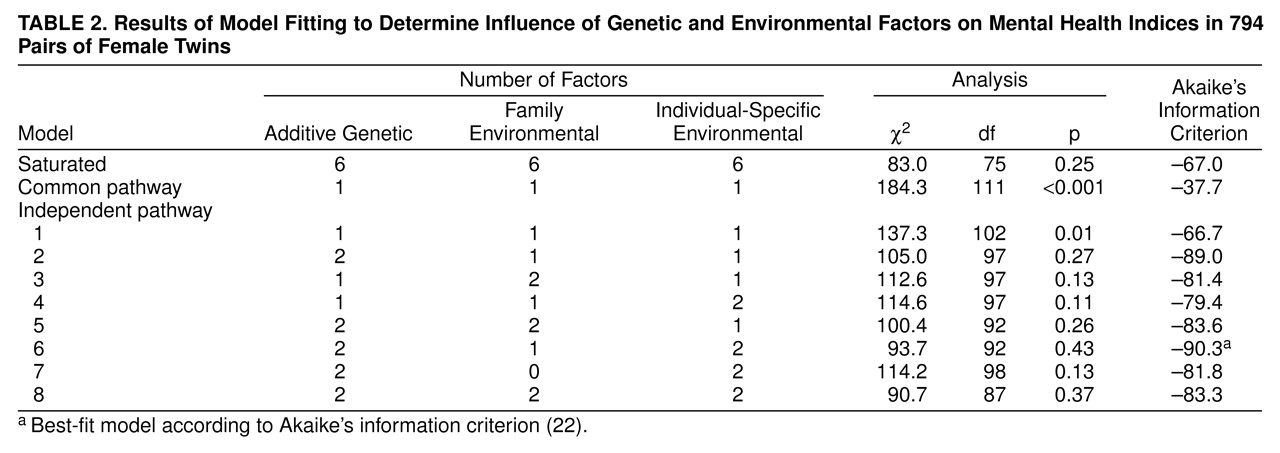
Two alternative models were tested to describe how genetic and environmental factors may influence covariation. In the common pathway model
(17–
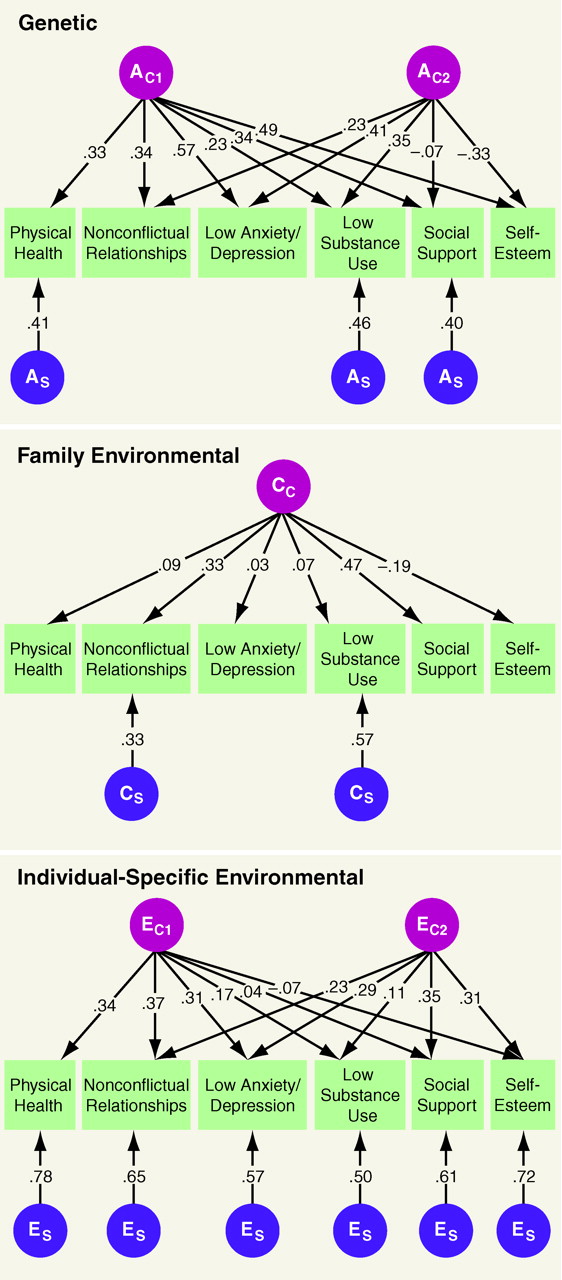
19), genetic and environmental factors influence covariation through a single pathway. Such a model contains no separate genetic and environmental latent factors. Rather, genetic and environmental variables act conjointly through one or more latent phenotypes. By contrast, in the independent pathway model, genes and the environment can contribute to covariation through separate genetic and environmental latent factors. Because we had only six dimensions of mental health, no model with more than two common factors could be identified. In addition to these common factors, the model estimated additive genetic (A), common or family environmental (C), and/or individual-specific or unique environmental (E) factors that are specific to individual dimensions of mental health. The common and specific factors are identified by subscripts so that A
C1 and E
S represent, respectively, the first common genetic factor and a unique environmental factor specific to a particular variable.
The form of data for our multivariate genetic analysis is two 12×12 polychoric correlation matrices calculated by PRELIS
(20), which gave the tetrachoric correlations within and across twins for the six dimensions of mental health and separately for monozygotic and dizygotic twins. To best describe how genes and the environment influence resemblance among the dimensions of mental health, a series of multivariate models was fitted to these matrices by using Mx software
(21) by the method of asymptotic-weighted least squares. The model, which best combined the features of parsimony and goodness-of-fit, was selected by Akaike’s information criterion
(22), one of the best performing of such indices in a thorough simulation study
(23). To identify uniquely second common factors, the loading of these factors on the first variable (physical health) was set to zero.