Between 25% and 60% of depressed patients who are treated with placebo may have substantial reductions in symptoms
(1,
2). Depression is not unique among medical syndromes in this respect. Other medical and psychiatric illnesses have similarly high placebo response rates
(1). Nevertheless, the high response rate in depression has led some to conclude that 50%–75% of the apparent efficacy of antidepressant medication actually represents the placebo effect
(3,
4).
The high placebo response rates in depression complicate the development of antidepressant drugs, since effective new drugs may be abandoned if they fail to show effectiveness superior to placebo
(2,
5). Efficacy that is superior to placebo can be difficult to prove for any medical treatment, but is particularly difficult for antidepressant medication because of the absence of physiologic outcome measures. The primary measure of efficacy in depression treatment studies remains mood ratings, which are subject to influence from a variety of sources including subject motivation and investigator expectations. The pattern of change in mood ratings over time has been proposed as an indicator to differentiate between true drug and placebo responses
(2,
6,
7). Pattern analysis can identify subjects with poorer prognoses and placebo-type responses, but it still relies on mood ratings and extended observation of subjects.
Brain functional measurements show promise as a physiologic indicator of treatment effectiveness in depression. Several studies using positron emission tomography (PET) or single-photon emission computed tomography have documented reductions in prefrontal cortical perfusion or metabolism resulting from antidepressant medication treatment
(8–
12). None of these studies, however, has compared brain function in subjects actually receiving placebo treatment with those receiving antidepressant medication.
Method
Subjects
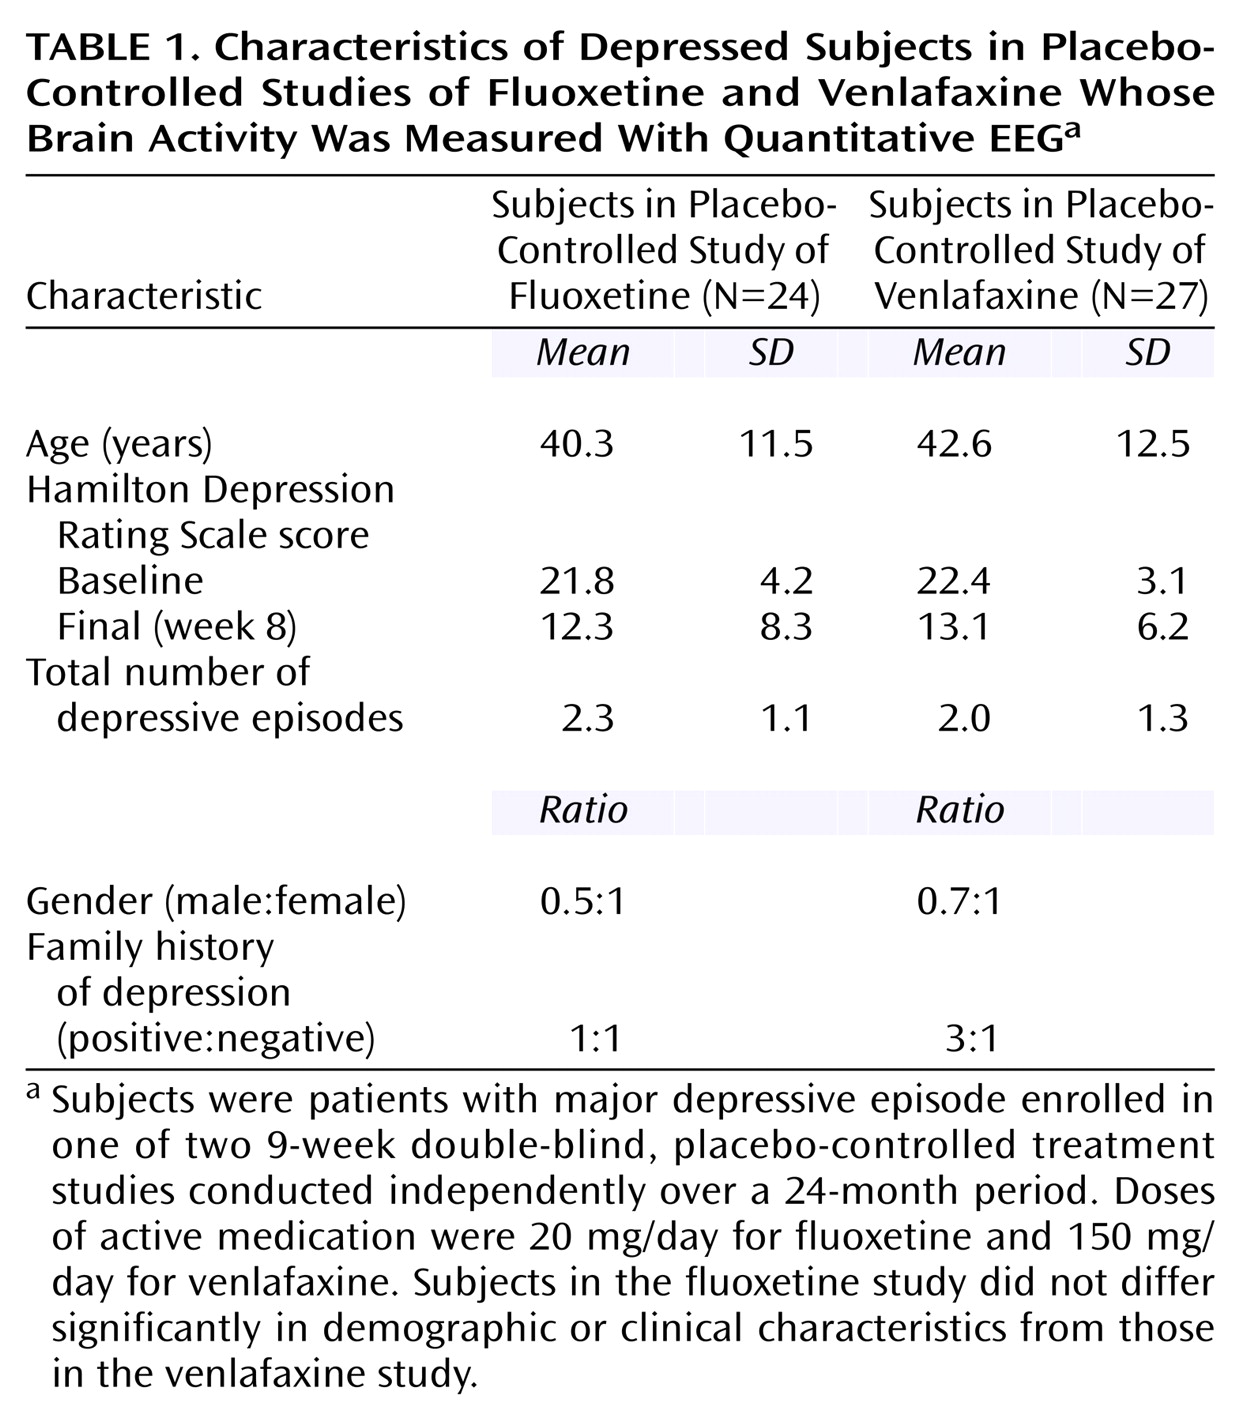
Subjects were enrolled in one of two 9-week, double-blind placebo-controlled treatment studies conducted independently over a 24-month period: the first study utilized fluoxetine, 20 mg, (N=24) and the second, venlafaxine, 150 mg, (N=27) as the active medication. Subjects were recruited both from community advertisement and from the outpatient clinics of the UCLA Neuropsychiatric Hospital. The UCLA institutional review board approved all experimental procedures, and written informed consent was obtained after experimental procedures were explained fully to the subjects.
The two studies utilized identical inclusion and exclusion criteria. All subjects were adults who met DSM-IV criteria for a major depressive episode, as diagnosed with the Structured Clinical Interview for DSM-IV. All subjects had Hamilton Depression Rating Scale scores ≥16
(16), and subjects were excluded if they previously had failed treatment with the antidepressant being studied, if they had a history of suicidal ideation, or if they suffered from any medical illness or received any medication known to significantly affect brain function. The demographic and clinical characteristics of the subjects in the two studies are shown in
Table 1.
Experimental Procedures
After enrollment, all subjects received single-blind, placebo lead-in treatment for 1 week; subjects who met response criteria (Hamilton depression scale score ≤10) after this week were removed from the study. The remaining 51 subjects then were randomly assigned to receive 8 weeks of double-blind treatment with either placebo or the active medication. Subjects enrolled in the fluoxetine trial were continued at a dose of 20 mg/day for the 8 weeks; those enrolled in the venlafaxine trial began at a dose of 37.5 mg/day, increased over a week to 150 mg/day, and then continued at that dose for the remaining 7 weeks. To preserve blinding, the placebo “dose” was escalated in the venlafaxine trial.
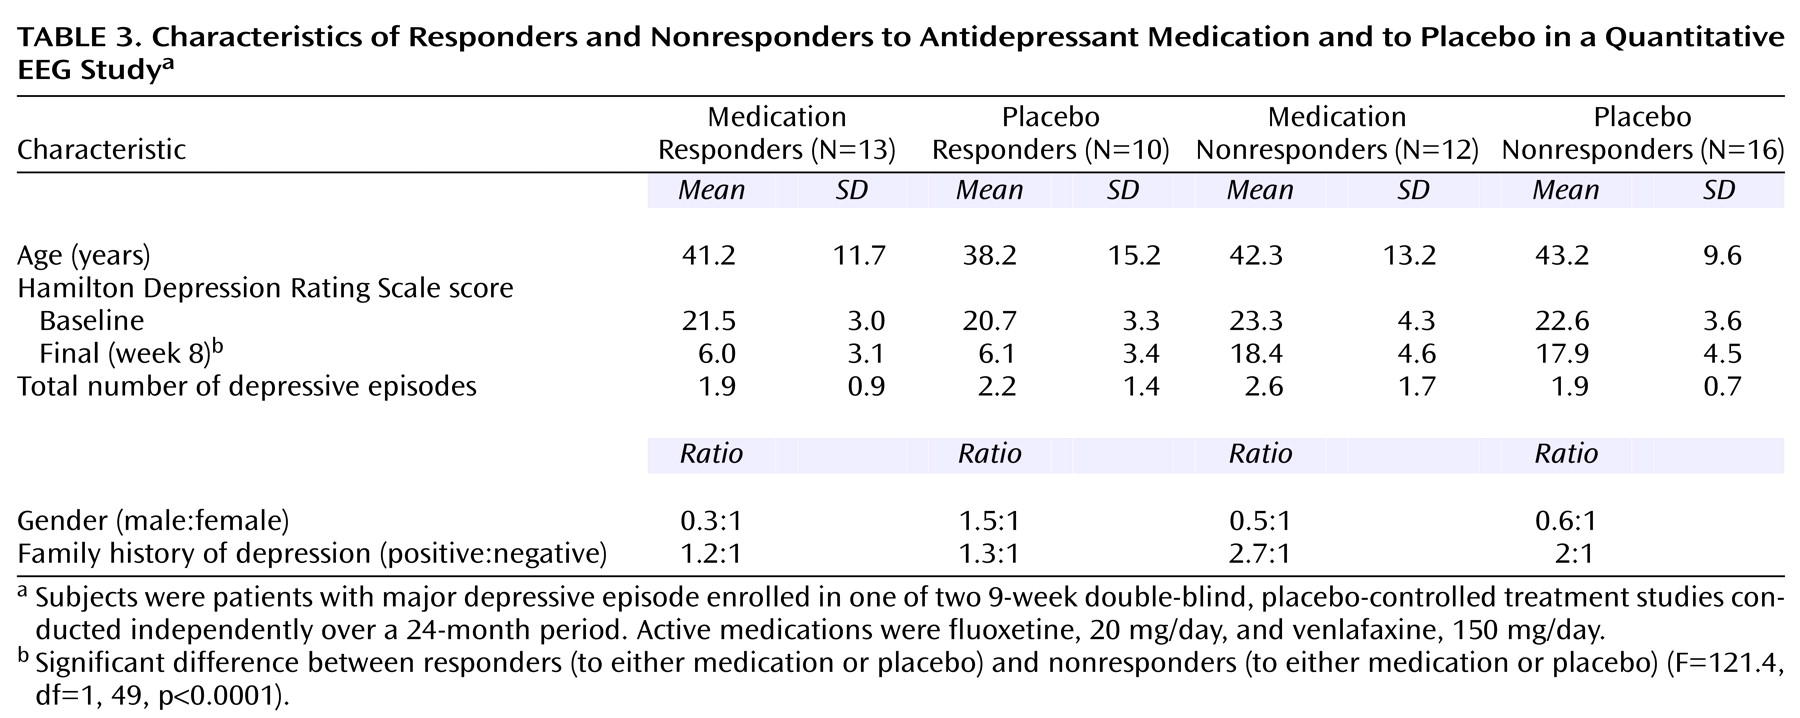
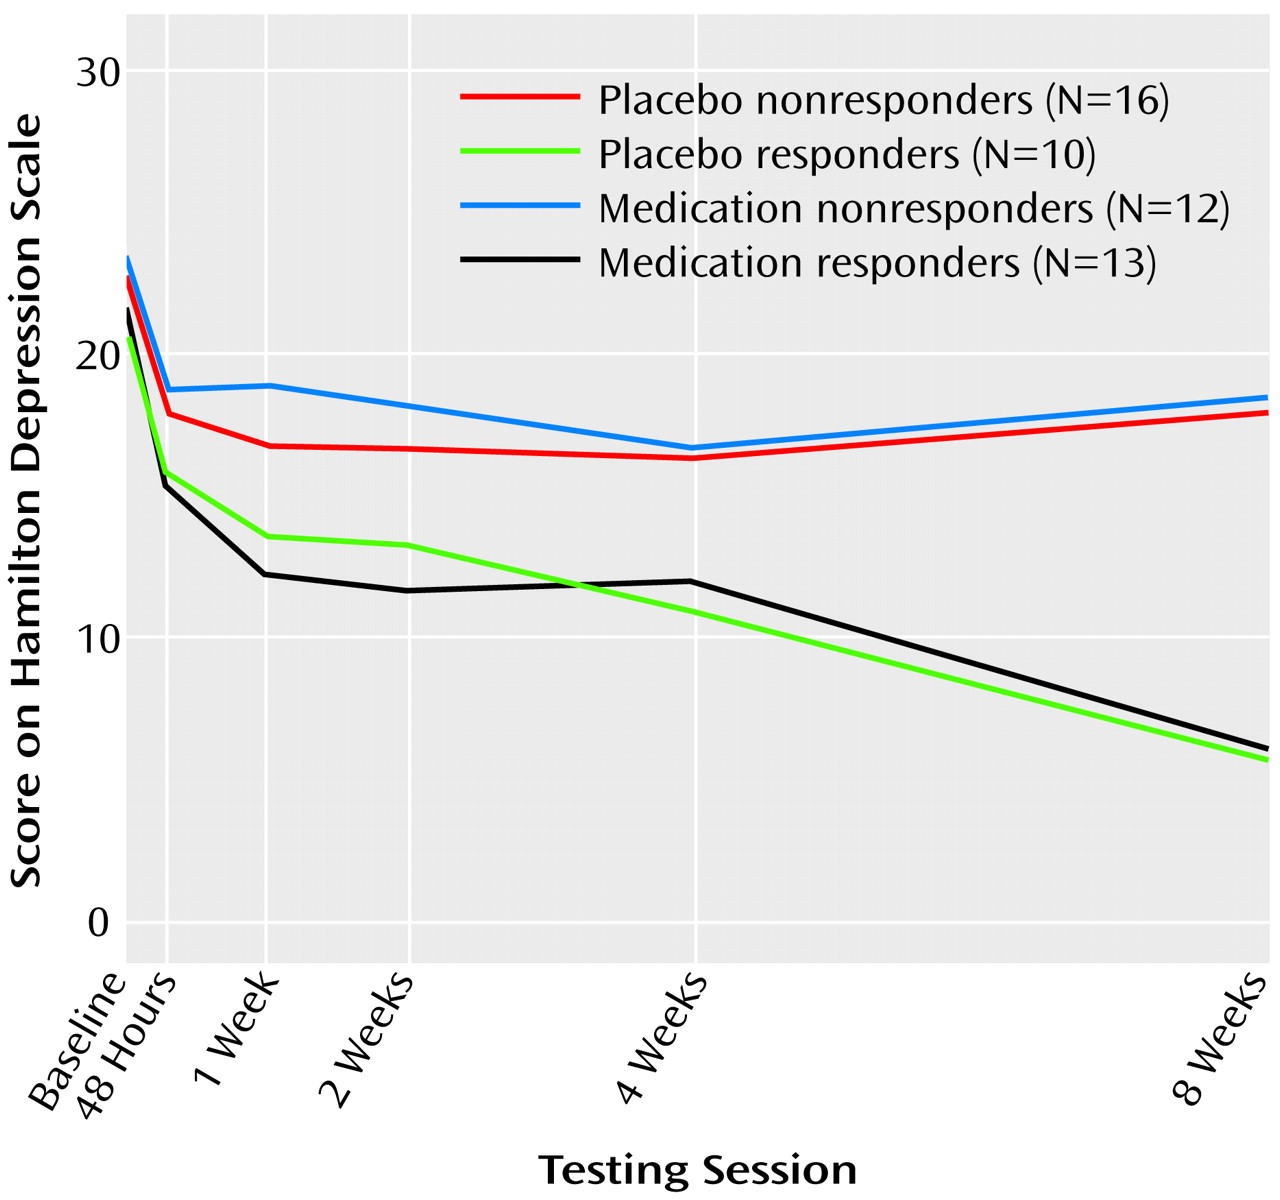
Subjects returned for monitoring sessions 2 days after random assignment to study groups and then at weekly intervals. Sessions consisted of symptom evaluation (with the Hamilton depression scale) as well as brief sessions of supportive psychotherapy with a research nurse. These sessions consisted of 15–25 minutes of unstructured counseling and assistance in problem solving. The sessions were mandated by the institutional review board to address safety concerns about dispensing placebo alone to patients with significant depression. We defined clinical response as a Hamilton depression scale score ≤10 after 8 weeks of double-blind treatment. At this time, the blind was broken, and subjects were classified as medication responders, placebo responders, medication nonresponders, or placebo nonresponders. We also determined how early in the course of treatment each responder had a substantial reduction in symptoms, as well as the persistence of their response to treatment. This pattern analysis permitted us to classify the medication responder and placebo responder subjects as having the late, persistent pattern of symptomatic improvement indicative of true drug response, or the early, nonpersistent pattern of improvement indicative of placebo response
(2,
6,
7).
QEEG Techniques
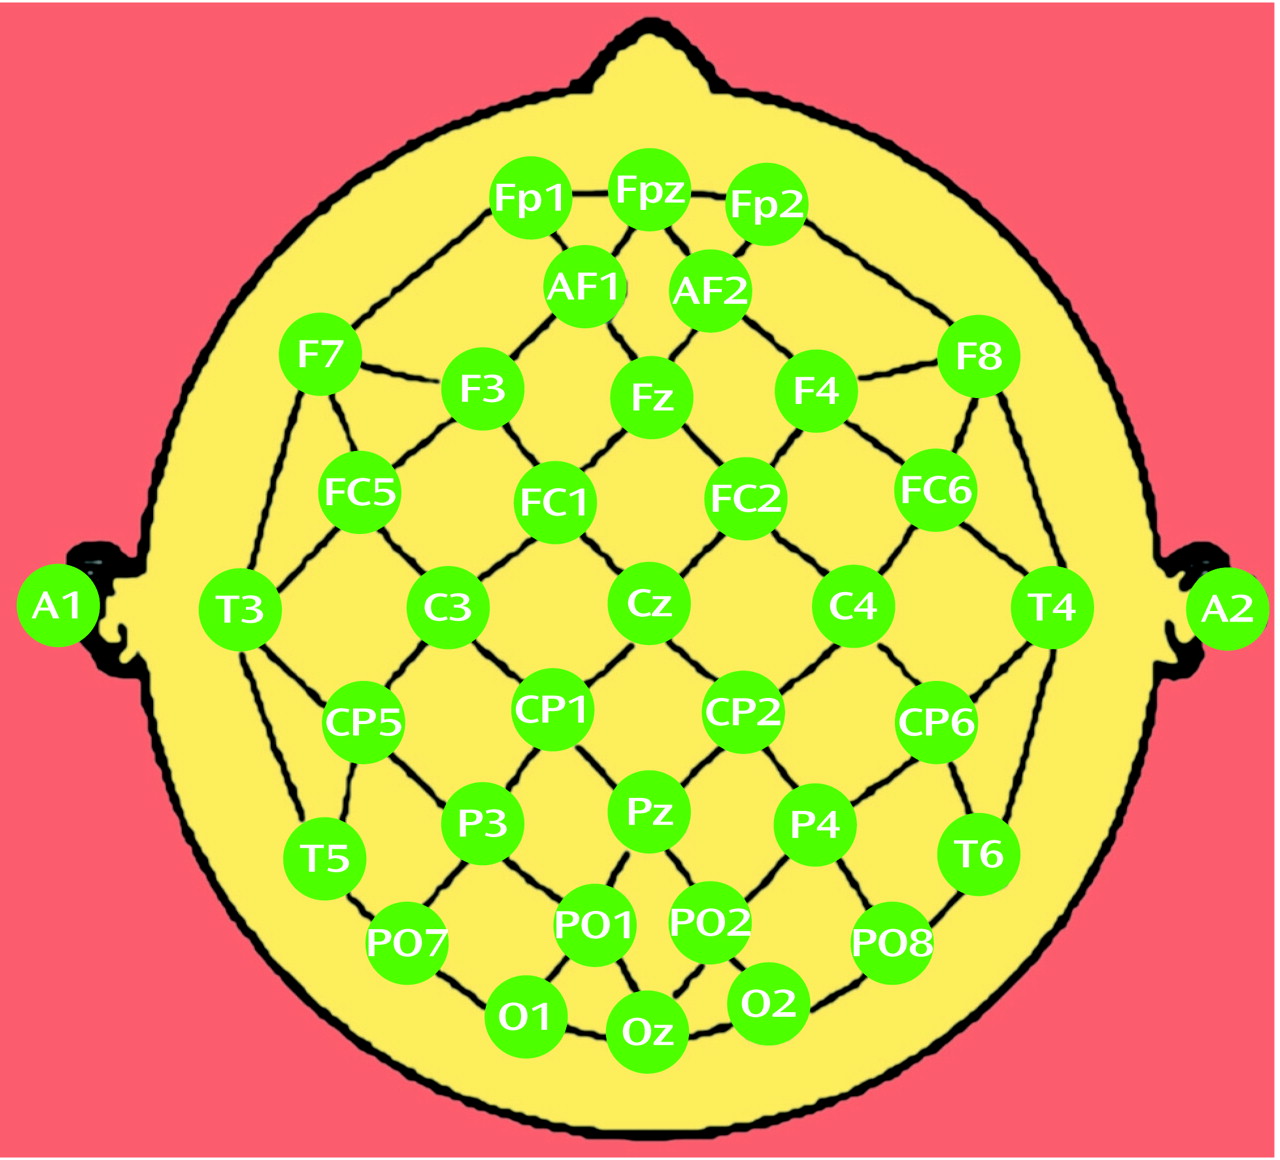
QEEG data were examined from recordings performed at the time of enrollment in the study (baseline), at the end of the 1-week placebo lead-in, and at 2, 4, and 8 weeks after the start of double-blind treatment. Electrodes were placed with an electrode cap (ElectroCap, Eaton, Ohio) by using an extended International 10-20 System with a total of 35 recording electrodes (
Figure 1). Eye movements were monitored with right infraorbital and left outer canthus electrodes. Recordings were performed with the QND system (Neurodata, Inc., Pasadena, Calif.) while subjects rested with eyes closed in a maximally alert state in a sound-attenuated room with subdued lighting. These procedures have been described previously
(13,
17,
18). Data were collected by using a Pz reference montage and were digitized at 256 samples/channel/second, with a high-frequency filter of 50 Hz and a low-frequency filter of 0.3 Hz. Data were reformatted by amplitude subtraction to a linked-ears reference. A technician who was blinded to subject identity, treatment condition, and clinical status reviewed the record and selected the first 20–32 seconds of artifact-free data for processing; this amount of data has been used by our group
(13,
19) and other investigators
(20) to obtain reliable frequency spectra. A fast Fourier transform was used to calculate absolute power (the intensity of energy in a frequency band in microvolts squared) and relative power (the percentage of the total energy from all bands concentrated in a single band) in each of four nonoverlapping frequency bands, inclusive at the lower boundary of each band (0.5–4 Hz, 4–8 Hz, 8–12 Hz, and 12–20 Hz).
In addition, for each electrode site in each of the four bands, cordance values were calculated. Cordance is a measure derived from QEEG power that has a moderately strong association with cerebral perfusion (as measured by simultaneous O
15 PET); this association is superior to that seen for conventional QEEG power measurements in each frequency band, including the alpha band
(13). Cordance is calculated with a three-step algorithm that normalizes power across both electrode sites and frequency bands. This algorithm has been defined in detail elsewhere
(13) and may be summarized as follows. First, absolute power values are reattributed to each individual electrode by averaging power from all bipolar electrode pairs sharing that electrode (
Figure 1). This electrode referencing method is similar to the Hjorth transformation, except that the current method averages power from neighboring electrode pairs whereas the Hjorth transformation averages voltage amplitudes. We previously reported that electrode referencing on the basis of power averaging provides a stronger association between surface-measured EEG and perfusion of underlying brain than either the linked-ears reference or the conventional Hjorth transformation
(18). Second, absolute and relative power values undergo spatial normalization within each frequency band by means of a z score transformation, yielding z scores for each electrode site
s and frequency band
f (A
norm(s,f) and R
norm(s,f), respectively). Third, the z-transformed absolute and relative power scores are summed to yield cordance values
(13). (Software for performing cordance calculations is available to academic institutions free of charge for research purposes; see instructions at www.qeeg.npi.ucla.edu.)
For each subject over the course of treatment, we calculated power and cordance values for individual electrodes (
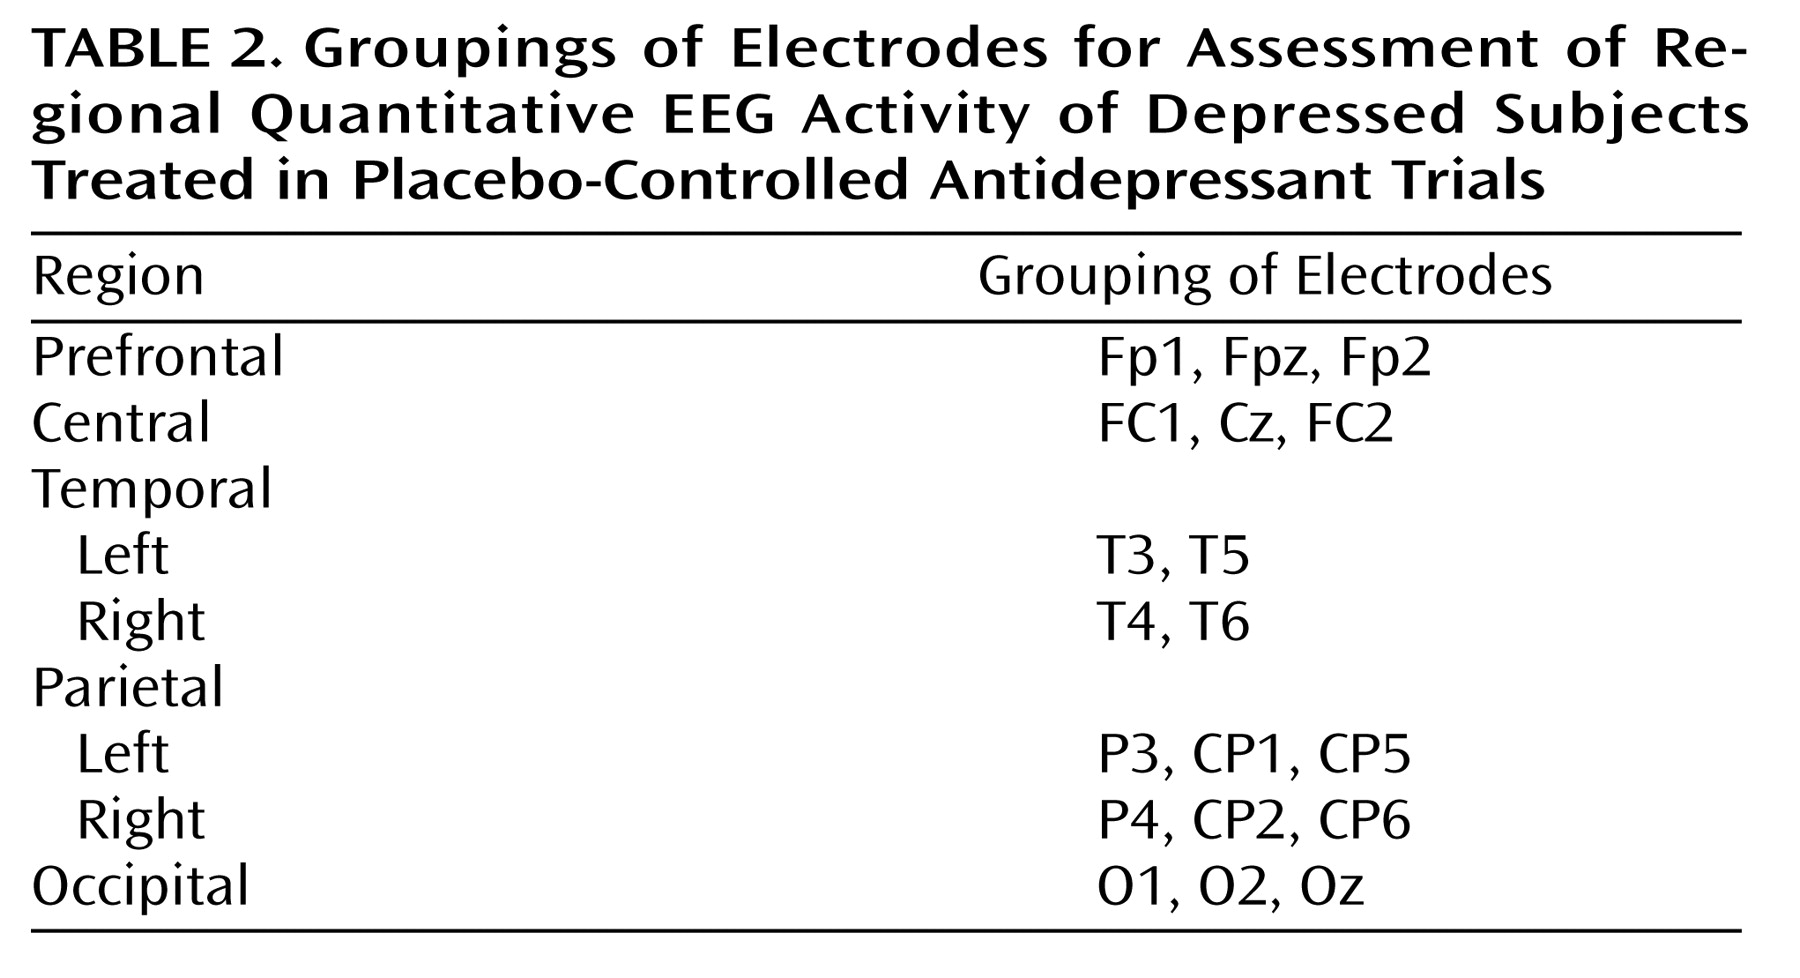
Figure 1). To limit the number of statistical comparisons, we grouped subsets of the individual electrodes into regional measures to reflect the major brain functional areas (
Table 2). QEEG power or cordance values from electrodes in these groups were averaged together to obtain the regional measure. We also further limited our analysis to the theta frequency band (4–8 Hz), because our previous work and work from other laboratories has indicated that energy in the theta band is most strongly associated with treatment outcomes in depression
(17,
21,
22).
Data Analysis
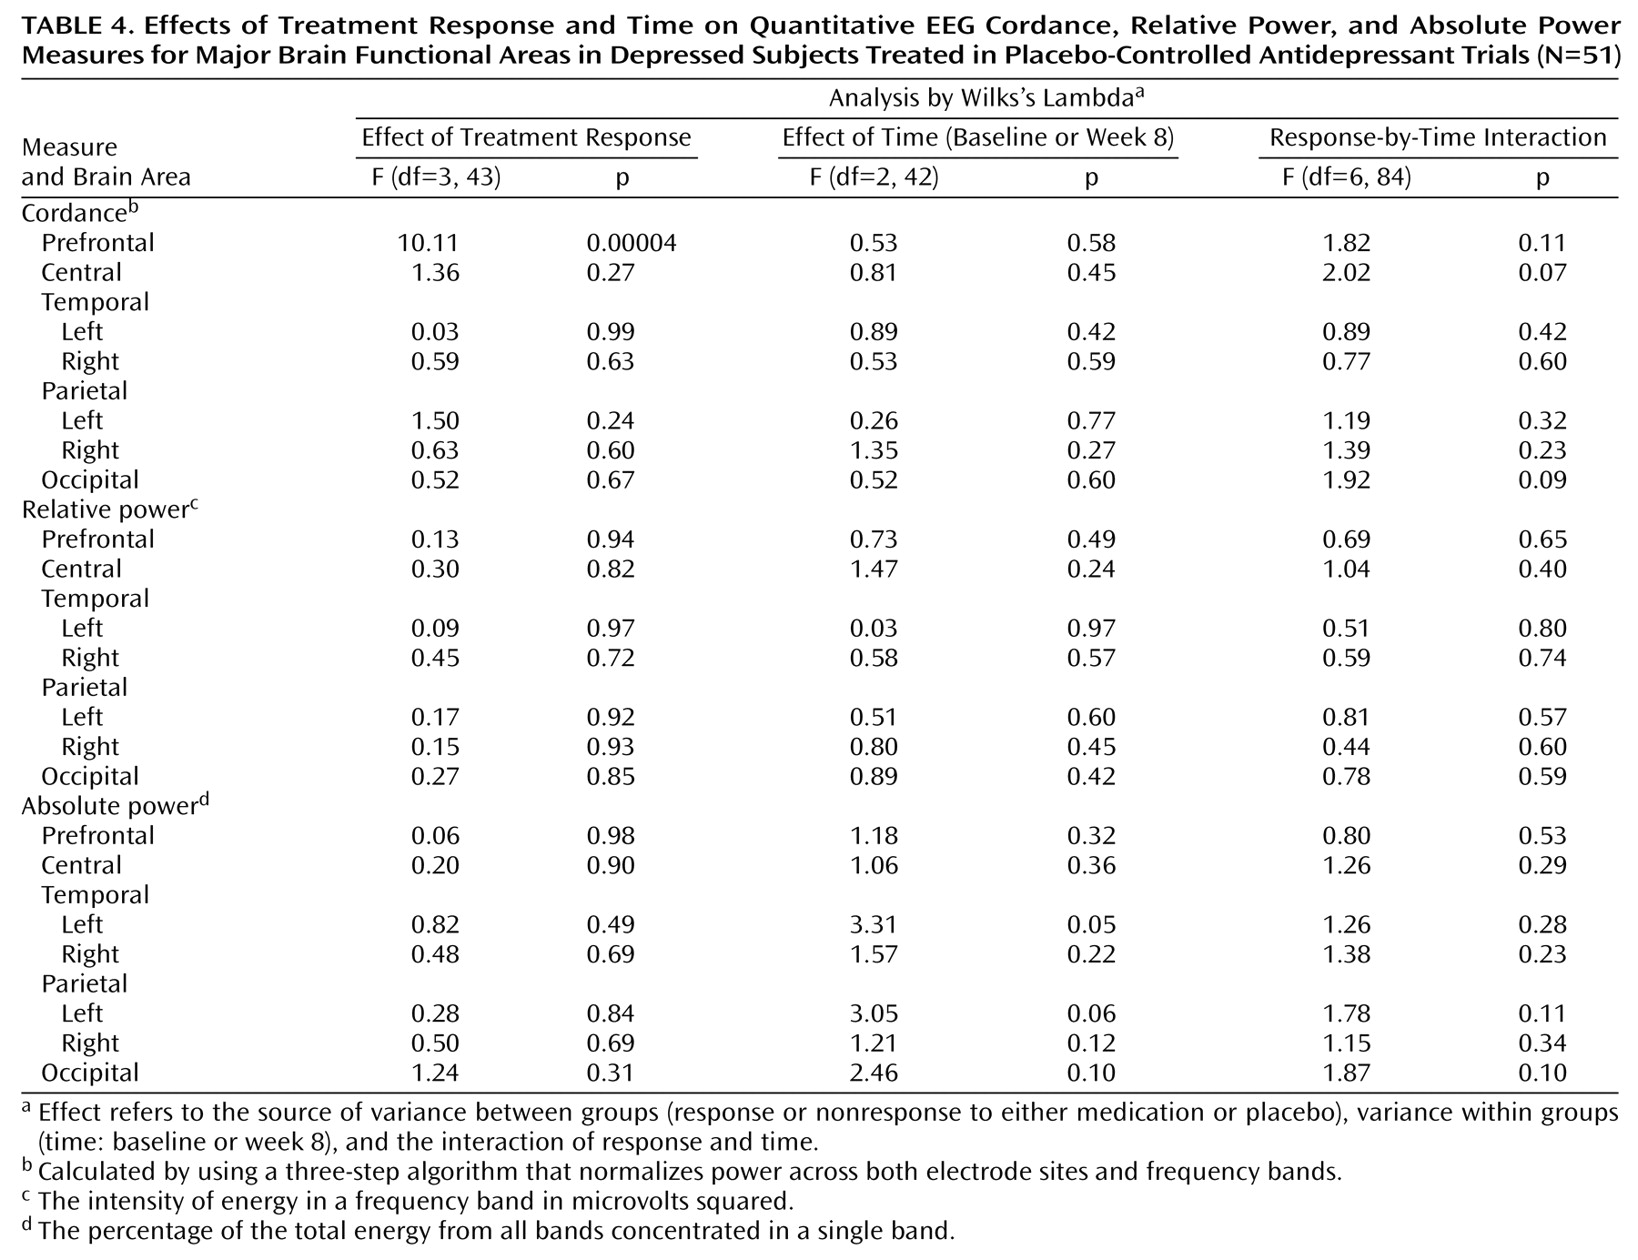
Power and cordance values from the baseline QEEG recording were examined to test for differences in any brain region among the four outcome groups, and no differences were found (p>0.25 for power and cordance for all regions). Absolute and relative power and cordance values for each brain region of interest were therefore calculated for each subject as change from baseline at the 2-, 4-, and 8-week QEEG recordings (the QEEG value at the subsequent visit minus the baseline value). The absolute power, relative power, and cordance data then were analyzed by using three separate repeated measures analyses of variance (ANOVAs), with treatment response as the between-group factor (medication responder, placebo responder, medication nonresponder, placebo nonresponder) and time as the within-group factor (2 weeks, 4 weeks, and 8 weeks). The analysis tested the hypothesis that there was no change in neurophysiologic brain function in depressed subjects over the course of 8 weeks of treatment with either antidepressant medication or placebo by using a full-factorial model to test the response effect, the time effect, and the time-by-response interaction. The equality of covariance matrices across groups was tested with Box’s test statistic, which yielded a p value of 0.26, indicating that the assumption of equality of covariance matrices was reasonable. Where the main effect was significant, group differences were examined with a Bonferroni adjustment to control for multiple comparisons.
Discussion
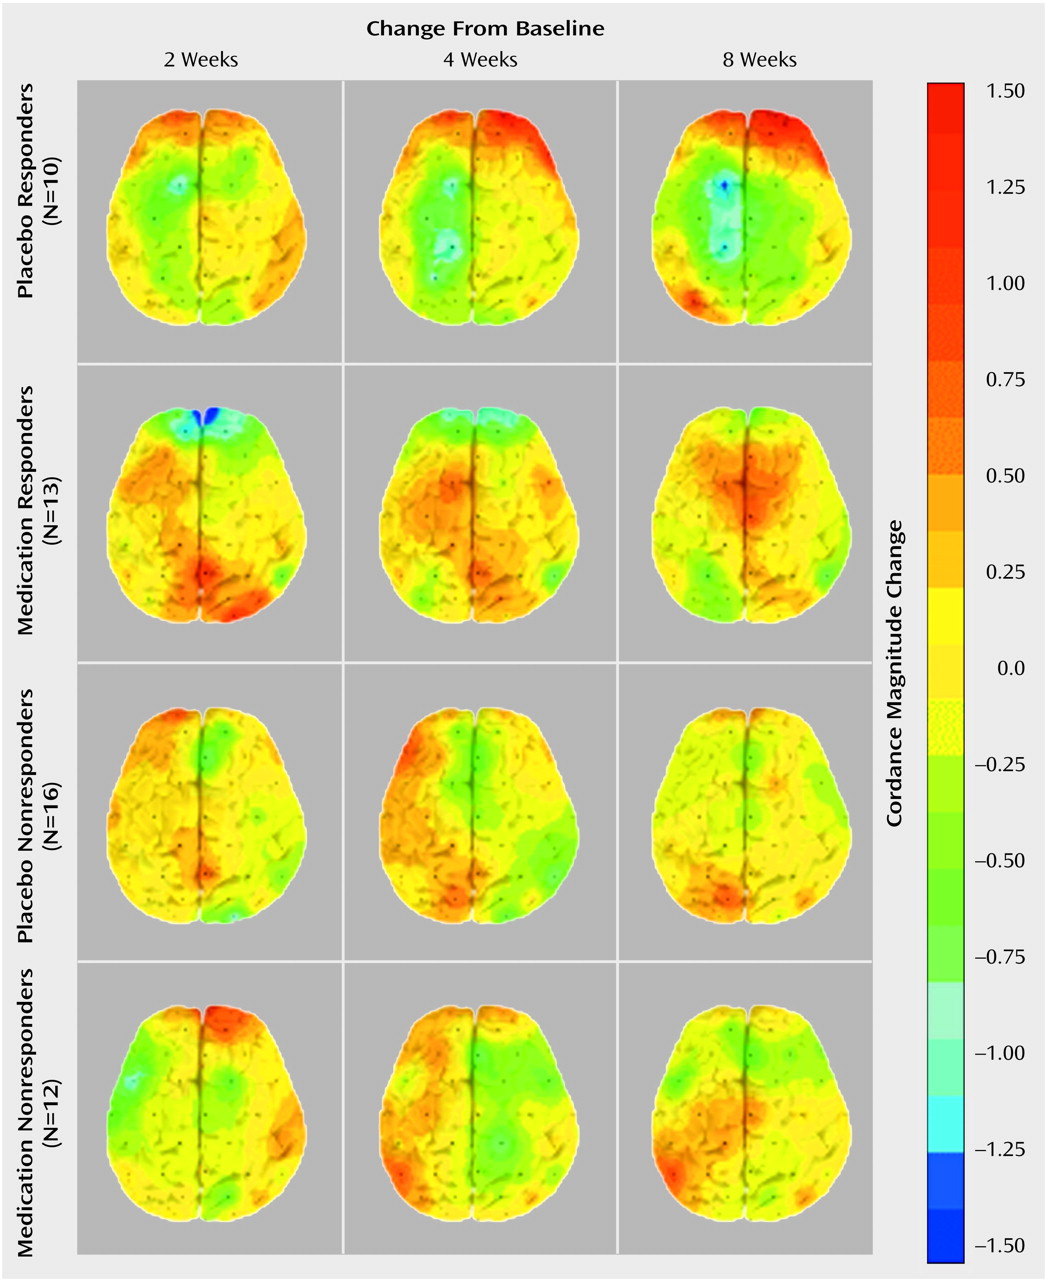
To our knowledge, this is the first study that has compared subjects treated with placebo and antidepressant medication and documented brain functional changes during treatment in both groups. This study demonstrates that although the symptomatic improvement resulting from placebo and medication treatment may be similar, the two treatments are not physiologically equivalent. Both treatments affect prefrontal brain function, but they have distinct effects and time courses.
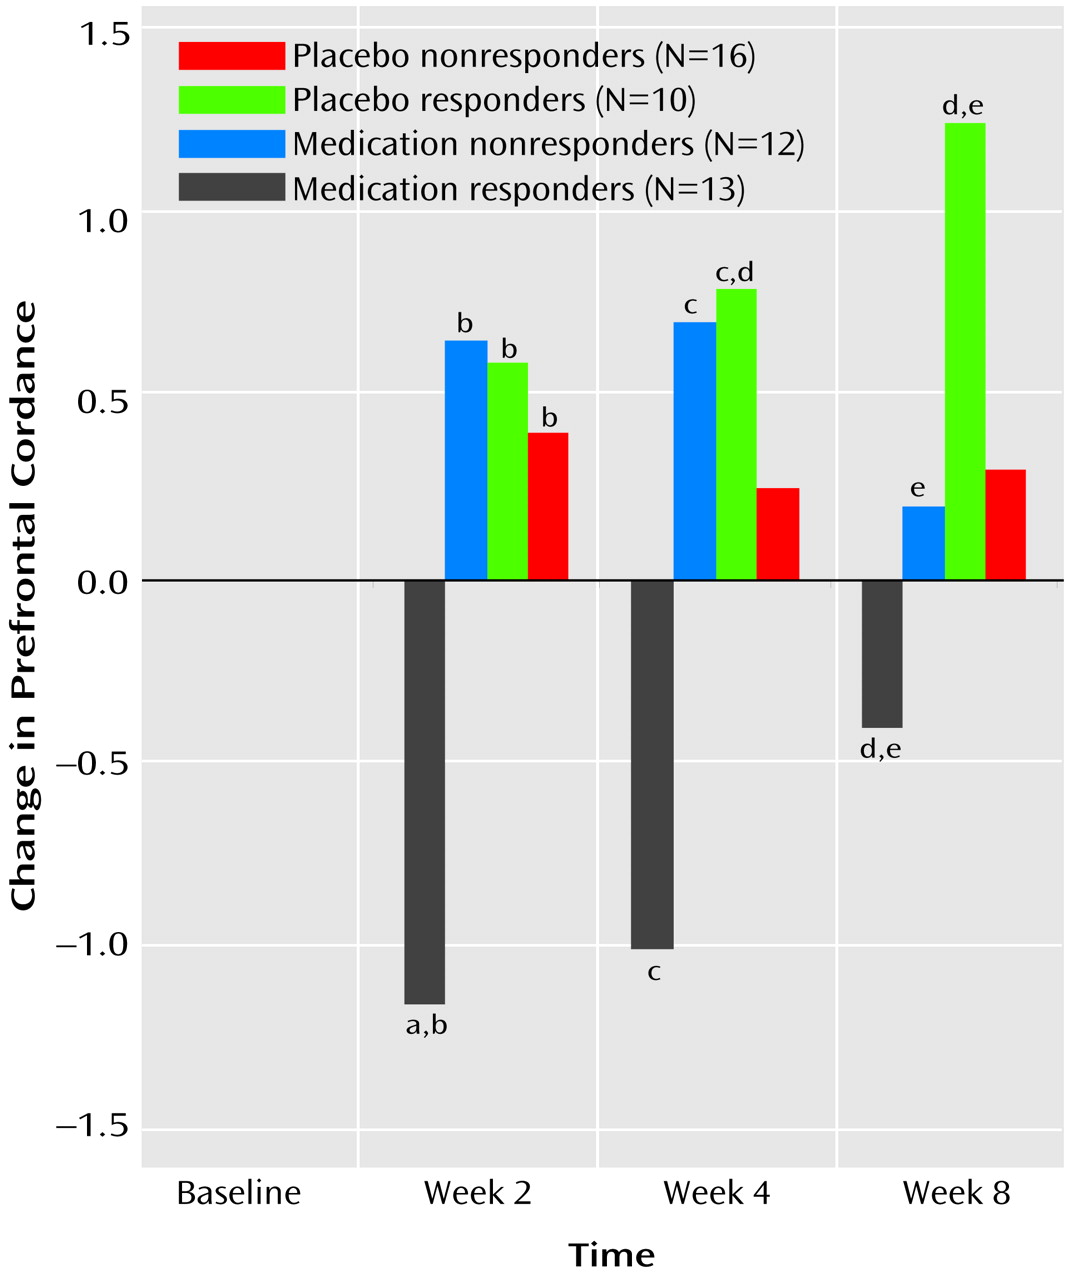
These findings showing decreased prefrontal cordance in depressed subjects responding to antidepressant medications are consistent with previous research showing decreased prefrontal metabolism or perfusion in treatment responders, regardless of the medication or treatment modality examined (e.g., ECT)
(8–
12). The fact that the placebo responders showed an increase in prefrontal cordance and that the medication responders showed a decrease may help to explain some of the previously observed heterogeneity in PET studies of patients treated for depression. Although most studies of depressed patients have shown that prefrontal metabolism and/or perfusion decrease in response to successful treatment, several have reported increases in metabolism or perfusion after treatment response
(23,
24). The current results suggest that higher levels of perfusion or metabolism during treatment for depression may be associated with a placebo response. None of the previous studies included a placebo control, so it is not possible directly to compare metabolism in placebo responder and medication responder groups. Furthermore, the previous studies did not report information on the pattern of change in symptoms, which might be helpful in distinguishing placebo responders from medication responders.
Few clinical characteristics can be used to distinguish placebo responders from medication responders. Placebo responders are slightly more likely to have mild depressive symptoms and to have been depressed a relatively short period of time
(25,
26). None of these features has sufficient discriminating power to be useful clinically. The most robust clinical predictor of a placebo response is the time course of improvement in symptoms. Quitkin and colleagues
(27) have shown that early, abrupt, or nonpersistent responses are characteristic of response to placebo. Subjects who improved during medication treatment but who had the characteristic placebo pattern of response were more likely to suffer a relapse of symptoms during short-term or continuation treatment
(2,
28,
29). The results of this study are not consistent with the results of pattern analysis. In this study, the placebo responders were slightly but not significantly more likely than the medication responders to show an early response to treatment, and both groups showed symptom improvement that was well sustained. The differences between our results and those of Quitkin and colleagues could reflect the particular characteristics of our subject population. In any case, the similarity of the clinical response patterns of placebo responders and medication responders suggests that the brain functional differences cannot be attributed solely to group differences in the time-course or persistence of symptom improvement.
The current results are consistent with previous studies that found differences in brain function between placebo responders and medication responders. A meta-analysis suggested that nonsuppressors on the dexamethasone suppression test were less likely to respond to placebo
(30). One study recently examined brain chemistry by using magnetic resonance spectroscopy in subjects showing either the placebo or true-drug patterns of response (as defined by Quitkin and colleagues) during fluoxetine treatment
(31). This study found that subjects with the placebo pattern showed a decrease in the choline-creatine ratio in the basal ganglia over time, while those with the true-drug pattern showed an increase in this ratio.
The finding of brain functional changes during “effective” placebo treatment, which are distinct from those associated with effective medication treatment, cast doubt on two commonly held beliefs about placebo treatment. First, administration of an inert pill (in the setting of a research study) appears to be an active treatment, rather than the no-treatment comparison it has been thought to provide. Brain physiology was significantly altered in the placebo responder group, not only in comparison to this group’s baseline state, but also in comparison to medication responder, medication nonresponder, and placebo nonresponder groups.
Second, these results suggest that a placebo response is not functionally equivalent to an active drug response. Brain physiology in placebo responders was altered in a different manner than in the medication responders. Placebo responders showed a change in prefrontal cordance that differed both in direction and in time course from the change in the medication responders. This qualitative difference casts in a new light the assertion that 50%–75% of antidepressant drug effect consists of a placebo effect
(2), since symptom improvement was not associated with a similar physiologic alteration in the medication responder and placebo responder groups. It is important to note, however, that these data do not prove a causal link between brain functional changes and the therapeutic effect of either medication or placebo. Further studies examining brain function in other conditions, including both no-treatment and psychotherapy conditions, would be necessary to elucidate the degree and type of functional change that may be uniquely associated with medication and placebo.
The current results indicate the value of studies monitoring brain function in placebo-treated patients, since such studies may reveal novel physiologic mechanisms underlying symptom improvement. One recent meta-analytic study, which disputed the significance of the placebo response, concluded that “it is difficult to distinguish between reporting bias and a true effect of placebo on subjective outcomes”
(32). Brain functional measures may in fact provide a valuable physiologic evaluation of the nature and significance of apparent placebo responses. True placebo responses may be these that are associated with singular changes in prefrontal function.
Since placebo and active medication may have distinct mechanisms of action, it would be important to determine if any outcome differences are associated with these different mechanisms. Future studies that use brain functional measures should characterize multiple dimensions of the nature of improvement in placebo-treated patients, including longer-term follow-up of mood symptoms and other dimensions of improvement (e.g., quality of life and functional status measures). The results of this study, if replicated, suggest a role for cordance or other brain functional measurements in effectiveness studies of prospective antidepressant agents. Future studies using functional imaging may help both to distinguish the effects of antidepressant medication from those of placebo and to elucidate the mechanisms through which placebo treatment ameliorates depressive symptoms.
